

Ecoinometrics - Regime Change
Ecoinometrics - Regime Change
November 29, 2021

Something good about Bitcoin is that it tends to be uncorrelated to most other major asset classes.
In particular, outside of liquidity crises where everything tends to move in parallel, Bitcoin and the stock market have been largely decoupled. But is it changing?
The Ecoinometrics newsletter decrypts the place of Bitcoin and digital assets in the global financial system. If you want to get an edge in understanding the future of finance you only have to do one thing, click on the subscribe button right below:
Done? Thanks! That’s great! Now let’s dive in.
Regime change
If you remember, last year in March all financial assets came crashing down as a result of the COVID crisis.
Back then a lot of people started to worry about diversification: “if Bitcoin is down -50% when the stock market is crashing why am I holding it?”
The answer of course was “just zoom out”. Over a long enough period of time Bitcoin is not correlated to the stock market.
The fact that during the brief sequence where everything crashed and then everything pumped we have seen a higher correlation than usual between Bitcoin and the SP500 doesn’t mean much. This is just what you expect during a liquidity crisis and a recovery fuelled by money printing.
But we have moved away from that event, yet Bitcoin seems to be more correlated to the SP500 than usual.
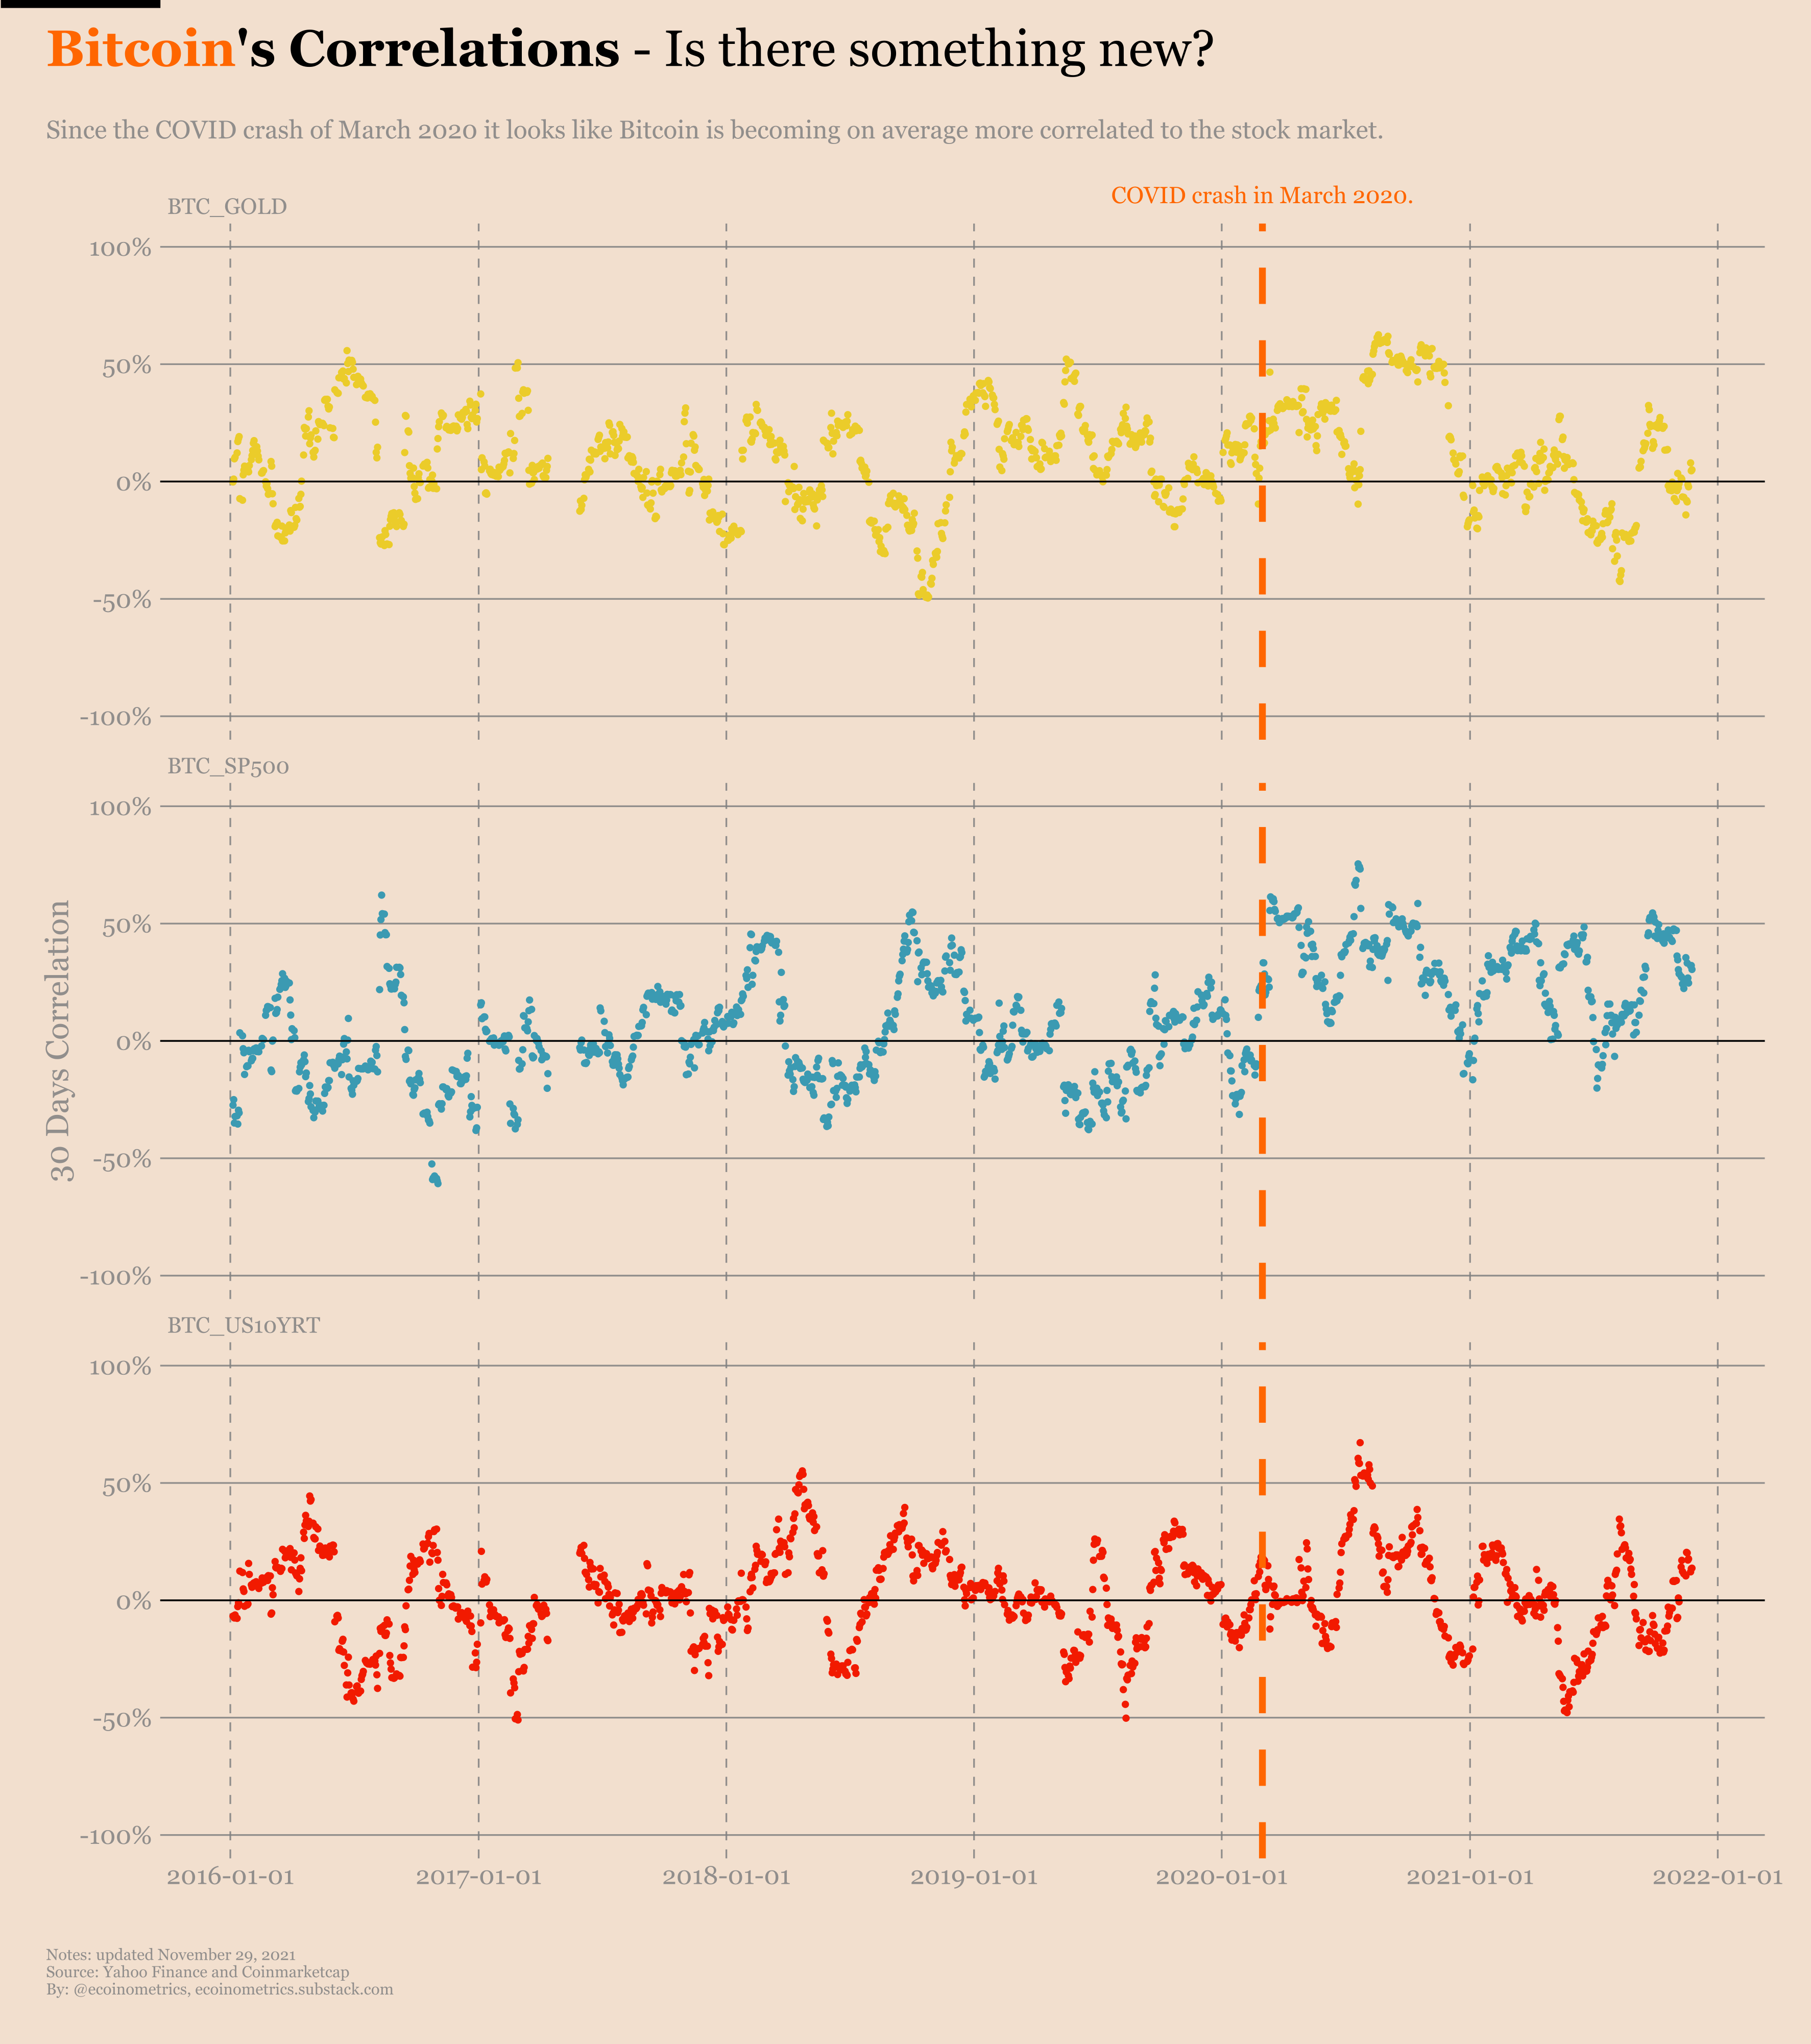
Take a look at the chart below. You can see the one-month correlation score between Bitcoin and gold, Bitcoin and the SP500, Bitcoin and the US 10-year Treasury yield.
Before the COVID crisis those correlation scores average around 0 i.e. BTC is uncorrelated to those assets.
After the COVID crisis there is no difference for the 10-year yield, the correlation to gold settles back down but the correlation to the SP500 seems to be averaging at a higher level than before the crisis.
See for yourself.
Let’s zoom in on that period and overlay the price of Bitcoin to see if there is any pattern.
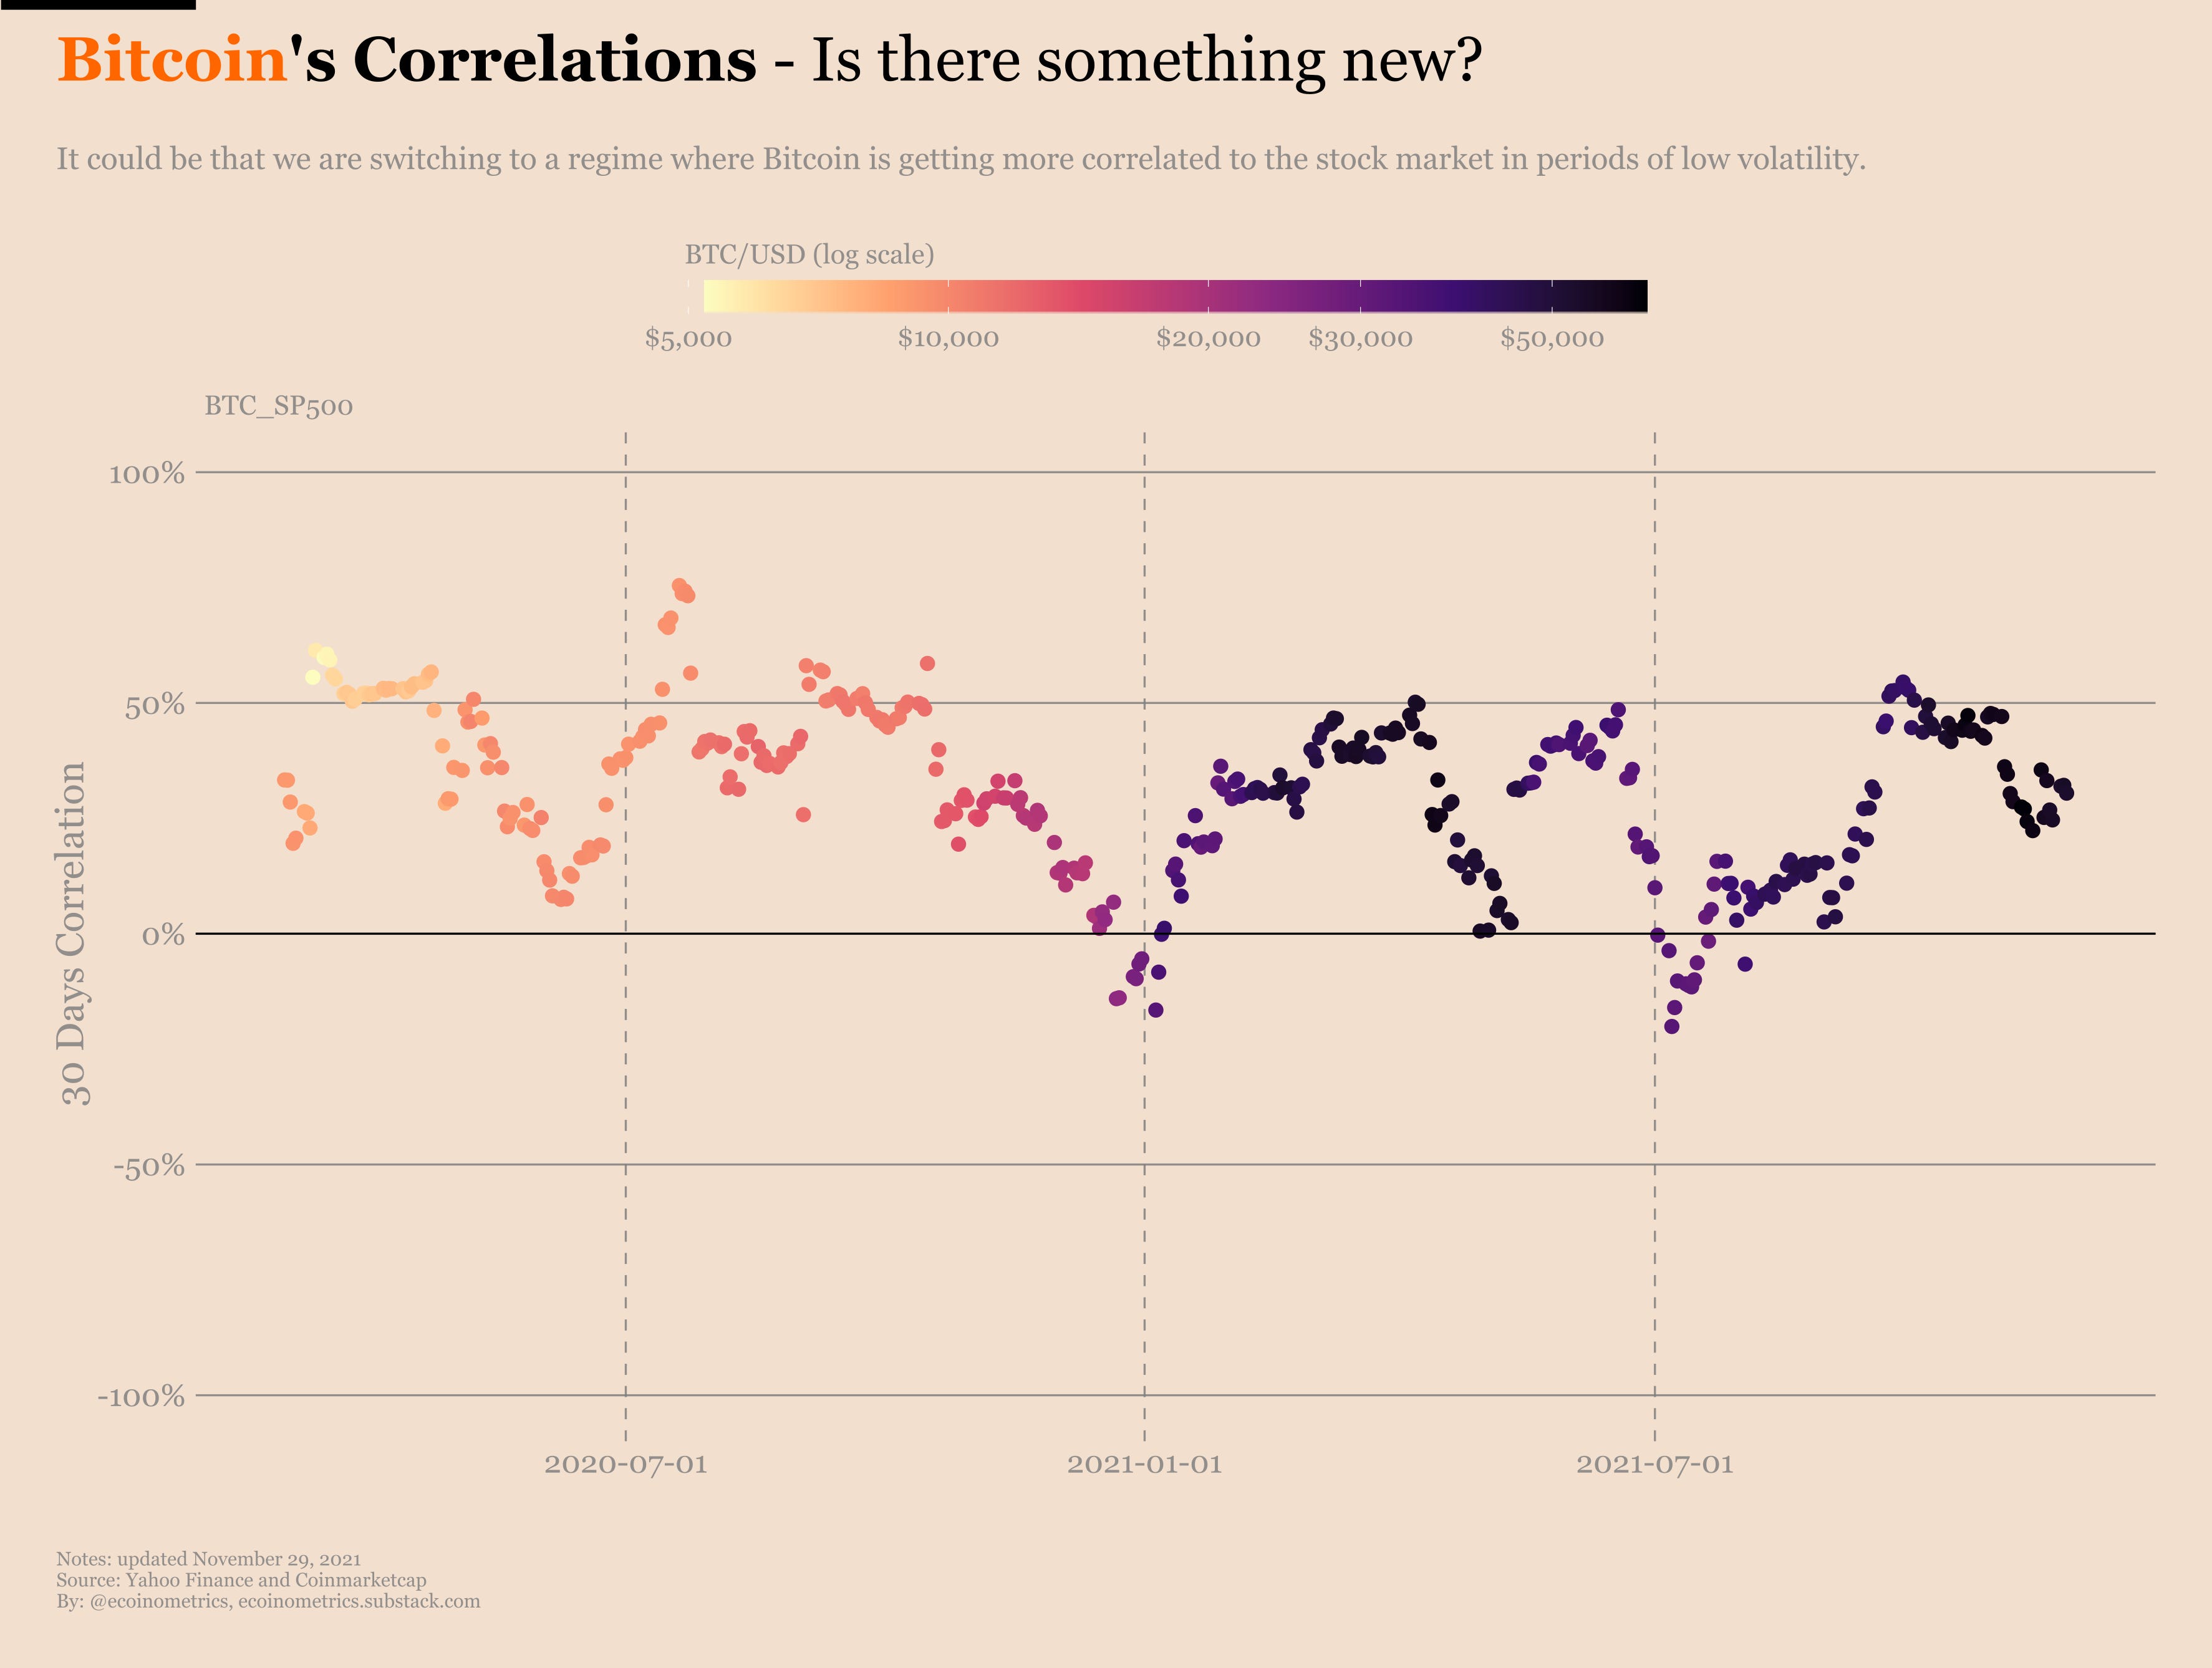
I don’t know about you, but what I see is that when Bitcoin settles in periods of lower volatility then the correlation to the stock market increases. When we get volatility spikes the correlation goes back down towards zero.
Since March last year this correlation score has averaged around 25%, so this isn’t a crazy high level to be fair.
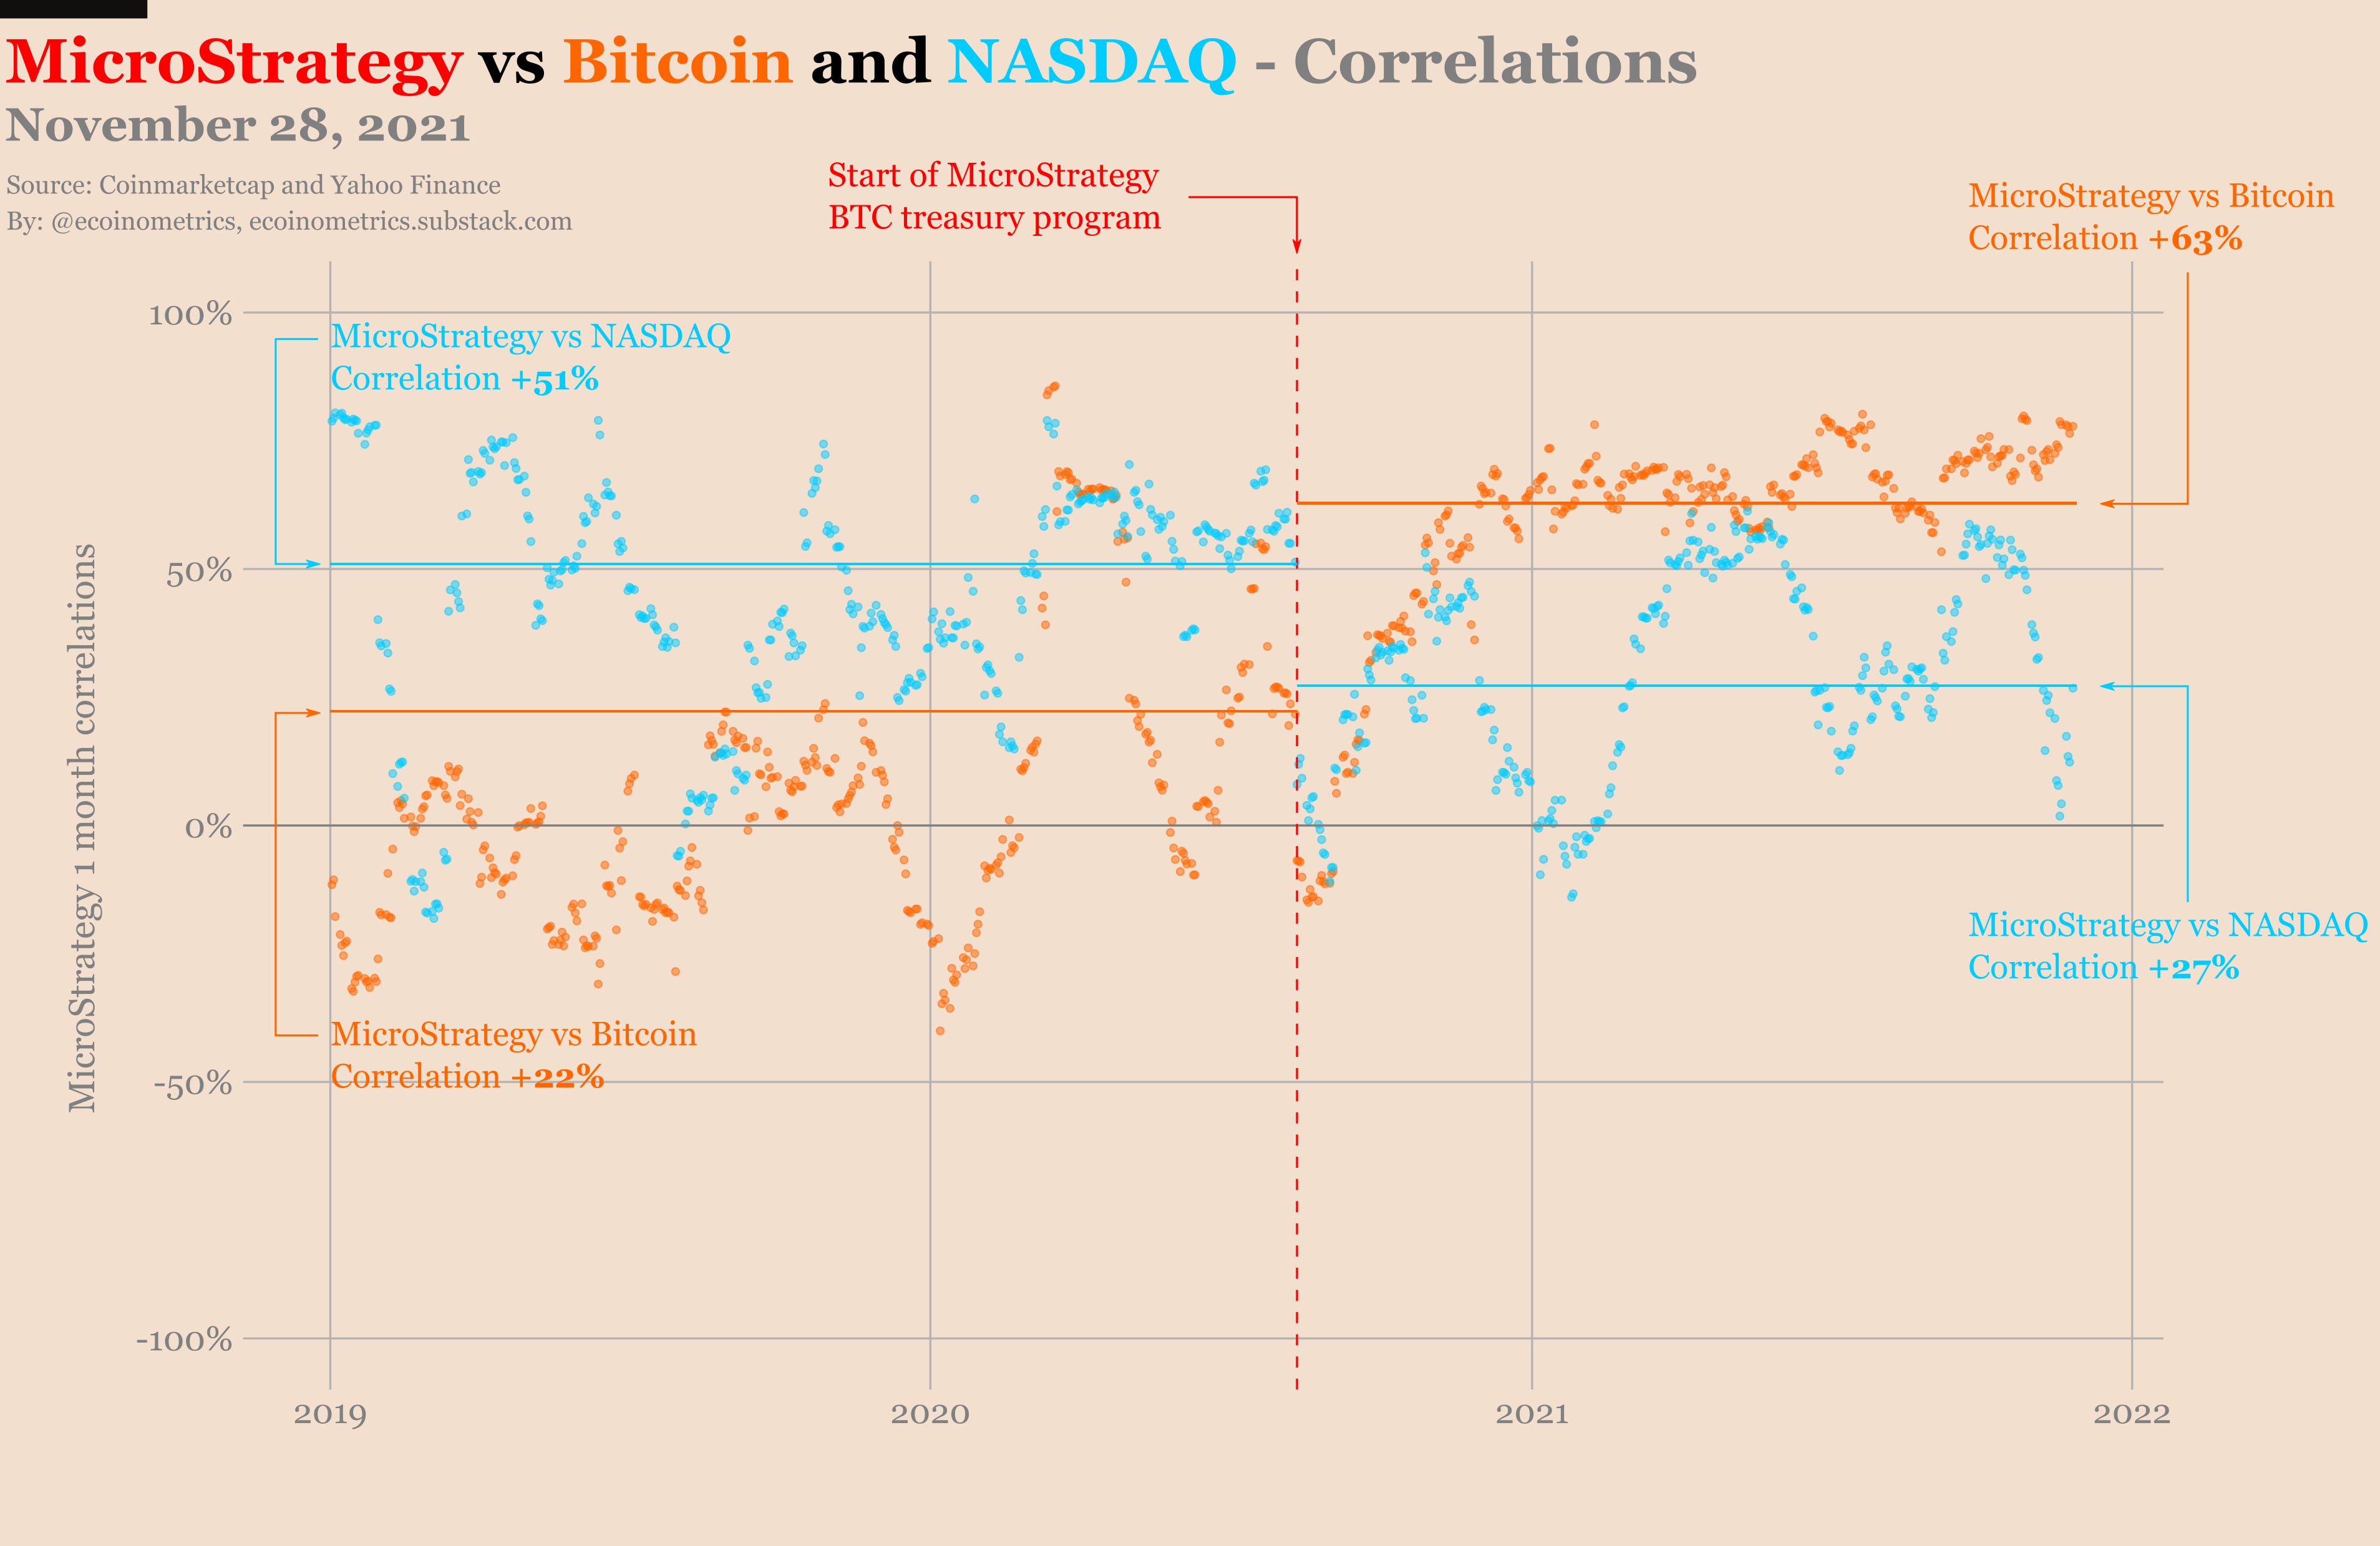
For reference MicroStrategy (i.e. a pseudo-ETF) has had a stable 63% correlation score with Bitcoin since they started their treasury program. That’s what a real correlation is about!
So for all practical purposes you can still consider BTC and the stock market as independent bets.
If anything this new trend probably tells us how mainstream investors are starting to categorize Bitcoin:
Stocks = risk assets.
Bitcoin = super risk asset.
Jokes aside, this might be a hint of what’s to come.
If Bitcoin becomes more tame it is likely we’ll see a growing overlap between investors holding traditional tech stocks and the ones holding BTC. That might increase the correlation score between those assets.
But time will tell.
Market conditions
As I write those lines on Monday, Bitcoin is bouncing back from the bottom of this correction but it is still -15% down from the all-time high.
Honestly, unless it is your first time investing in the crypto markets, you shouldn’t be impressed by this kind of move.
Only the balance sheet of the Federal Reserve can get away with parabolic moves without having to deal with big corrections. For everyone else the price to pay for a 2x, 4x, 8x is the double digits dips that follow.
So just talking about the magnitude of this correction without looking at the rest of the market conditions doesn’t tell us much.
To get a more complete view of the situation lets dig deeper.
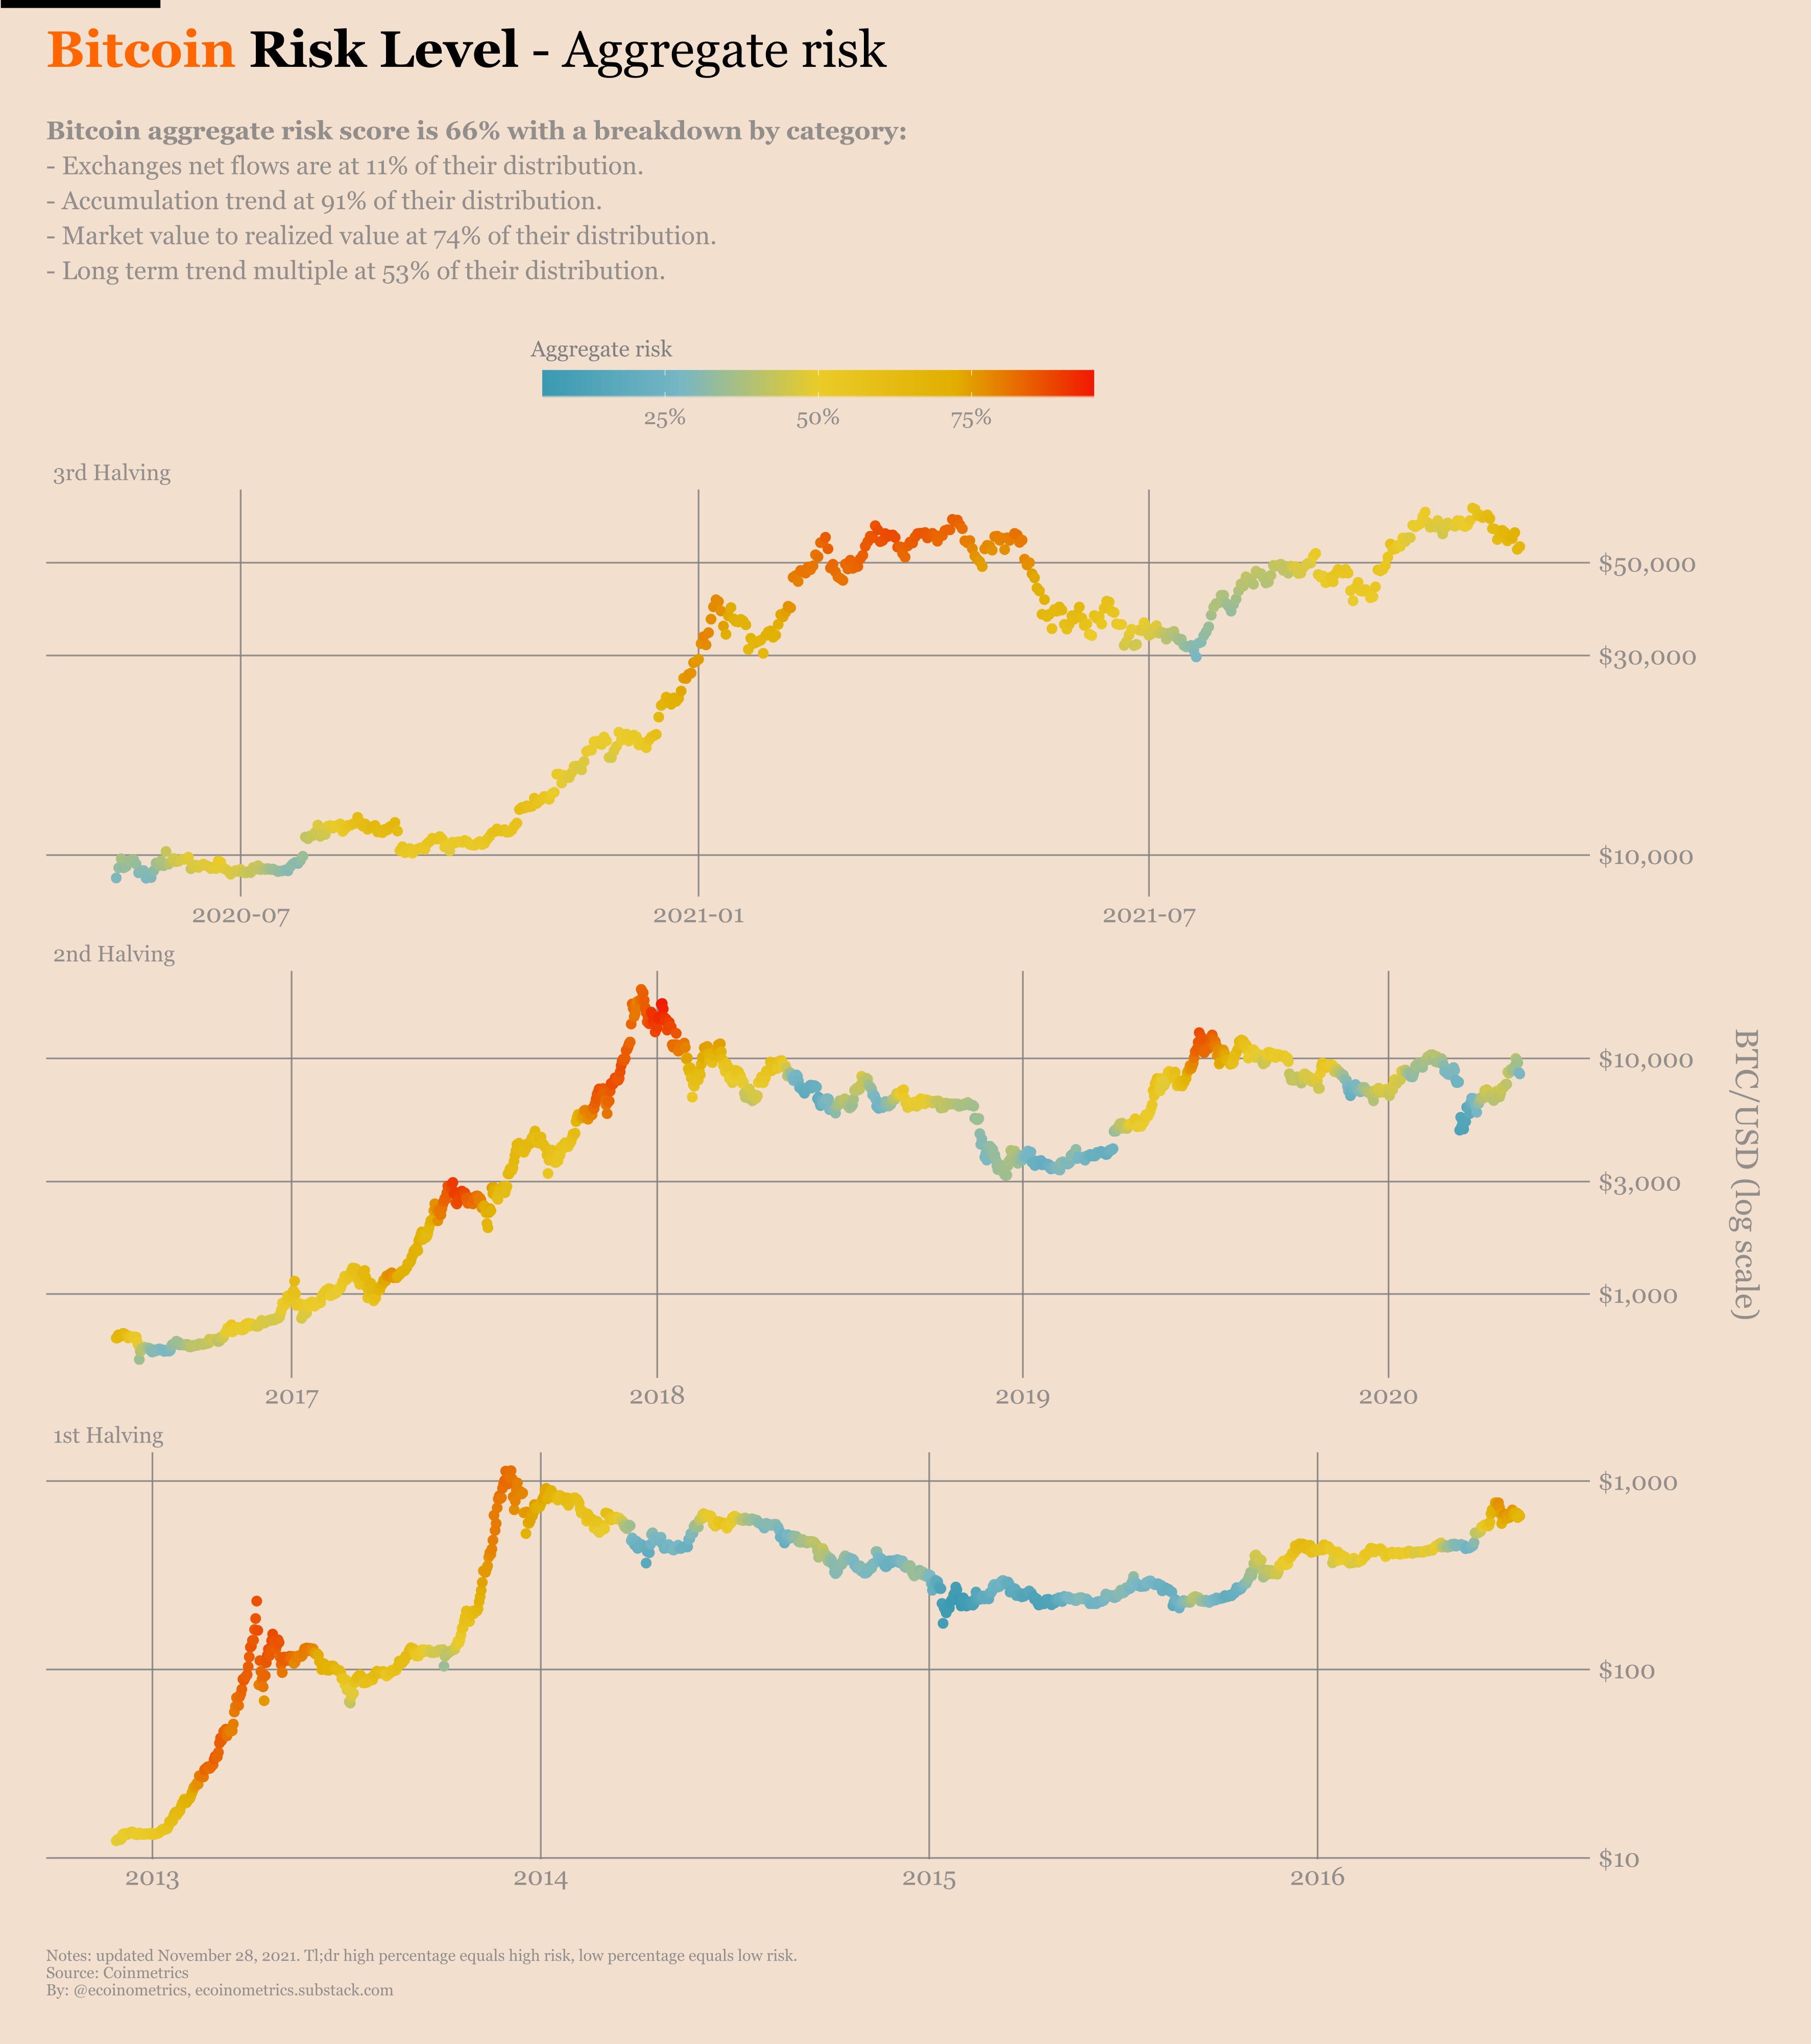
First of all checkout the aggregate risk score:
66% overall, which means the market is neither hot nor cold.
11% for the exchanges’ net flow, which means coins are still moving out of exchange wallets.
53% for the Mayer multiple, i.e. unsurprisingly the price is not overextended.
74% for the Market Value to Realized Value ratio, i.e. hodlers are in profit but not to extreme levels.
An abysmal 91% for the accumulation trend.
Right. So to decide if things can get worse in the short term we need to consider two questions:
Can we see some sudden exchange inflow? That would be bad for the price.
Can we see a restart of the accumulation trend? That would be good for the price.
Actually those two questions are linked.
If the accumulation trend restarts then there is no reason to see a reversal in the exchanges outflow.
If very few hodlers keep stacking sats then we are more likely to see coins getting offloaded to the exchanges.
Now the good news is that despite the price action it looks like things are turning around.
Yes, the accumulation trend looks bad. But the accumulation trend is a 30 days average so even if things start to get better it will take some time for the situation to be reflected in that metric.
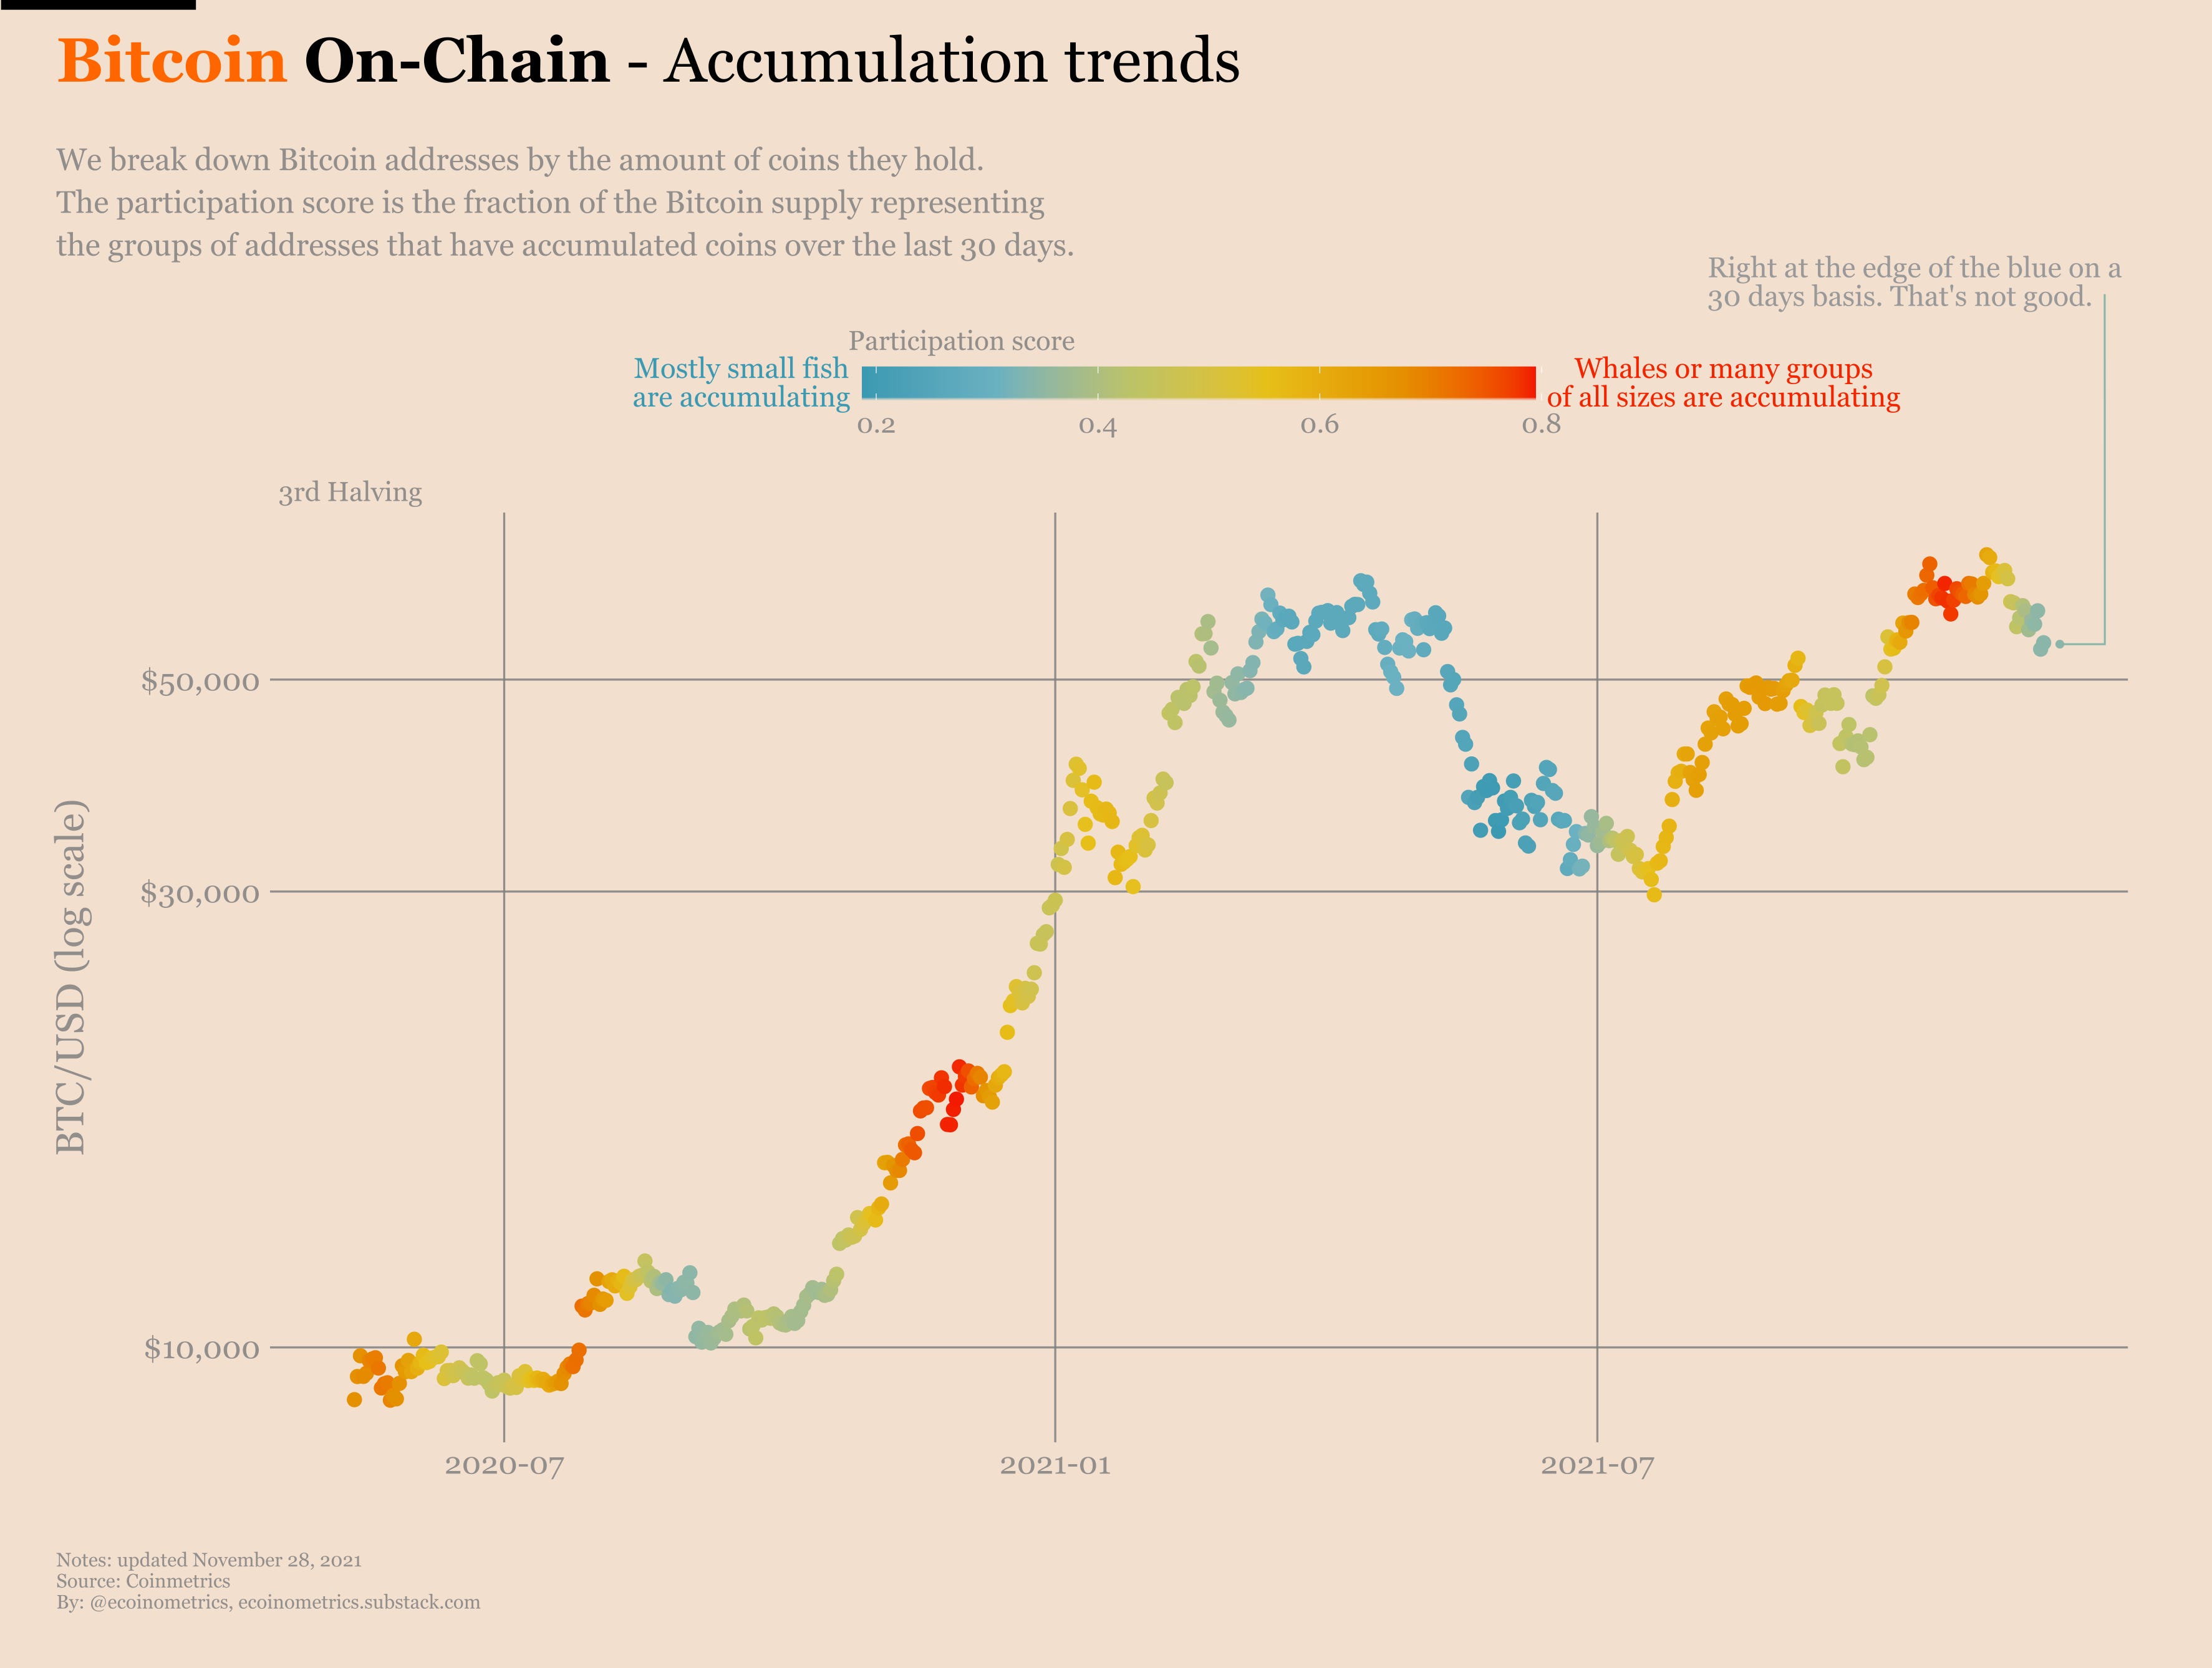
And when we look at the breakdown by buckets of addresses things are encouraging. If we continue on this trend the accumulation score will be out of the blue zone pretty fast.
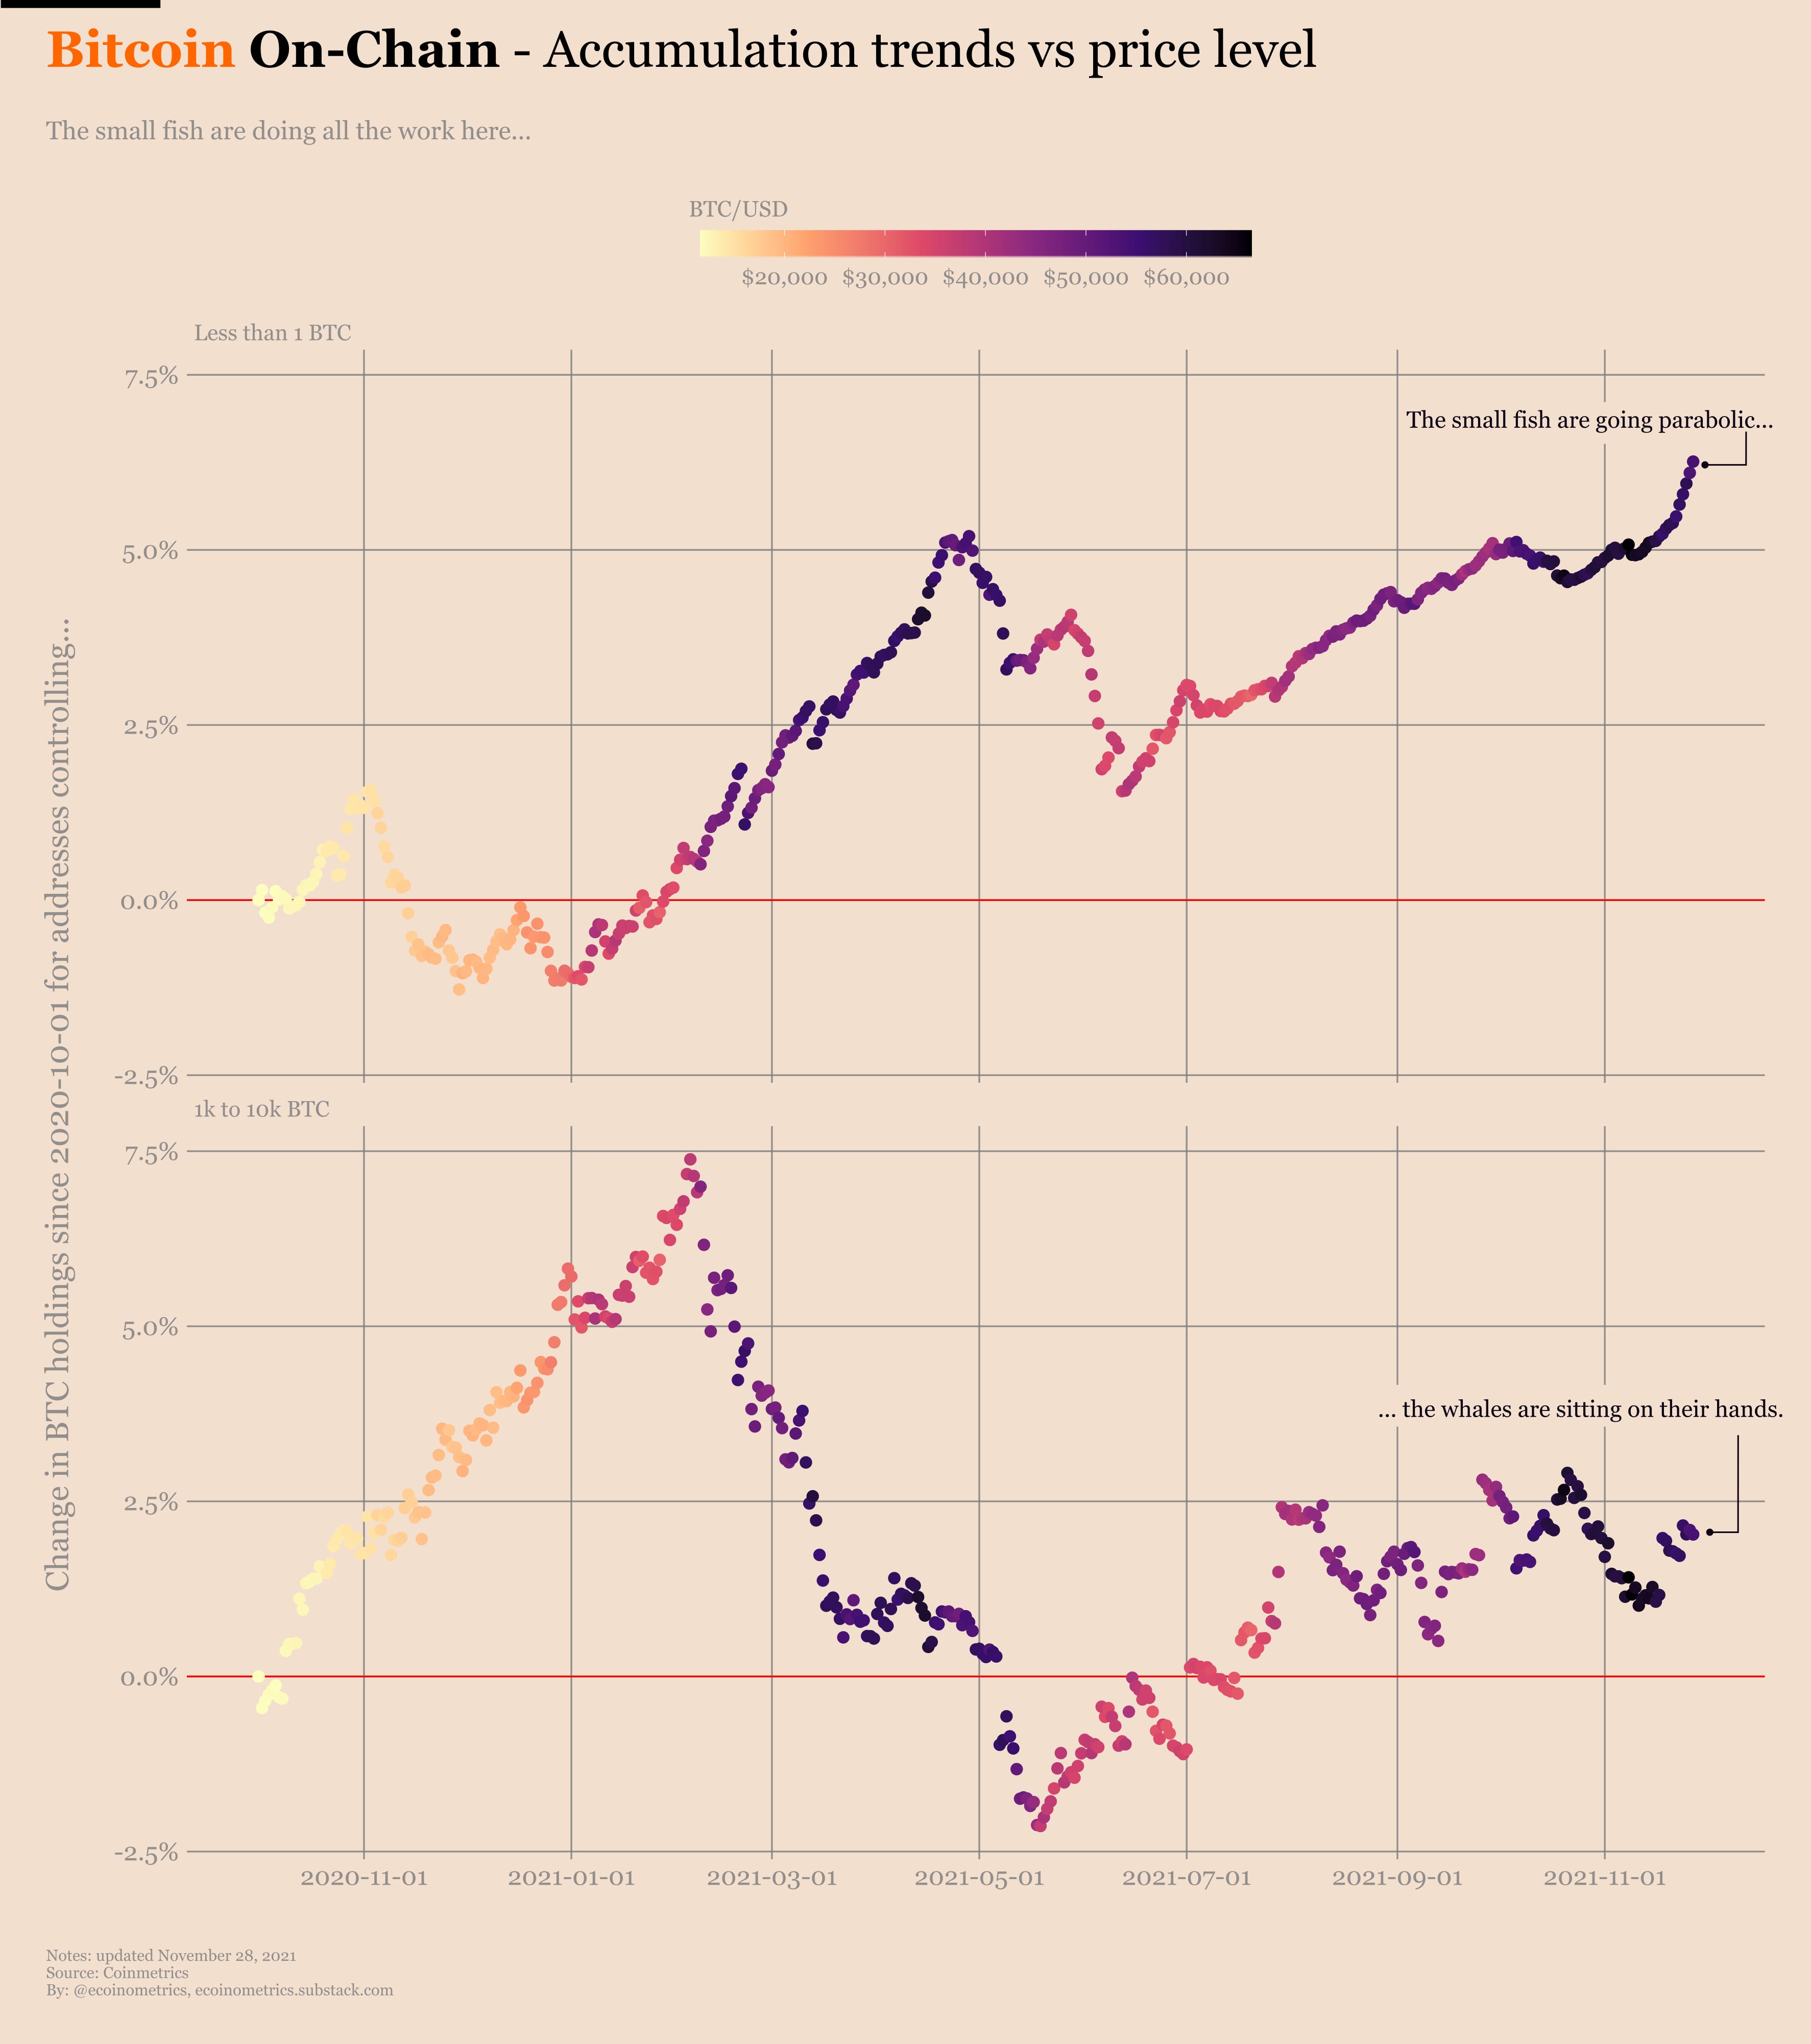
Actually the most impressive thing here is not that the whales have started to buy the dip, it is that the small fish are going parabolic. Check it out.
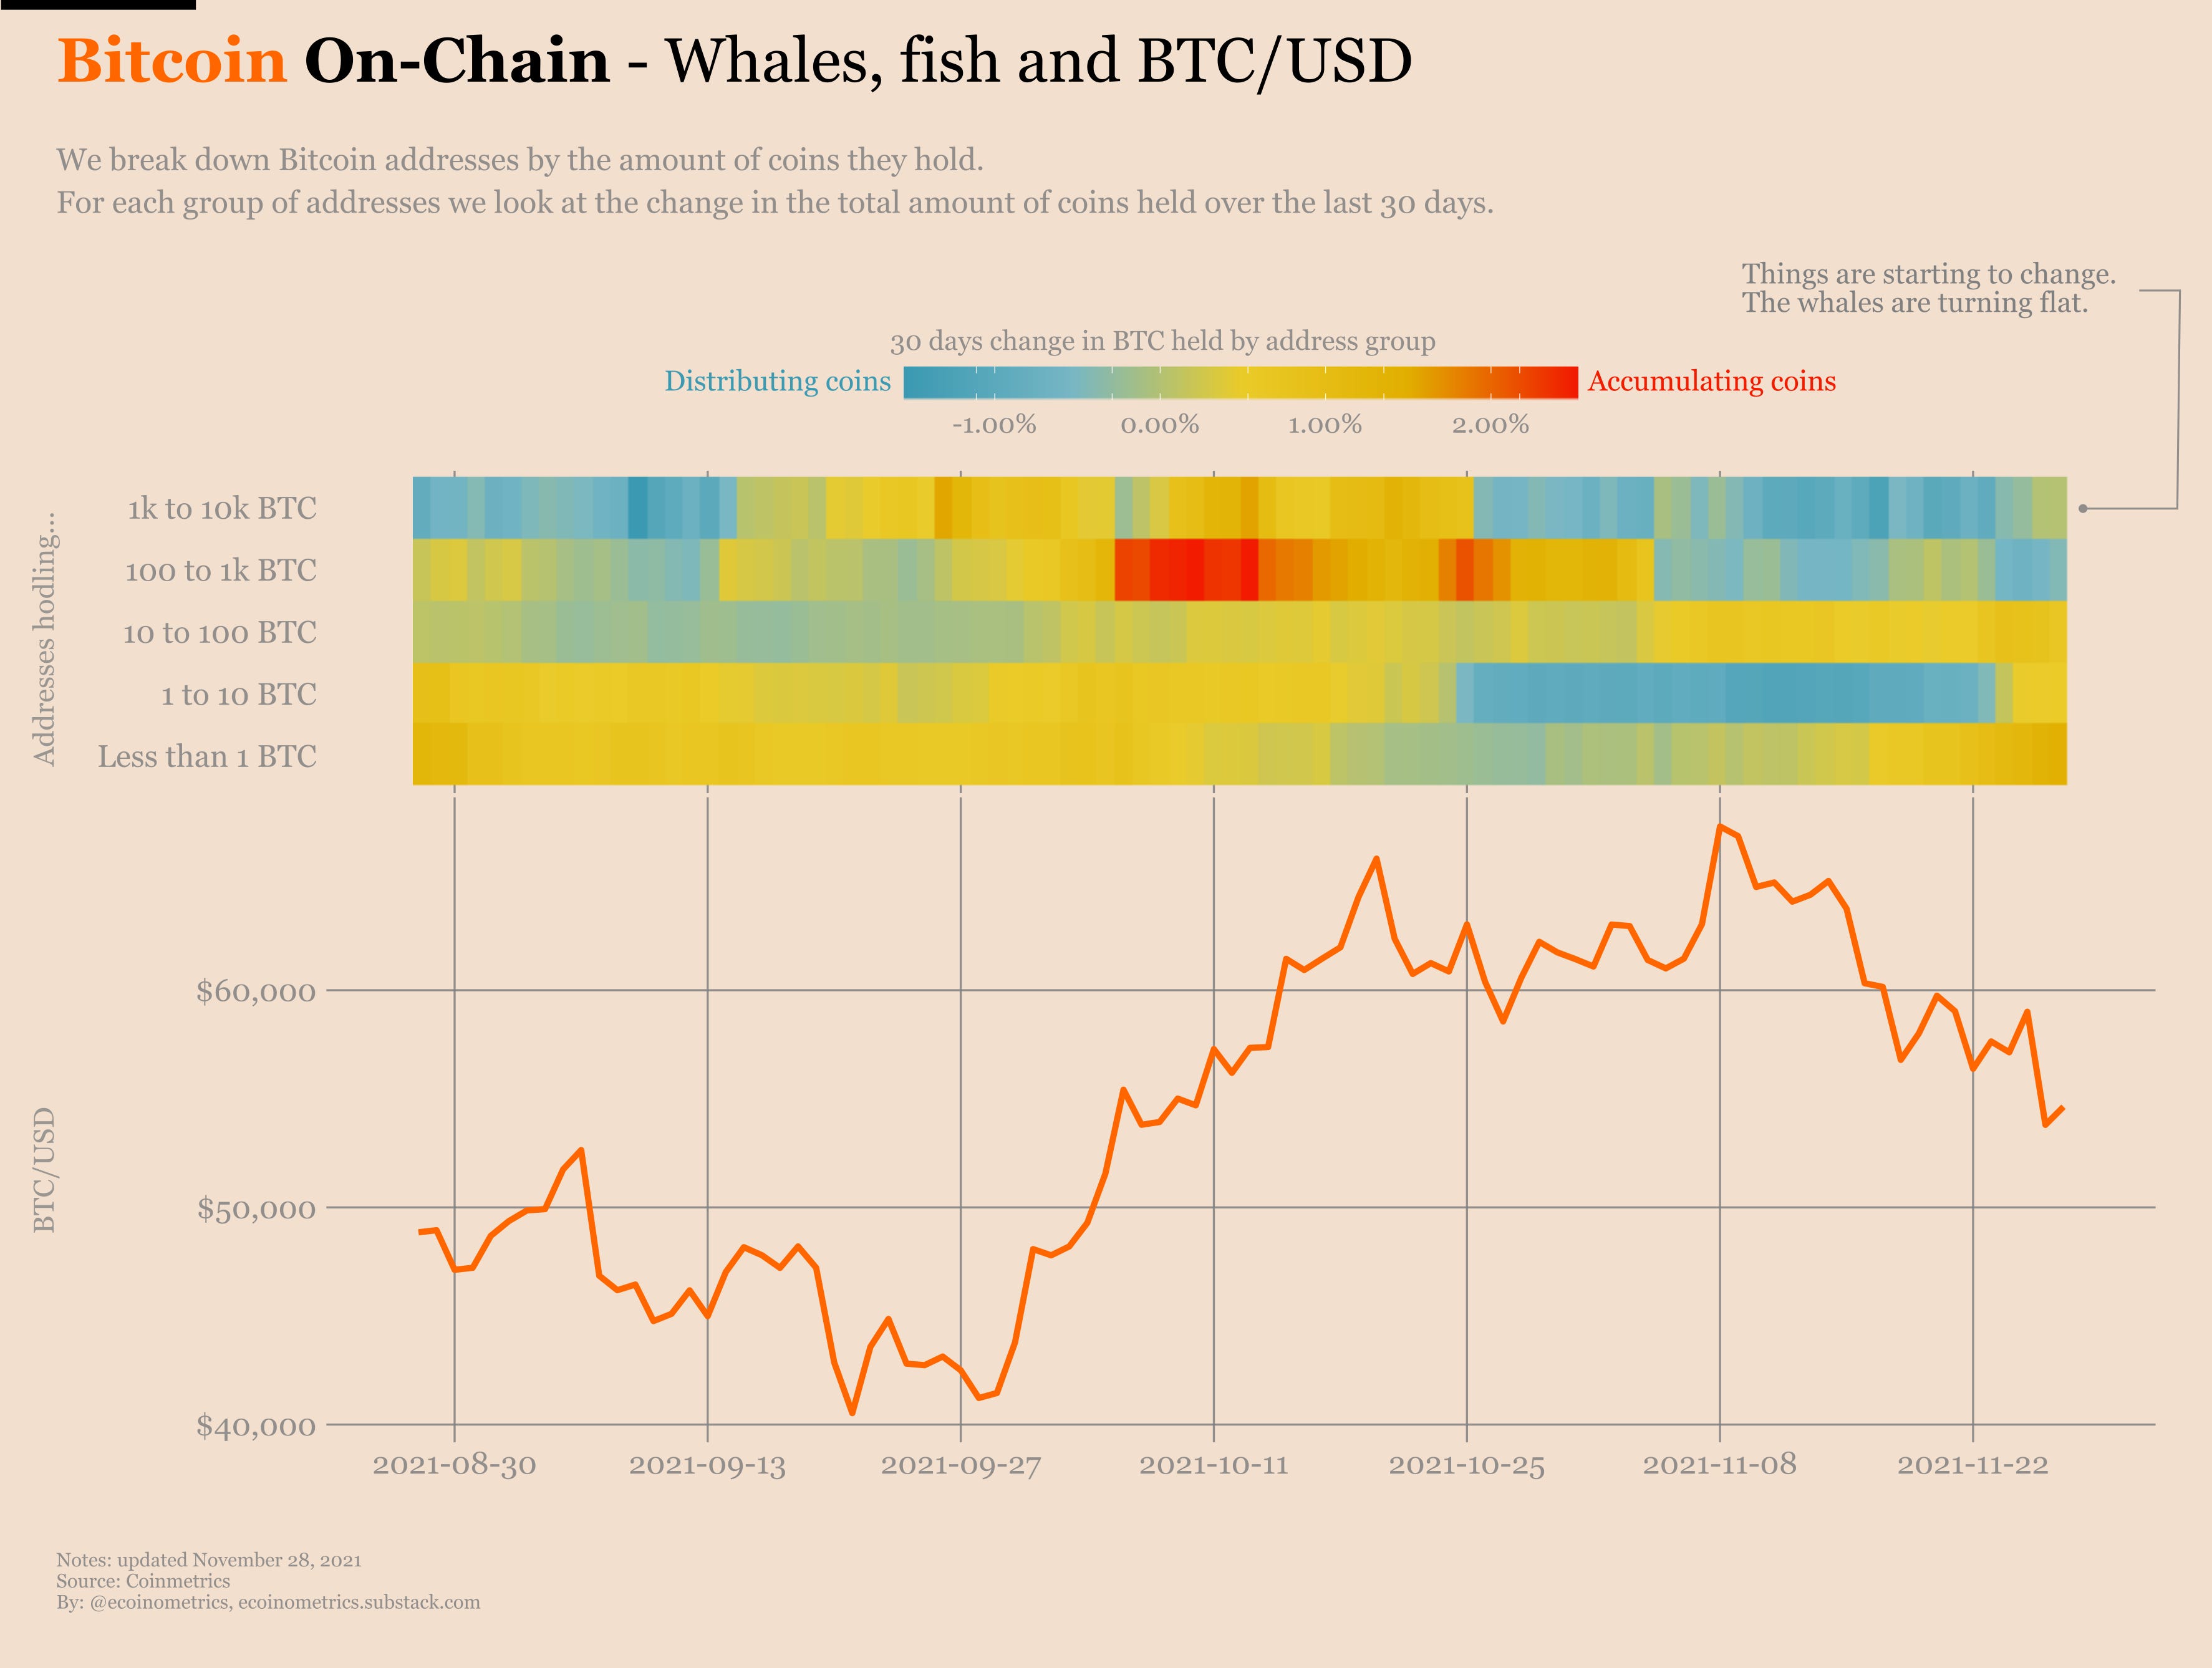
Now if we zoom out and focus on the longer trend, the situation is the following:
Addresses controlling less than 1 BTC are at their highest level of hodling since October last year.
Addresses controlling 1 to 10 BTC sold the price recovery in October but they are back at stacking sats.
Addresses controlling 10 to 100 BTC are also slowly raising their hodling level.
Addresses controlling 100 BTC to 1,000 BTC have not been doing much but their hodlings are up 15% from a year ago.
Addresses controlling 1,000 BTC to 10,000 BTC have not been doing much since Bitcoin reclaimed its all-time high.
Actually a picture is worth a thousand words so see for yourself.

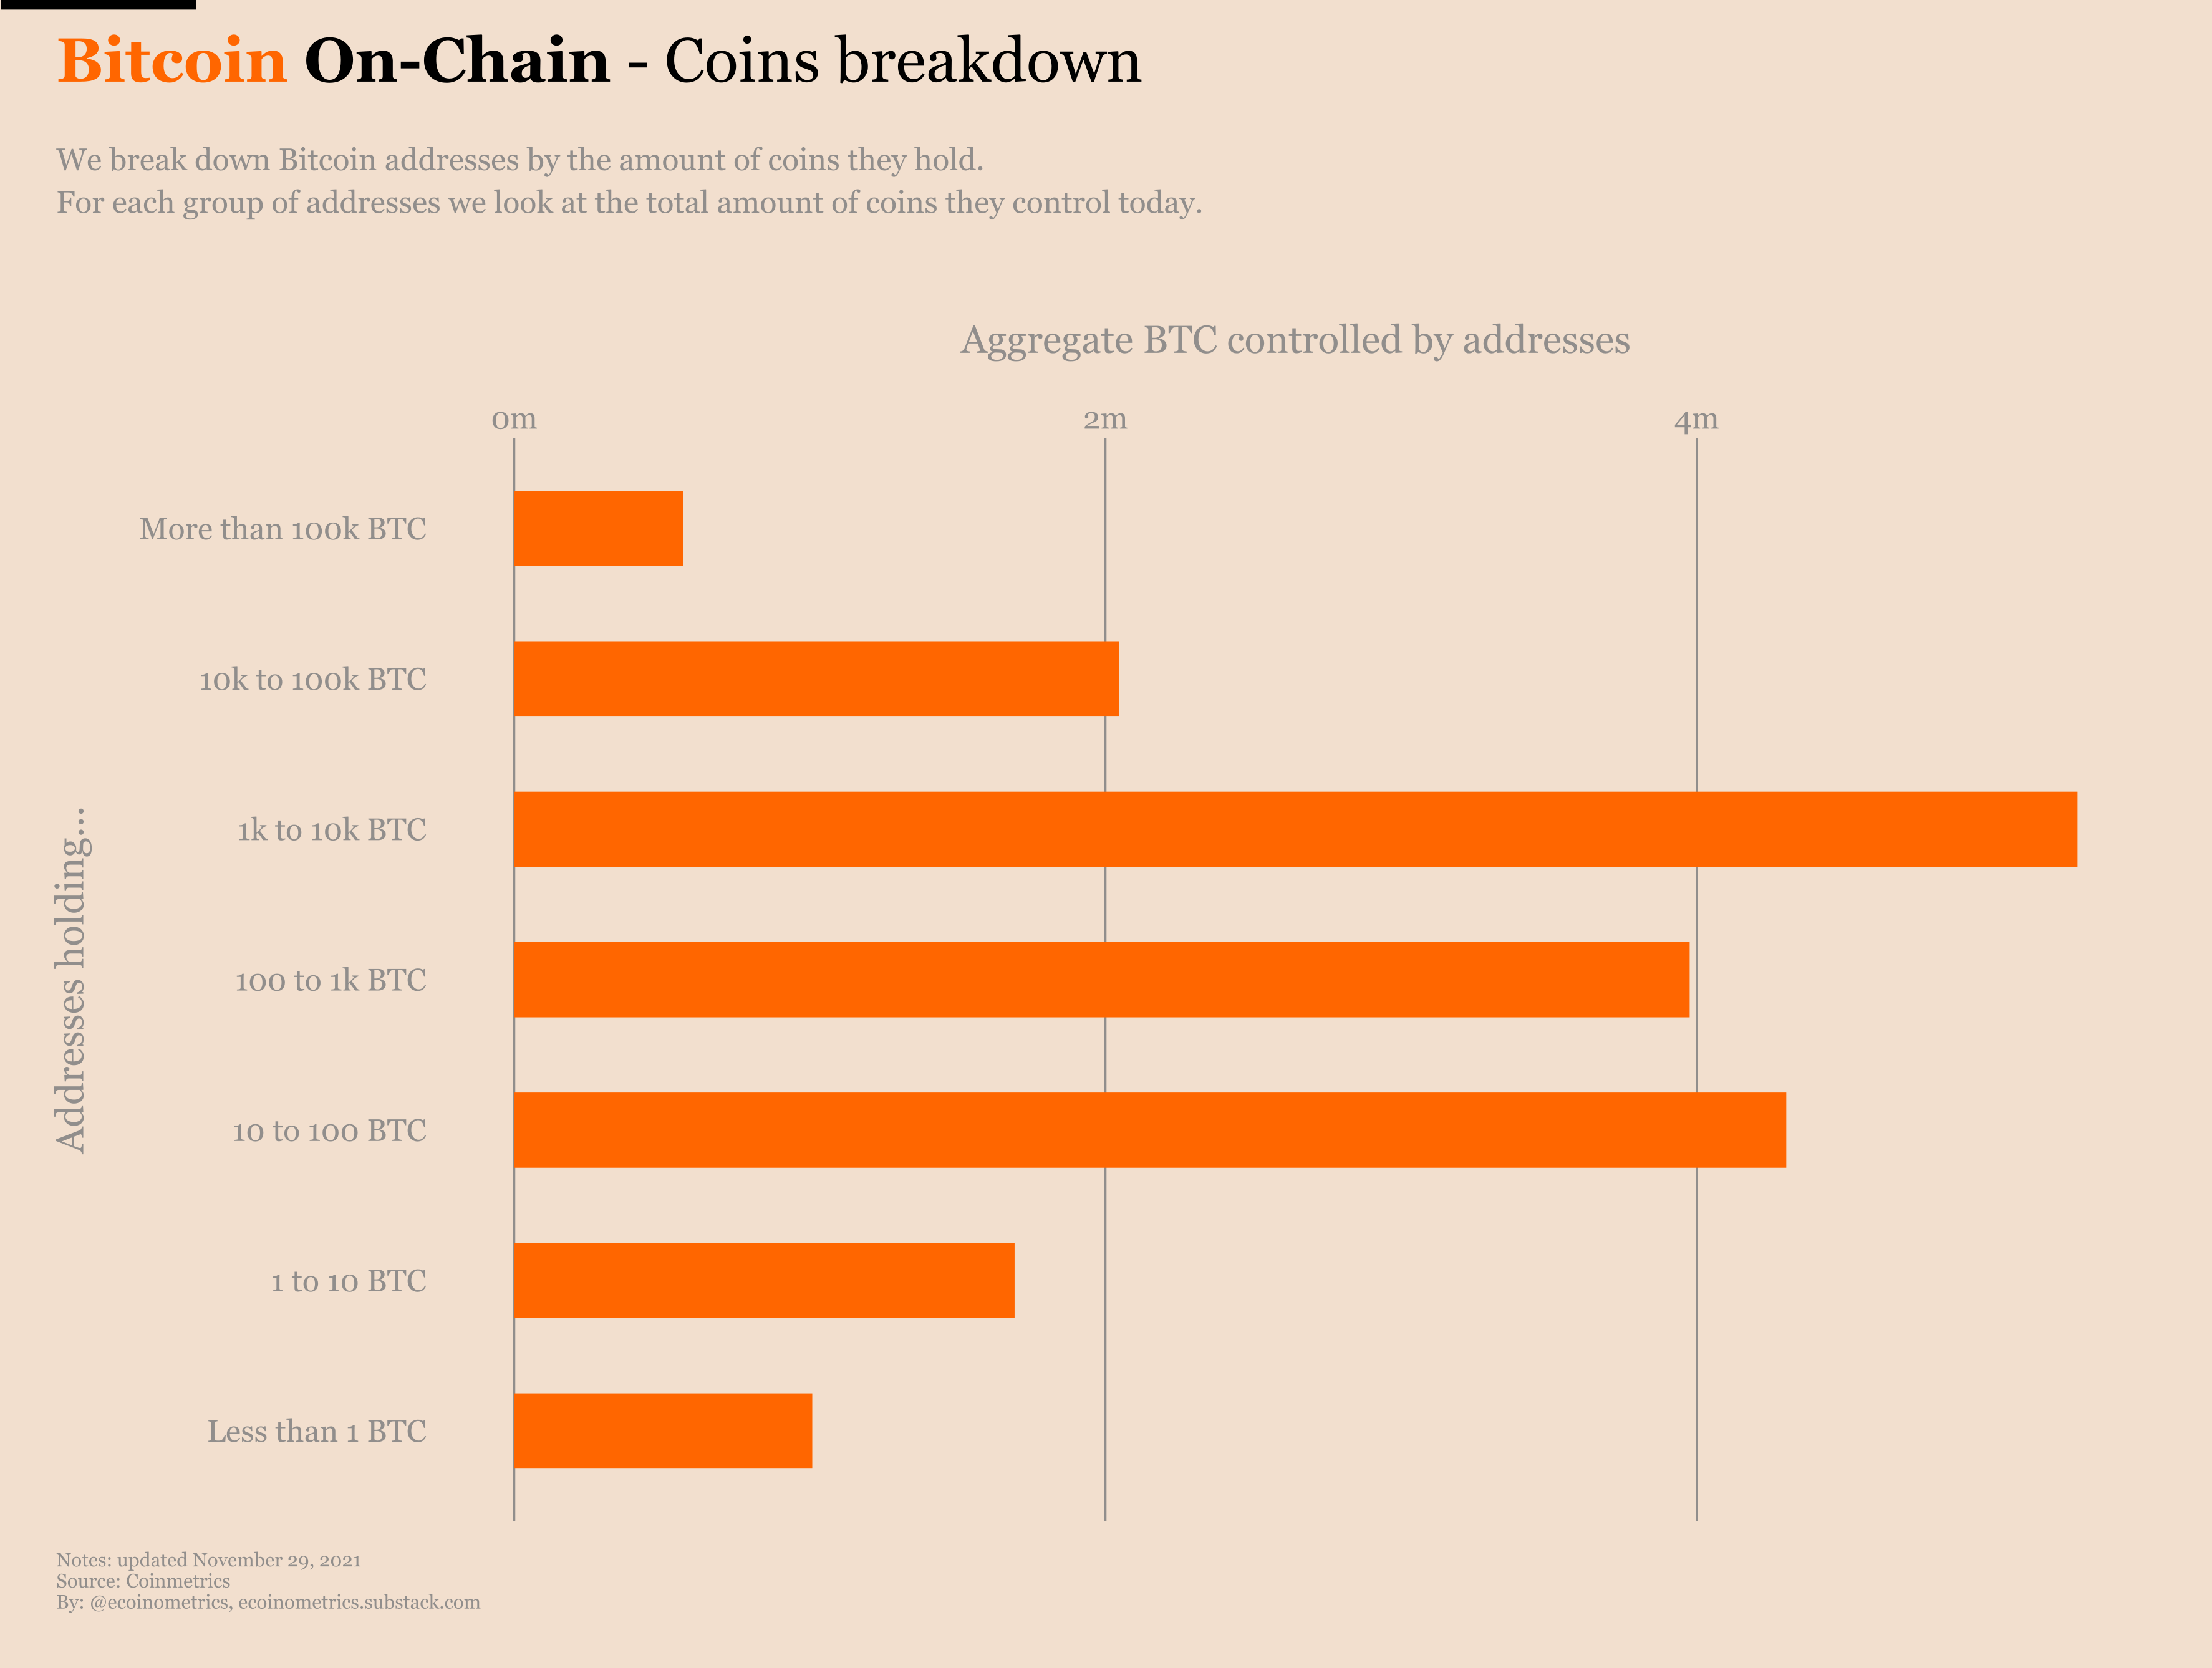
You see the commonality between those trajectories right? For the most part, since the bottom in May hodlers have been buying.
Now clearly this $65,000 region is a hard level to crack as it has triggered selling events on several occasions this year. But given that most of the risk metrics aren’t sitting at extremely high values there are no reasons Bitcoin can't break through eventually.
That doesn't mean I predict the price will skyrocket tomorrow. Nobody knows that. But are the conditions for the price to skyrocket already present in the market? The answer is yes.
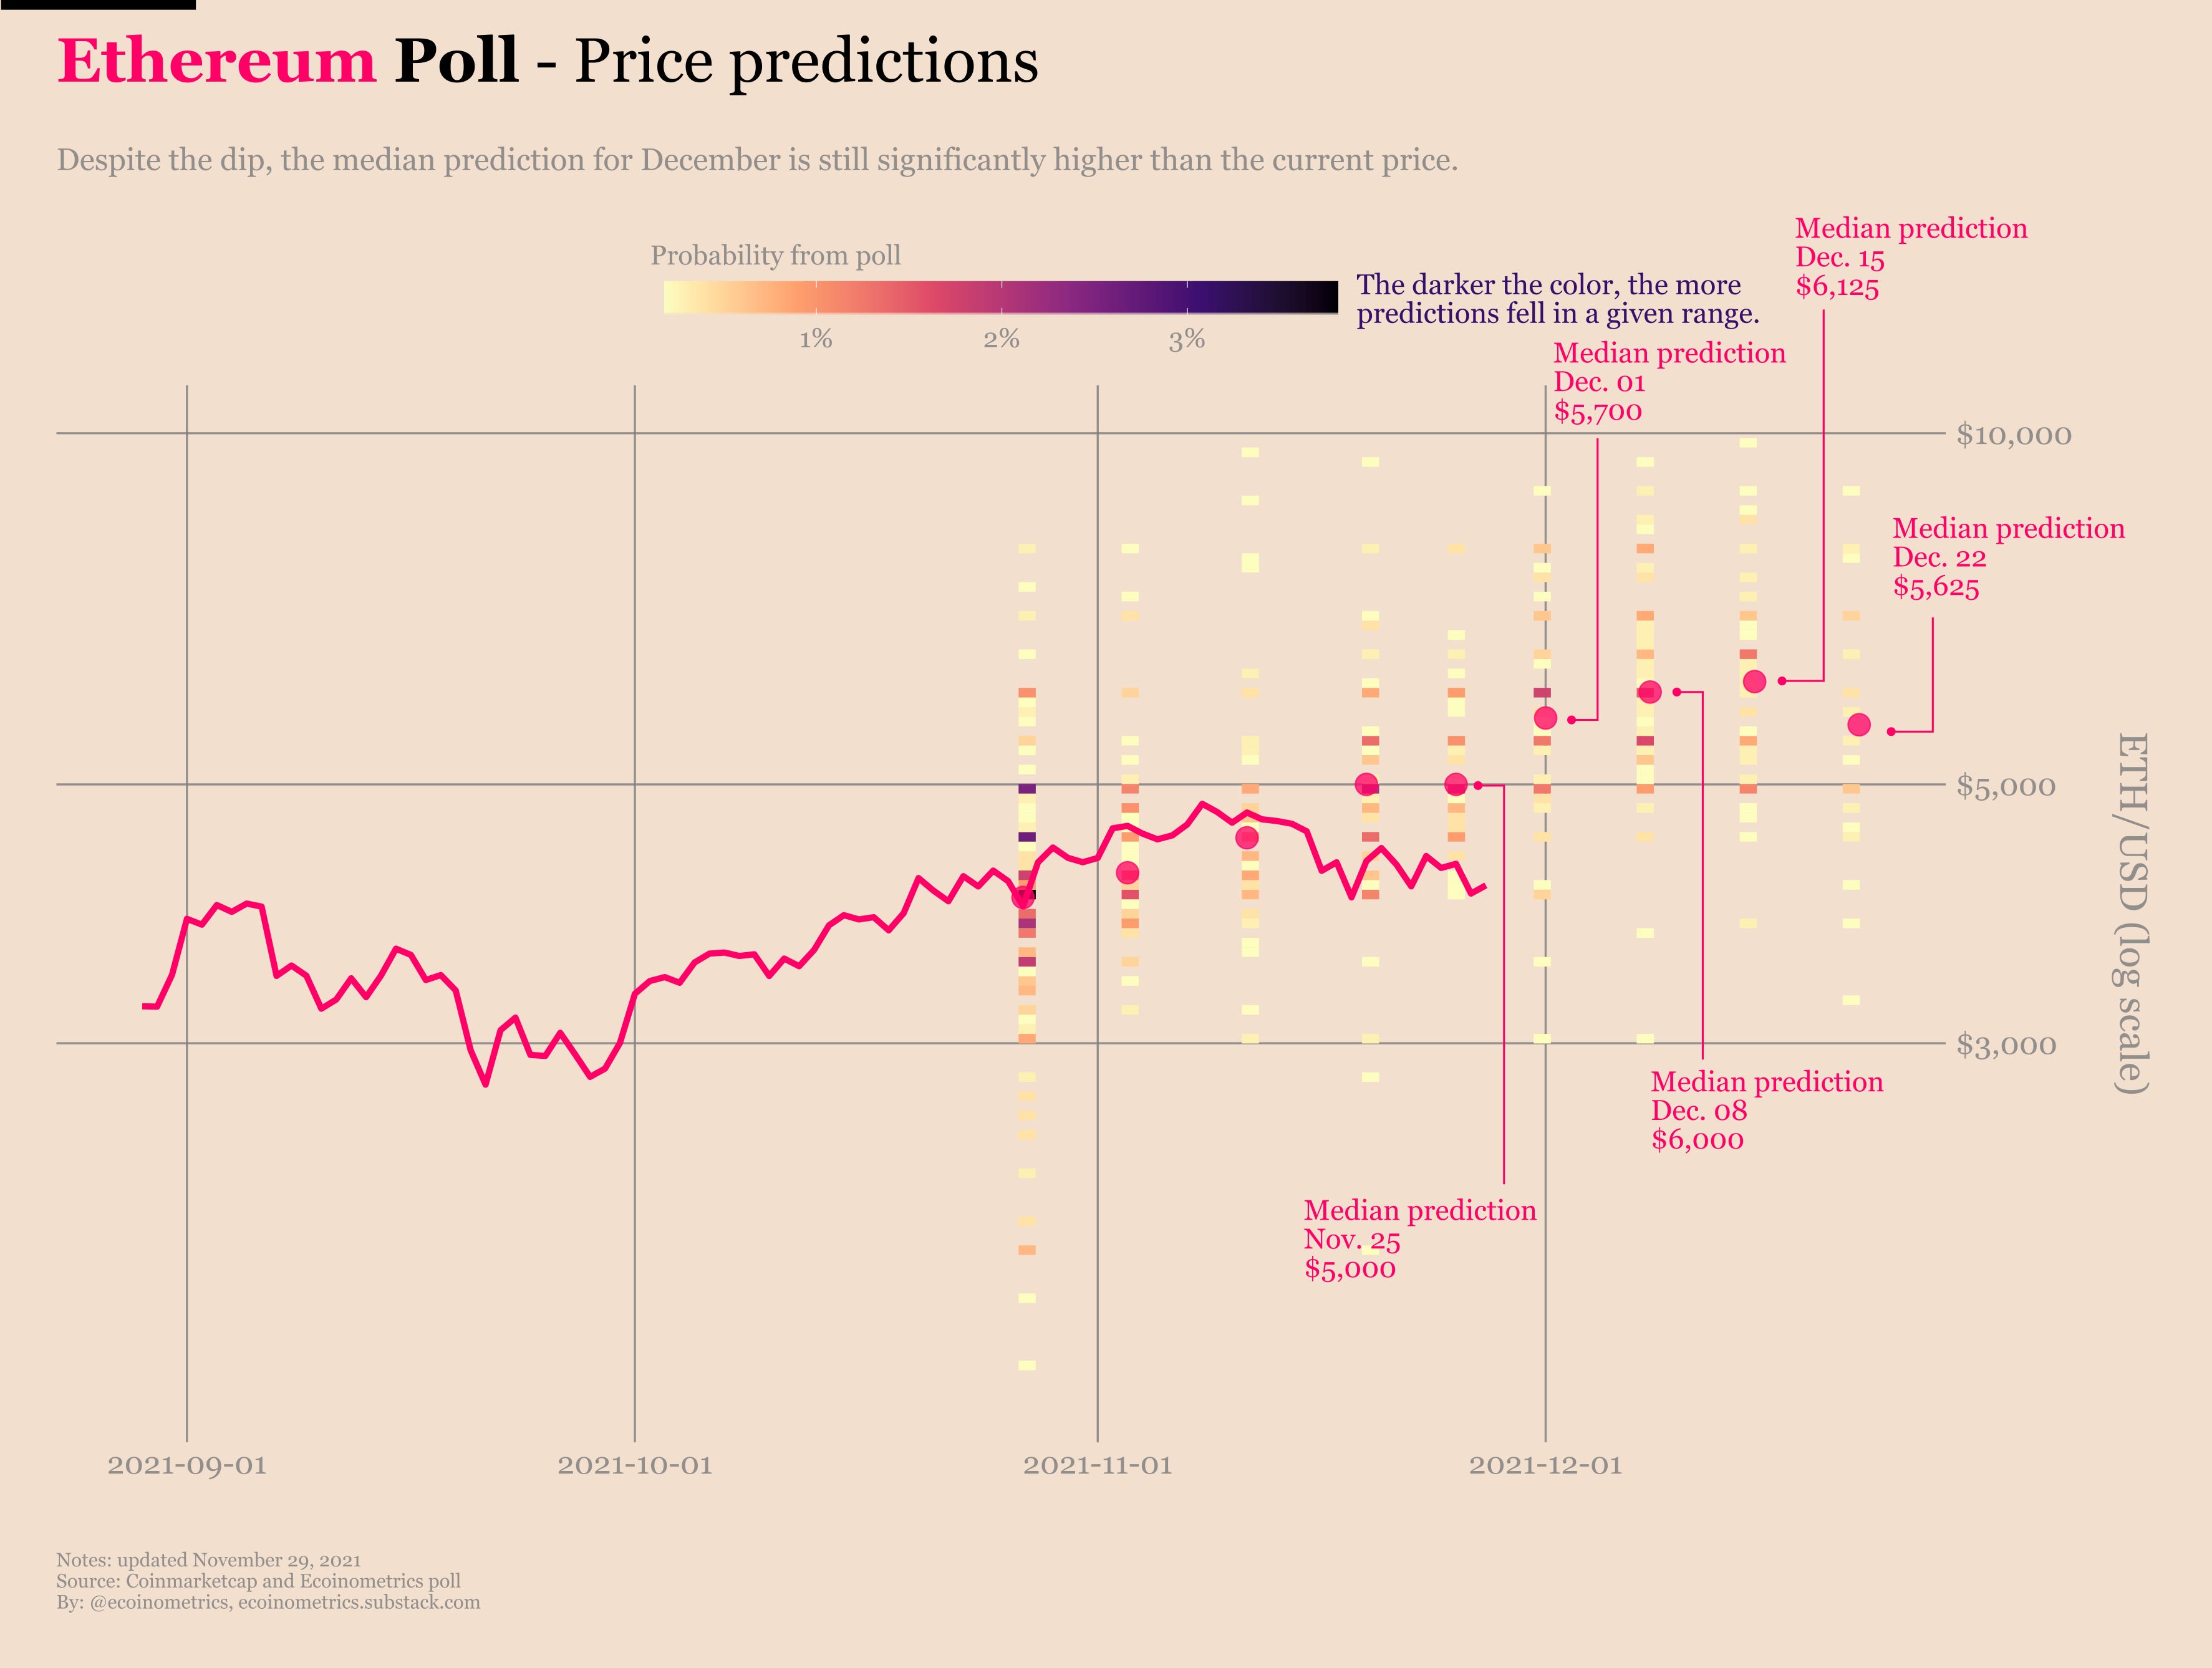
Apparently I’m not the only one to think that. Even with the dip over the past couple of weeks, respondents to the price prediction poll still put both Bitcoin and Ethereum at a much higher price level in the near future.
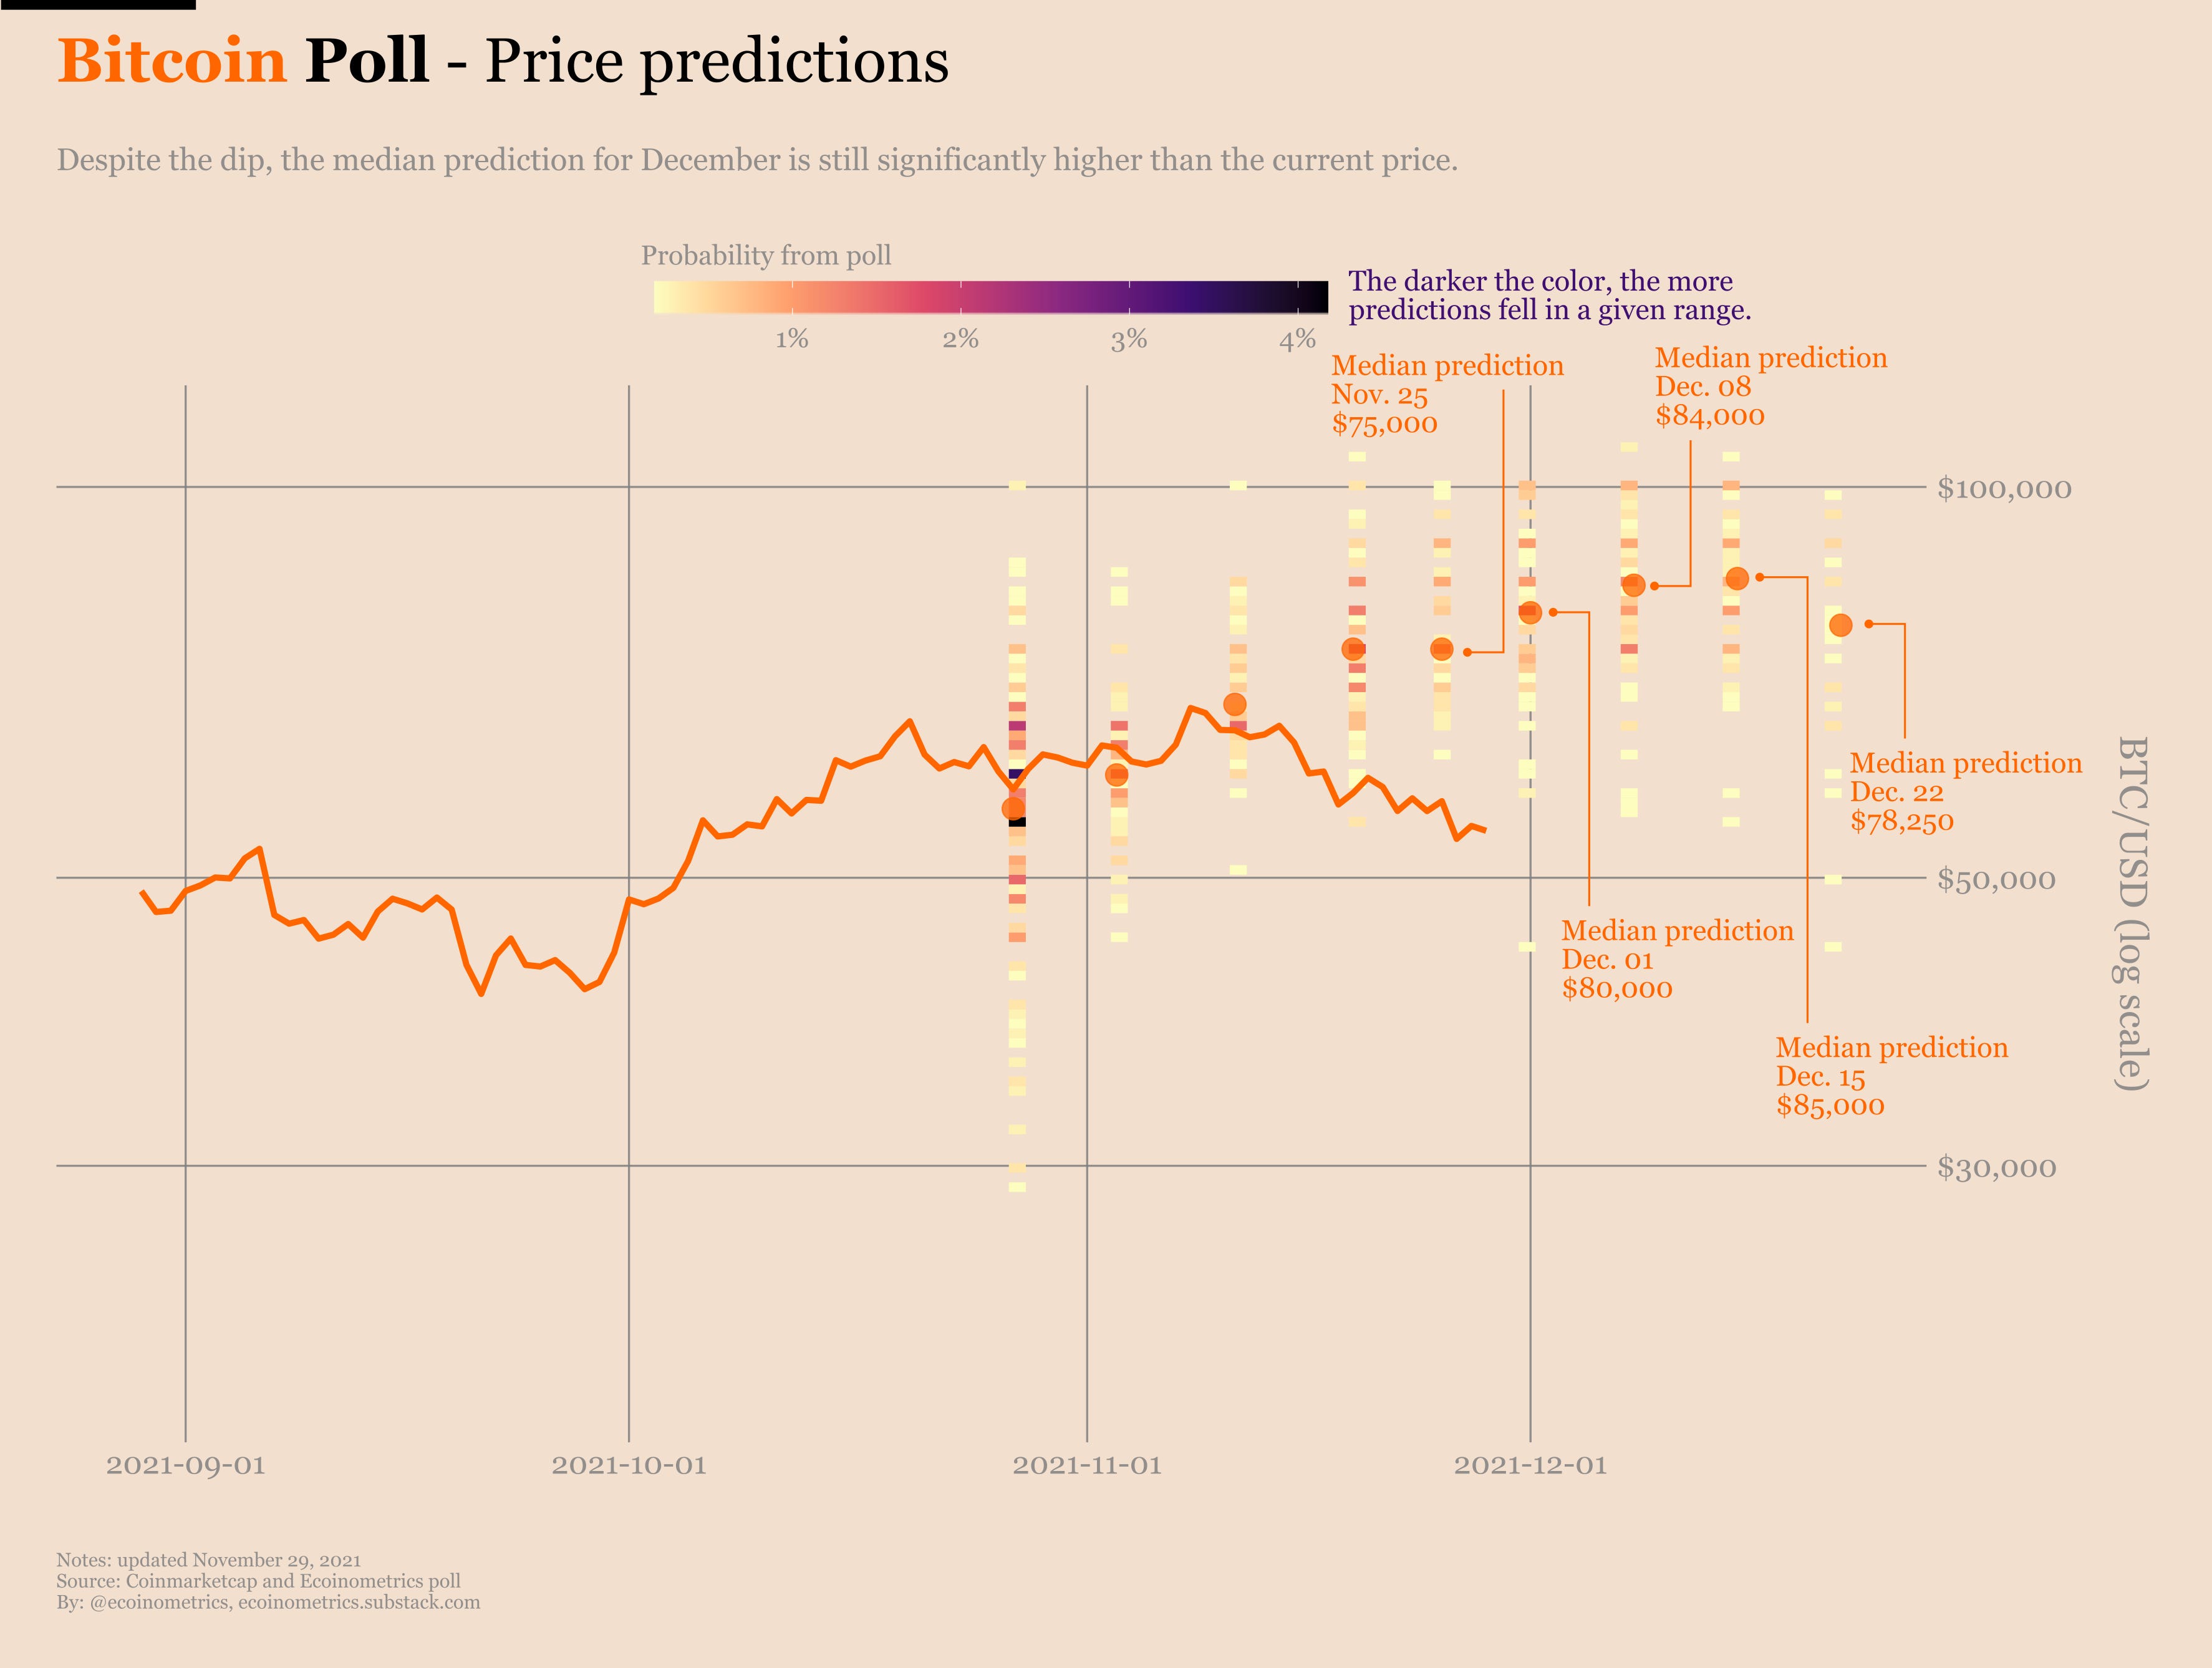
Last chance to give your predictions for Bitcoin at the end of the year over here:
Conclusion: I don’t see any reason to panic. When you are betting on macro moves peeing your pants on some meaningless dip only keeps you warm for so long. From a strategic perspective you are better off staying long Bitcoin.
That’s it for today. If you have learned something please subscribe and share to help the newsletter grow.
Cheers,
Nick
Fantastic piece
Great stuff as always, thank you Nick