A Look At Bitcoin In Twelve Months
Also the pattern Bitcoin needs to break and the US M2 money supply is growing but...
Welcome to the Friday edition of the Ecoinometrics newsletter.
Every week we bring you the three most important charts on the topics of macroeconomics, Bitcoin and digital assets.
Today we'll cover:
A look at Bitcoin in twelve months.
Can Bitcoin break this pattern?
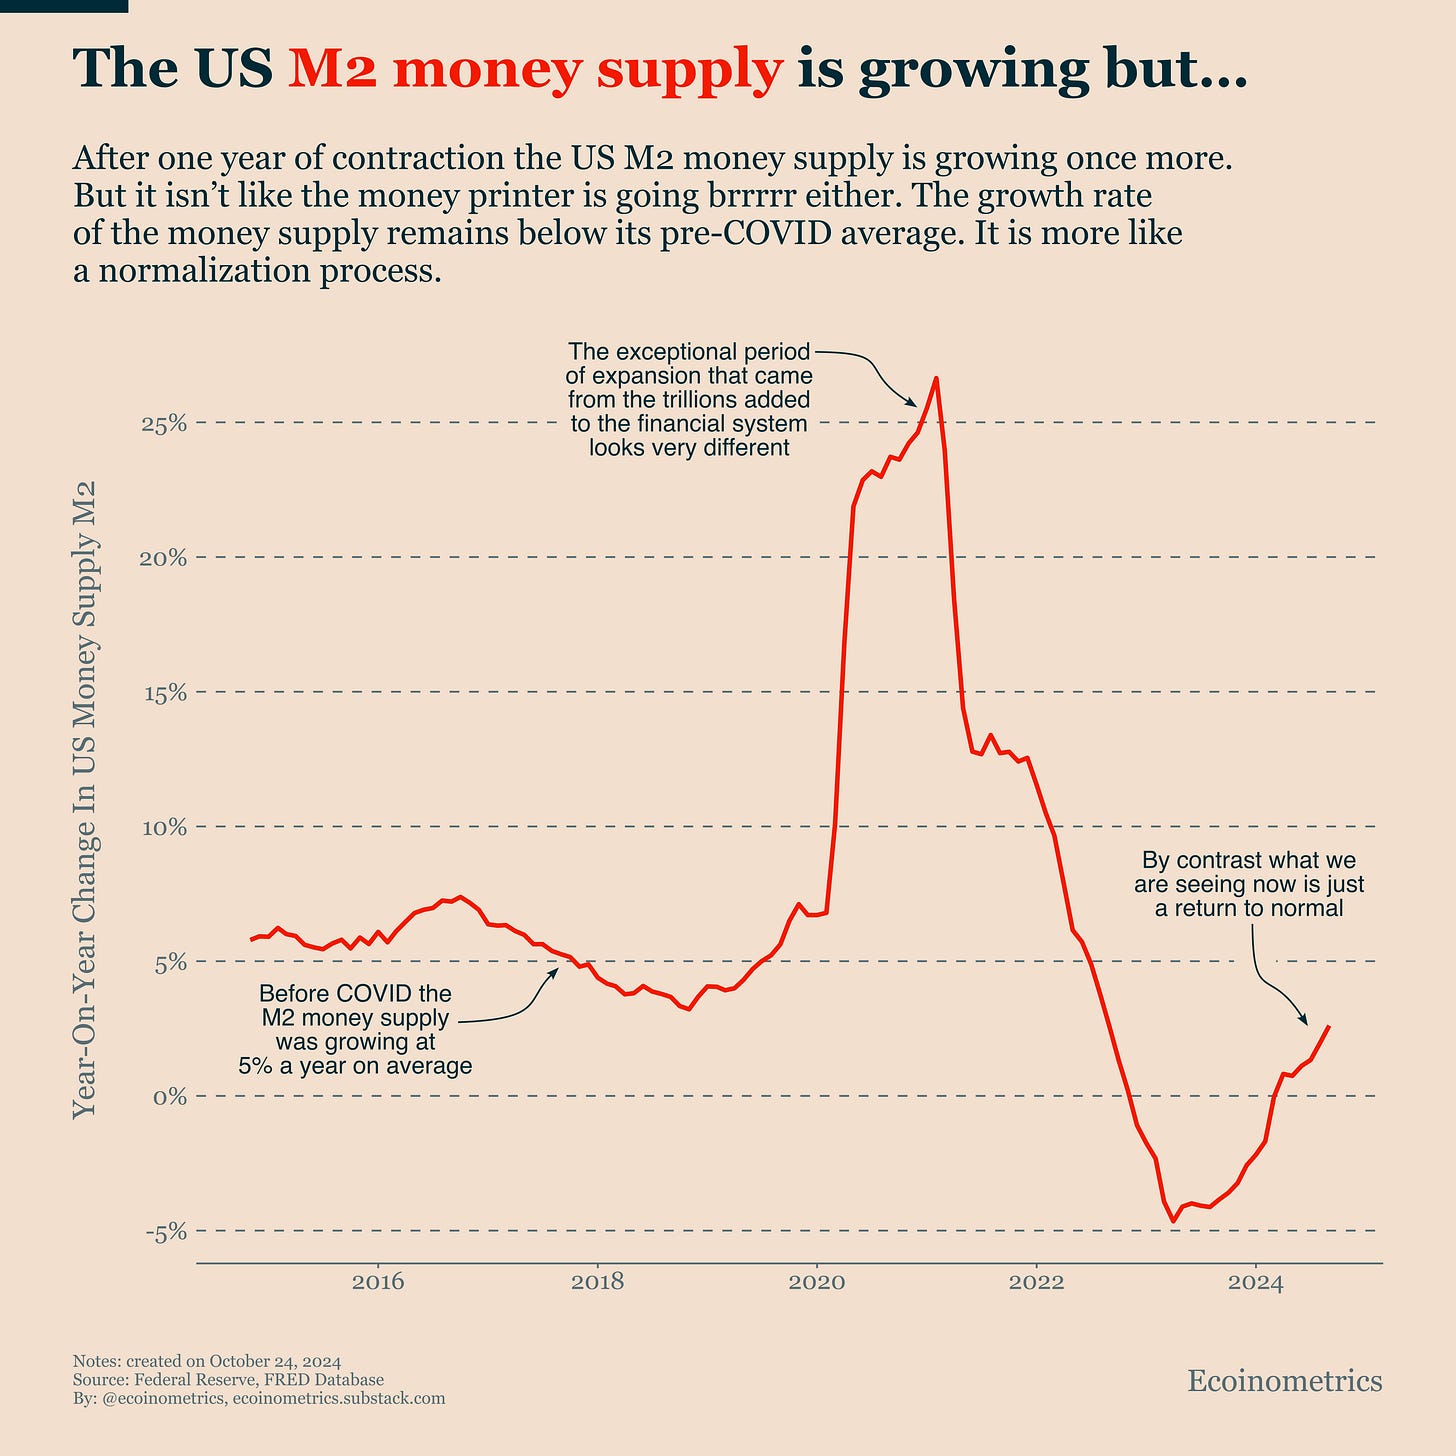
The US M2 money supply is growing but...
Each topic comes with a small explanation and one big chart. So let’s dive in.
In case you missed it, here are the other topics we covered this week:
If you aren’t subscribed yet, hit the subscribe button, to receive this email every week directly in your inbox:
A Look At Bitcoin In Twelve Months
As I write these lines, Bitcoin has maintained its price above $65,000.
In the short term, this is crucial because it means:
We have a confirmed breakout
The longer BTC stays up, the more likely it remains above its 200-day moving average
Positive momentum reinforces itself
Let's explore where this scenario could lead Bitcoin's price.
We use a simple market regime model for Bitcoin based on four factors:
On-chain activity
Volatility
Bitcoin's price momentum
Risk assets price momentum
The simplest bullish scenario assumes that momentum for both Bitcoin and risk assets stays at least as strong as it is now. This translates into specific conditions in our model.
When we extend this assumption over 12 months and run price simulations, we get a distribution of possible returns, shown in the chart below.
The blue area (5th percentile) shows the worst-case scenarios: a decline of 26% or more. The red area (95th percentile) shows the best-case scenarios: a rise of 465% or more.
The key projections:
Average 12-month return: 148%
Median 12-month return: 103%
In simple terms, if Bitcoin and the broader market maintain their current momentum, we're likely to see Bitcoin reach six figures by this time next year. To be more precise that puts Bitcoin at $130,000 towards the end of 2025.
Let's see how this plays out.
Can Bitcoin Break This Pattern?
Following up on our first chart, Bitcoin staying above $65k matters for another reason: it could break the pattern of lower highs and lower lows we've seen since March.
This pattern isn't obvious if you're only watching daily moves. Yes, Bitcoin hit an all-time high in March and has traded at decent levels since then. But zoom out, and the downward trend becomes clear.
The danger with these slow-motion declines is that prices can suddenly drop when too many investors notice the pattern.
A shift from this disguised downtrend to even stable sideways movement would be significant. The recent price action shows promise on two fronts.
First, since August, Bitcoin has aligned more closely with the NASDAQ 100. This synchronization means BTC should benefit from any broad market rally.
Second, on-chain data supports this recent move, so there is definitely hope.
The US M2 Money Supply is Growing But...
Bitcoin stands out as the best hedge against fiat currency debasement. When money creation accelerates, Bitcoin outperforms gold, stocks, commodities, and bonds.
So it's natural for Bitcoin investors to get excited about the US M2 money supply growing again. But let's keep this in perspective.
Before COVID, M2 grew at about 5% per year. We haven't even returned to that baseline yet. What we're seeing is a post-COVID normalization, not a new expansion phase.
This means we shouldn't expect anything like the 2020/2021 period, when M2 grew five times faster than its normal rate.
Here's the key point: Bitcoin can deliver solid returns without trillions in new money flooding the system. But we know it really shines during periods of rapid money creation.
With governments running constant deficits and using debt to mask financial problems, currency debasement remains a real threat.
Buying Bitcoin now as a hedge still makes strategic sense.
That’s it for today. I hope you enjoyed this. We’ll be back next week with more charts.
Cheers,
Nick
P.S. We spend the entire week, countless hours really, doing research, exploring data, surveying emerging trends, looking at charts and making infographics.
Our objective? Deliver to you the most important insights in macroeconomics, Bitcoin and digital assets.
Armed with those insights you can make better investment decisions.
Are you a serious investor? Do you want to get the big picture to get on the big trades? Then click on the button below.


Good post. Thanks.
I know from your prior posts that you're well aware of the general trend of monetizing of debt by most of the central banks around the world. Most have no choice but to do so. The only question is, at what pace can they do so.
I agree that we're back in a normal trend of money supply growth as opposed to covid times being radically more aggressive expansion because it was politically acceptable to do so.
Now it appears that they're almost all want to monetize at the "fastest possible rate that is both politically acceptable, combined with watching what the FX markets will do to them if they print too quickly.
Very useful for sure! Thanks.