
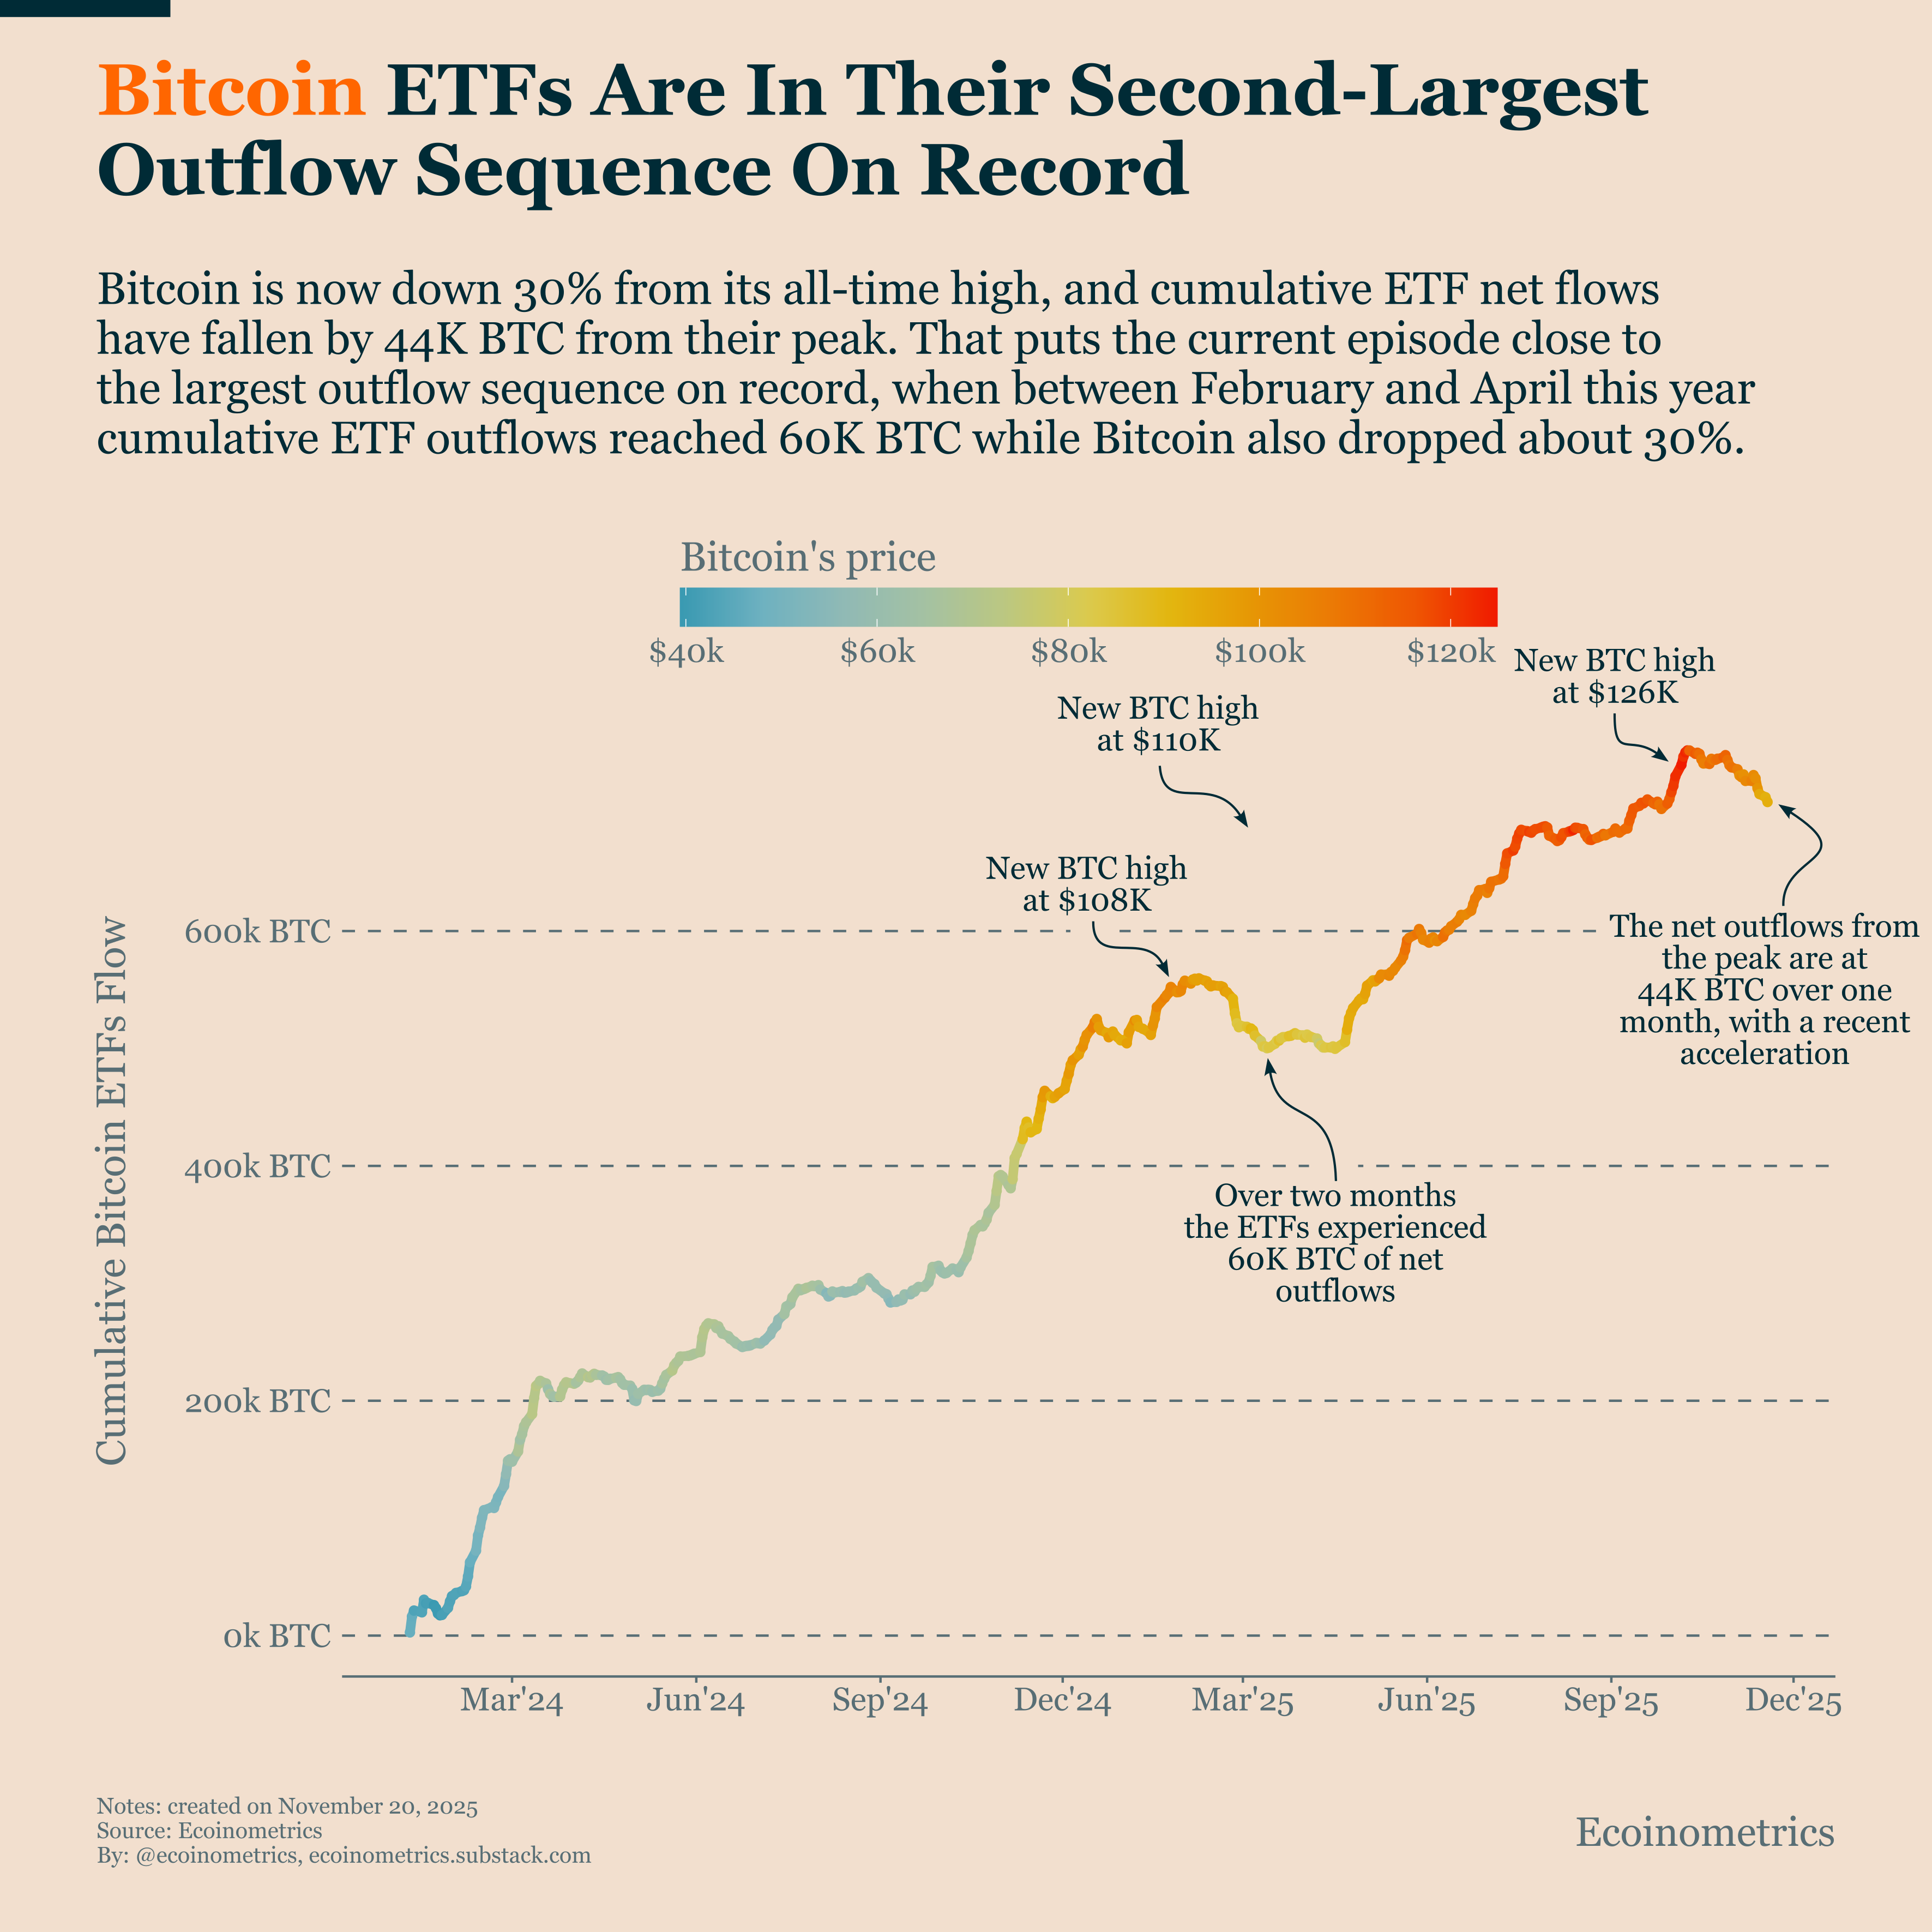
Bitcoin ETFs Are In Their Second-Largest Outflow Sequence On Record
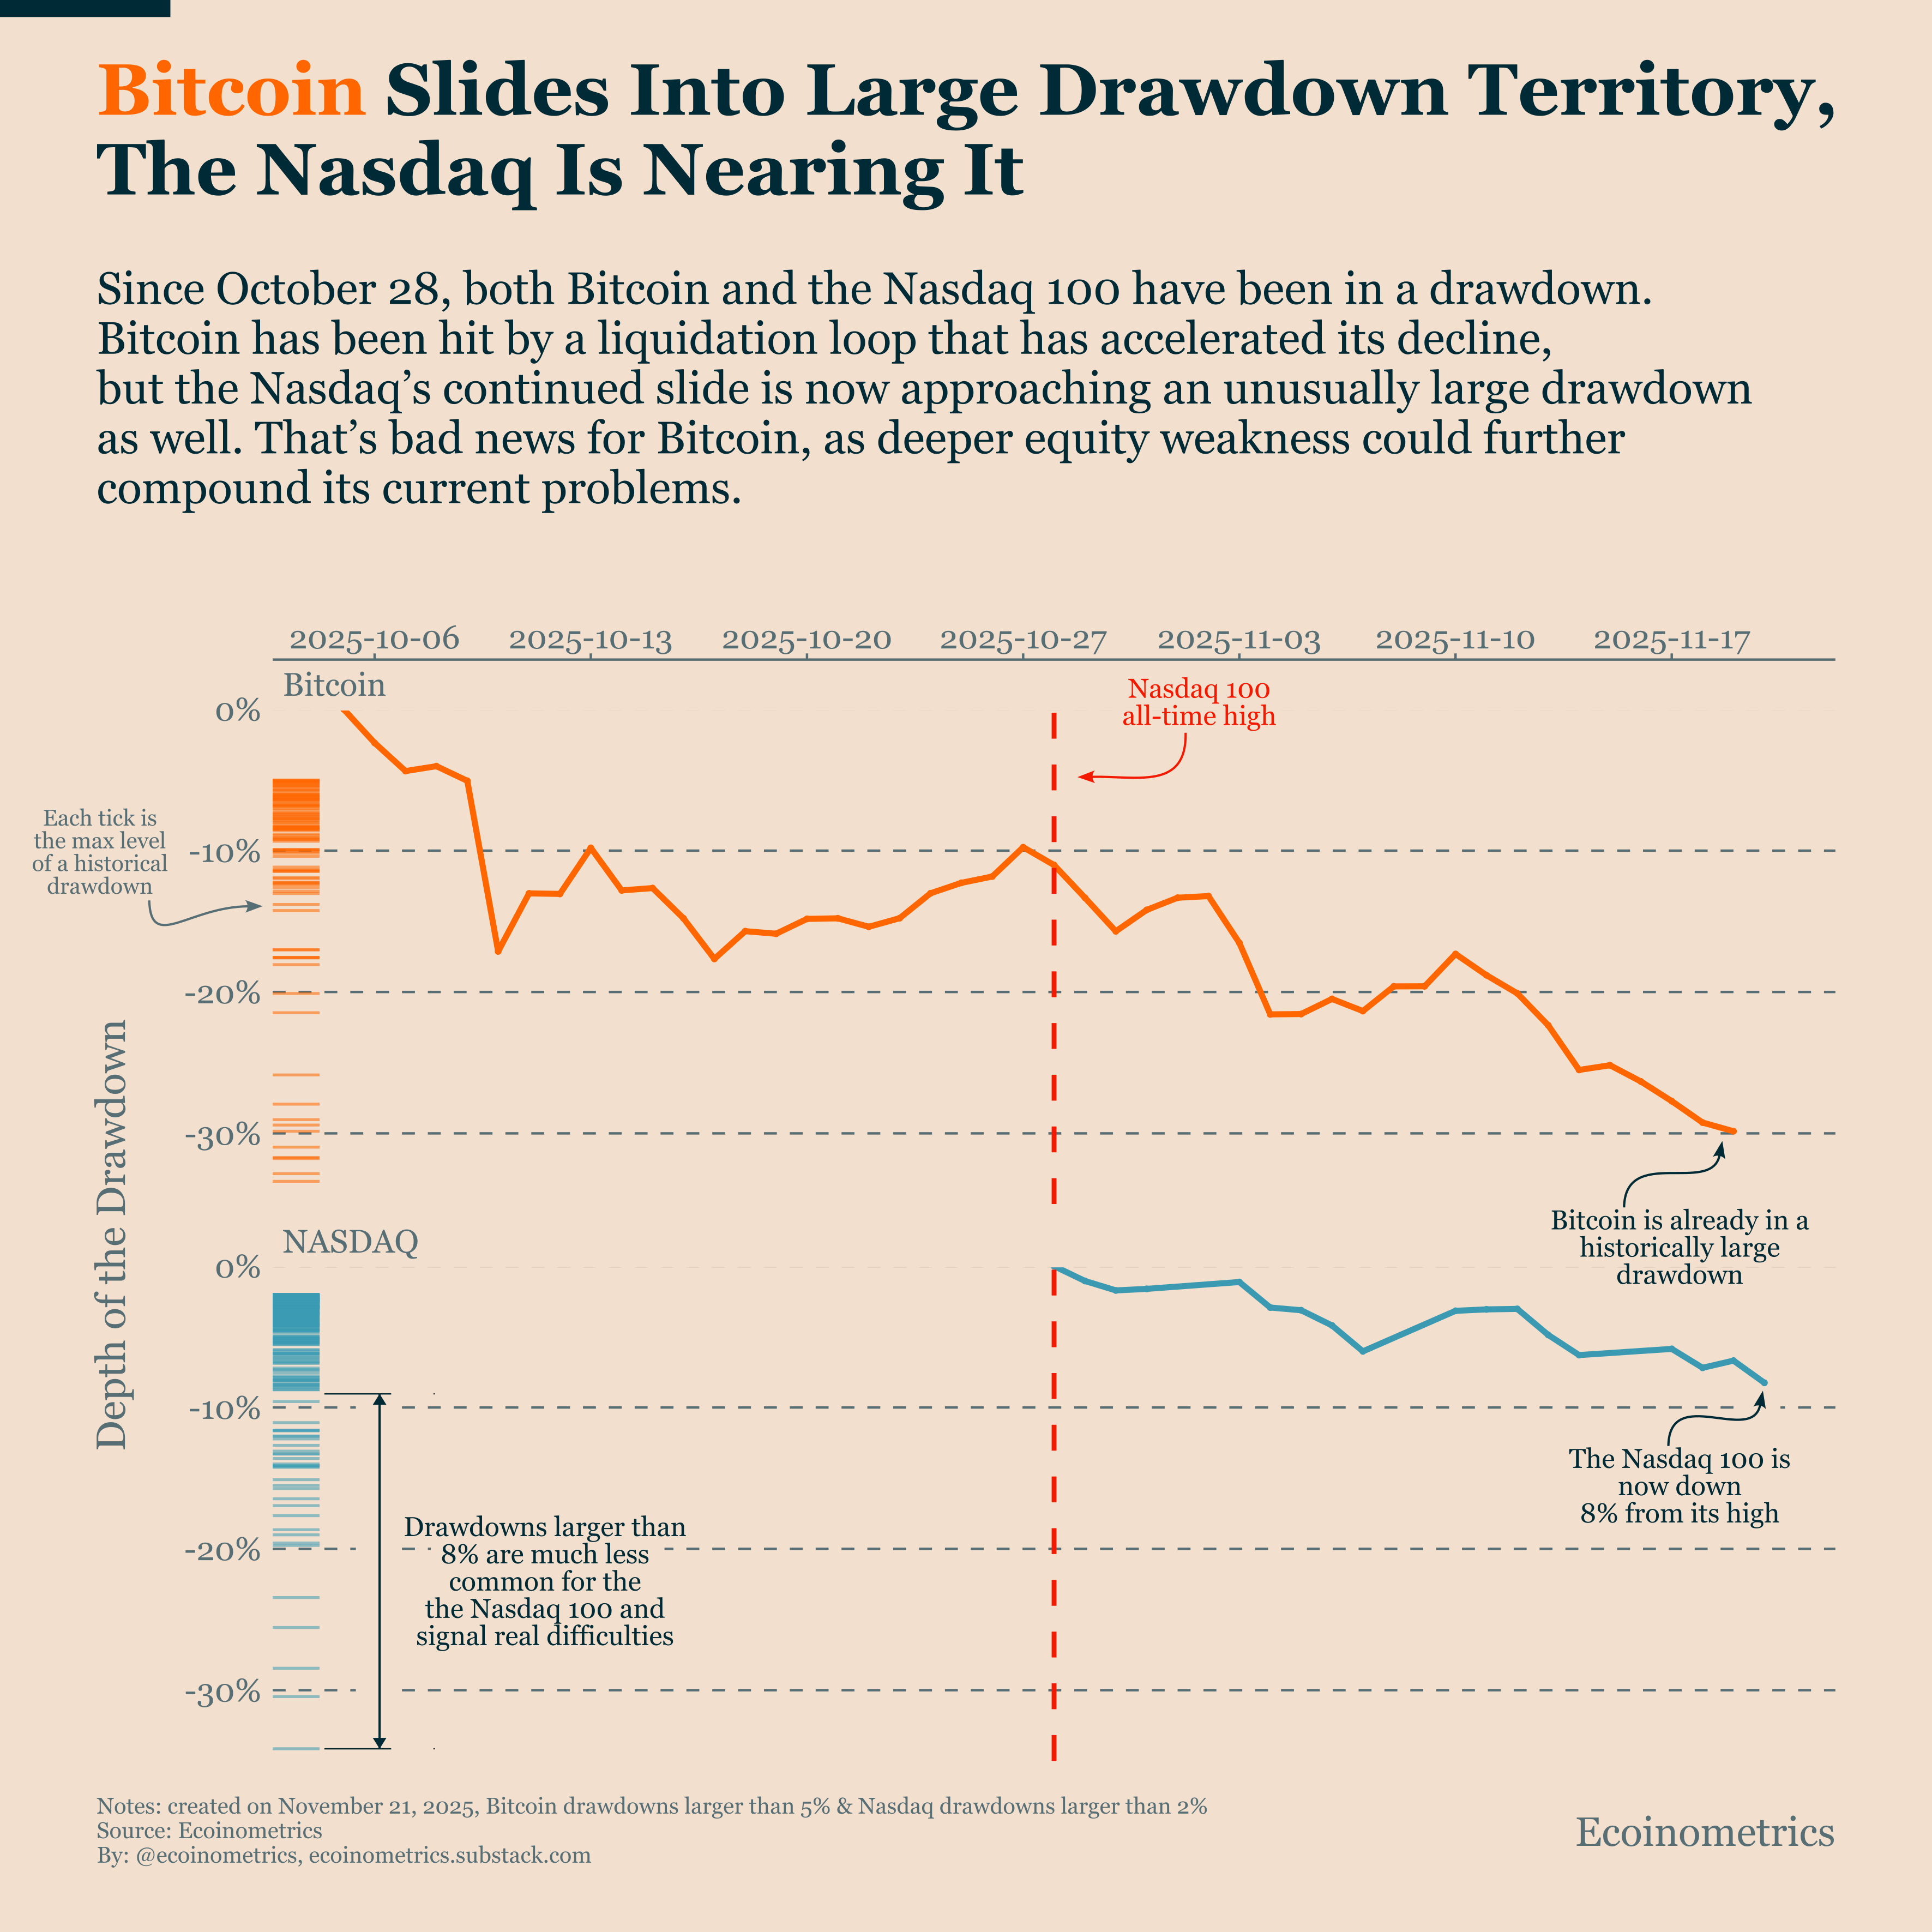
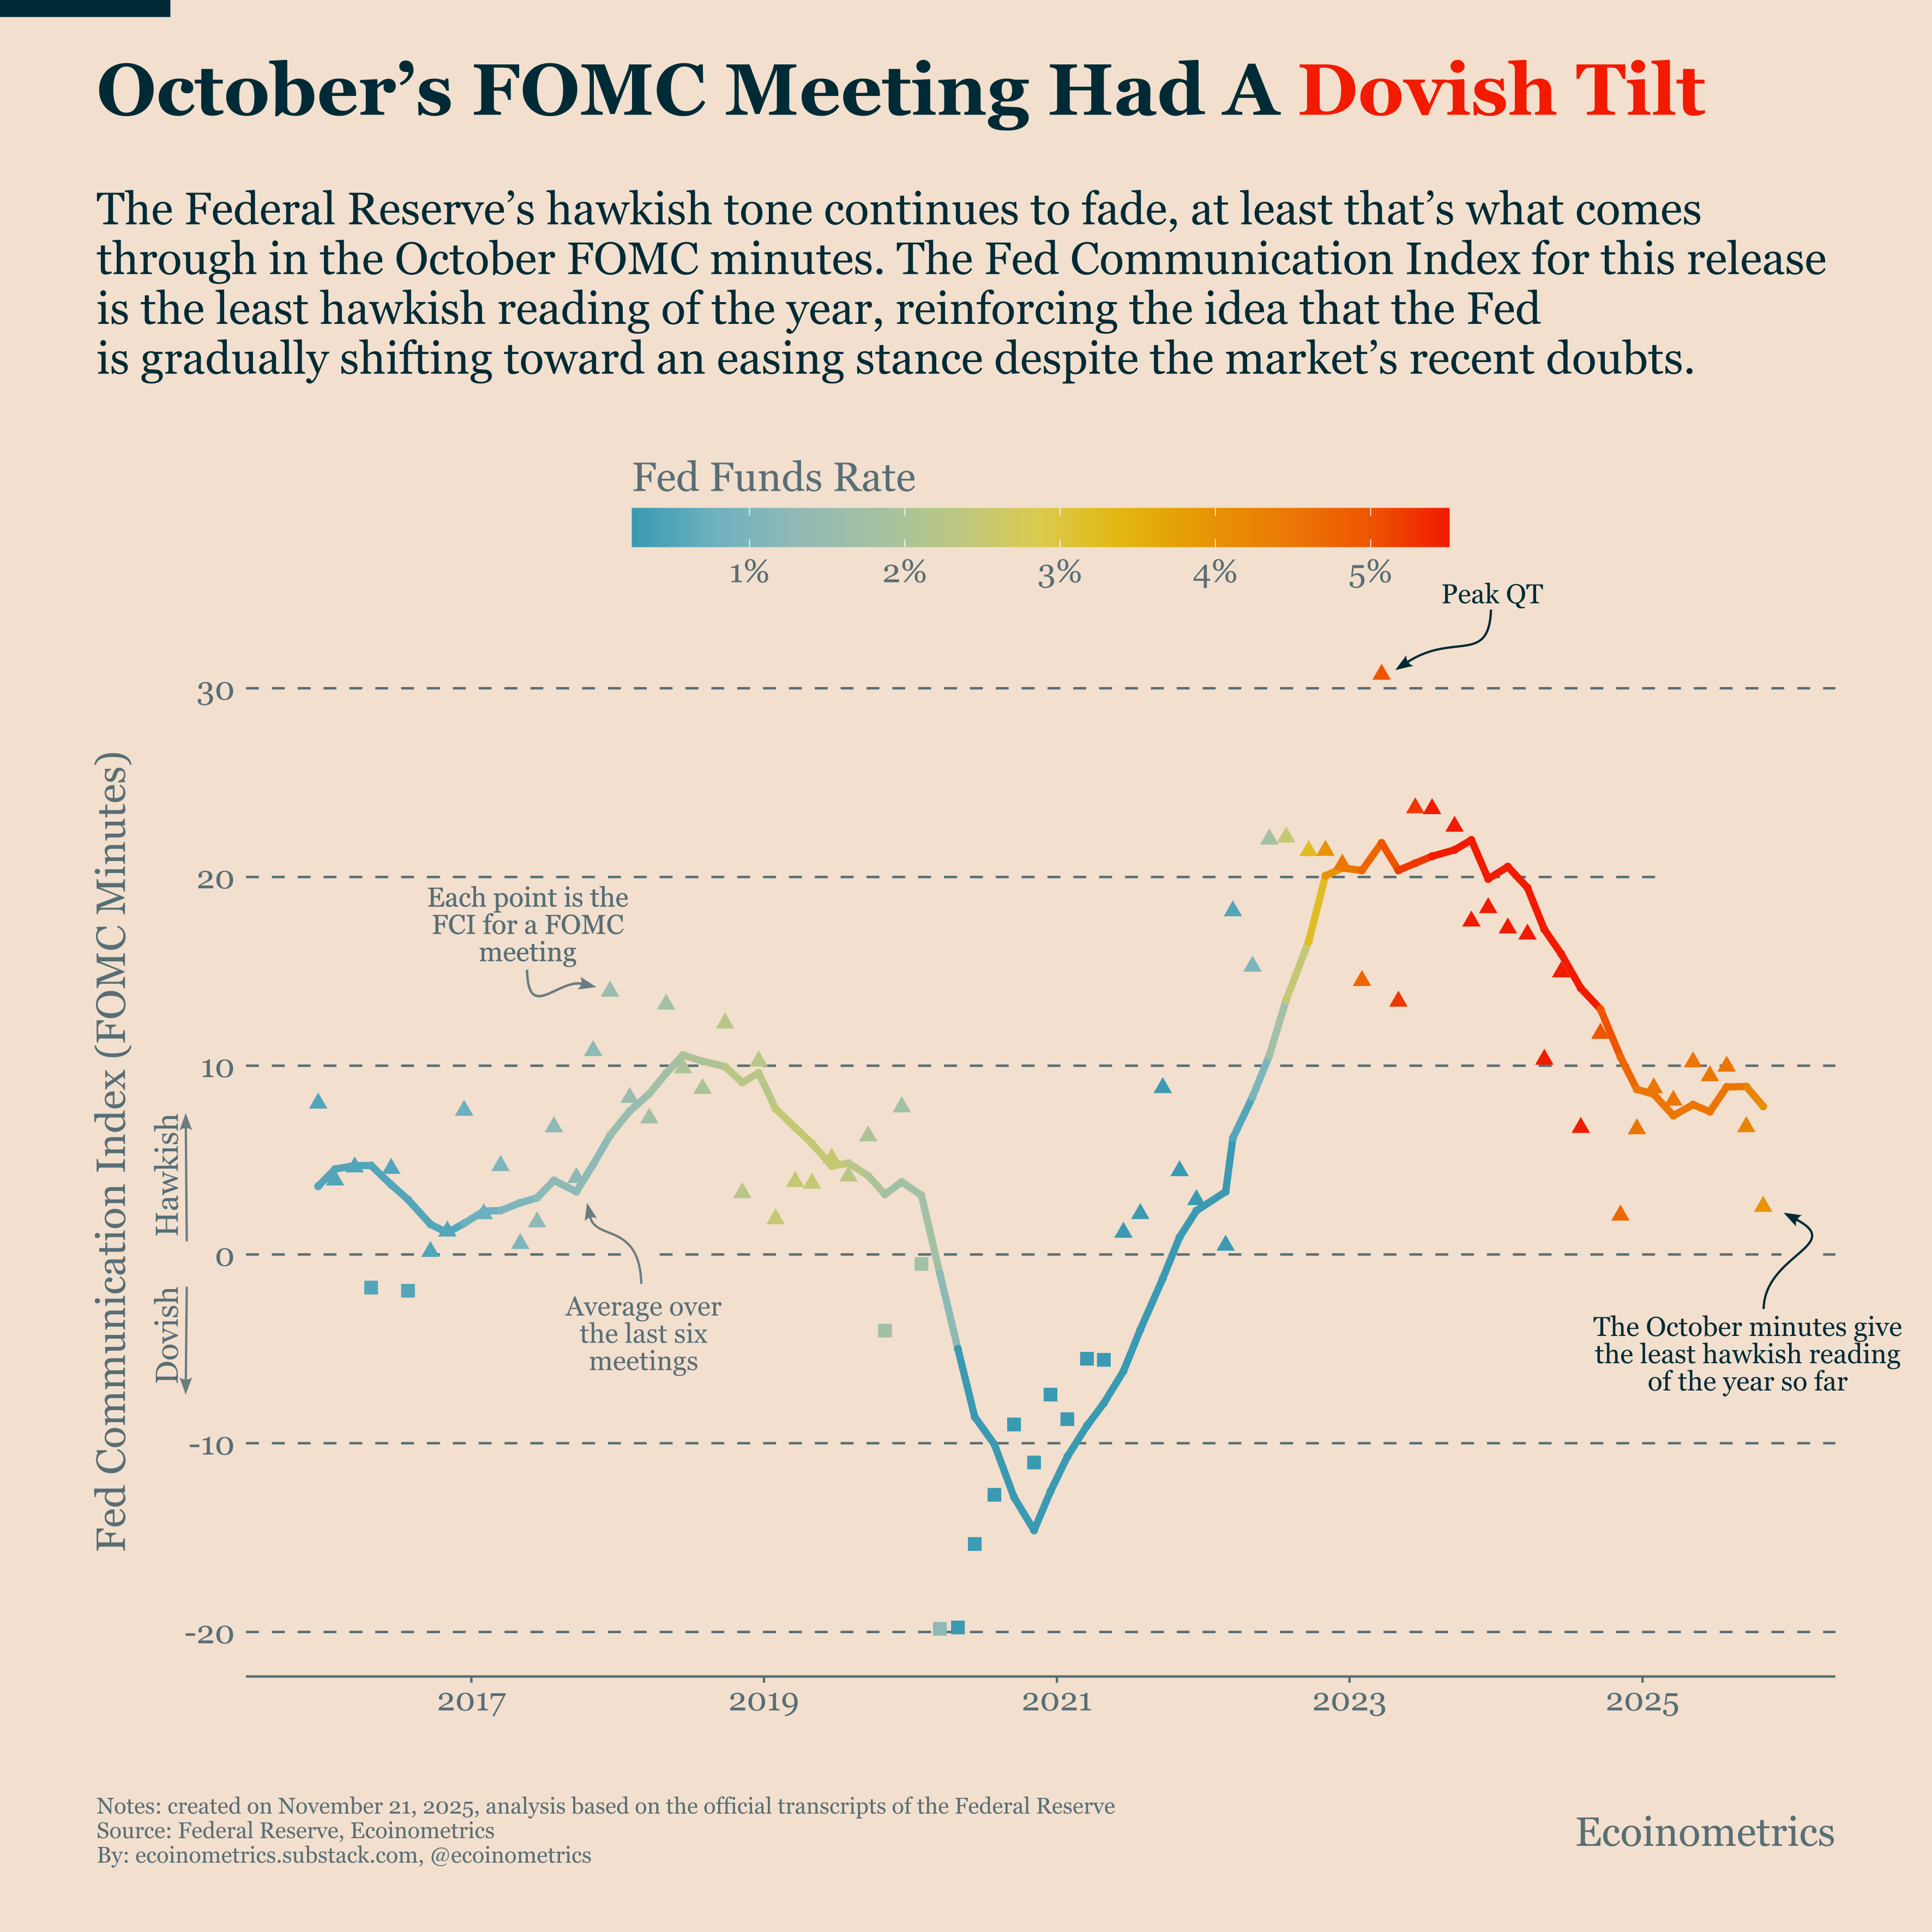
Also Nasdaq Weakness Is Nearing a Level That Signals Macro Stress & Fed Communication Turns the Least Hawkish of the Year

Welcome to Ecoinometrics’ Friday edition.
Each week, we analyze the three most critical market signals impacting Bitcoin and macro assets, delivering institutional-grade insights through data-driven charts and analysis.
Today we’ll cover:
Bitcoin ETFs Are In Their Second-Largest Outflow Sequence On Record
Nasdaq Weakness Is Nearing a Level That Signals Macro Stress
Fed Communication Turns the Least Hawkish of the Year
Despite covering different angles, all three charts point to the same issue: pressure is building across every layer of the market.
Bitcoin is dealing with a direct flow-driven liquidation loop, equities are inching toward levels that signal real macro stress, and the Fed’s tone (while softening) is still far from providing near-term relief.
Together, these forces help explain why Bitcoin remains vulnerable and what to watch as we head into December.
In case you missed it, here are the other topics we covered this week:


Bitcoin Market Monitor - Key Drivers in Ten Charts:

Get these professional-grade insights delivered to your inbox:
Bitcoin ETF Outflows Enter Their Second-Largest Stretch on Record
The outflow situation continues to worsen for the Bitcoin ETFs.
Since the peak in October, cumulative ETF net flows are down 44,000 BTC. That’s a meaningful amount of forced selling, and it’s weighing heavily on the price. As a reminder, every 10,000 BTC of outflows over a 30-day period tends to pull down Bitcoin’s performance by about 3.5%, so the drag we’re seeing is consistent with that relationship.
This is now the second-largest wave of ETF redemptions since launch. The only bigger one happened between late February and April this year, when uncertainty around U.S. monetary policy and new tariffs triggered roughly 60,000 BTC of outflows. That episode pushed Bitcoin into a drawdown that bottomed around 30% below the all-time high.
Right now Bitcoin is drifting even lower than that level.
On Wednesday we broke down the drivers behind this outflow sequence, and the conclusion was that Bitcoin-specific factors are doing most of the damage. This doesn’t look like a broad risk-off rotation. Instead, Bitcoin is stuck in a liquidation loop: outflows push the price lower, and lower prices create more outflows.
The only way to see if this loop is slowing is by watching the trajectory of the flows. So far, there’s no sign of stabilization.
The combined flow-and-price path is also tracking the bearish scenario from last week’s Bitcoin Market Monitor update. That path implied Bitcoin eventually stabilizing somewhere in the $69K–$81K range.
Nasdaq Weakness Is Nearing a Level That Signals Macro Stress
One thing that won’t help Bitcoin right now is if the Nasdaq 100 continues sliding toward a deeper drawdown.
As we discussed in Wednesday’s correlations report, the macro backdrop had mostly remained risk-on, and Bitcoin’s decline was driven more by its own liquidation loop rather than broader equity weakness. But that picture is shifting. The Nasdaq 100, arguably the strongest proxy for risk-on sentiment, is now approaching levels where the pullback becomes a genuine macro headwind.
Up to this point the drawdown in the Nasdaq has been mild and well within the range of typical historical fluctuations. But once it crosses an 8% decline, we move into territory that’s far less common and usually signals real stress in the equity market. At that point, the factor represented by the Nasdaq flips from neutral to negative, and it reinforces Bitcoin’s problems by removing one of the few remaining sources of macro support.
For investors, the timing matters. Bitcoin-specific selling can stabilize quickly on its own, but once Nasdaq momentum breaks, cross-asset correlations tend to tighten. That spillover effect often extends the duration of drawdowns and makes recoveries slower.
If the Nasdaq keeps dipping, Bitcoin likely faces even more downside pressure in the short term. This is the next key variable to watch.
Fed Communication Turns the Least Hawkish of the Year
Now, the big question is whether we can still avoid the worst-case scenario: a true macro bear market. Corrections happen, sometimes they are deep, but what determines how quickly Bitcoin can recover is the macro environment. And nothing shapes that environment more than U.S. monetary policy.
Right now the market is worried that the Federal Reserve may back away from the rate cuts they hinted at late this summer. But when we dig into the October FOMC minutes (released this week) a different picture emerges. On our Fed Communication Index, which scores Fed texts along a dovish–hawkish scale based on a quantitative text analysis, the October minutes come in far less hawkish than the prior meeting.
In fact, it’s the least hawkish reading of 2025, essentially back to a neutral stance.
That suggests that internally, as of the last meeting, the Fed still viewed ending QT and moving toward a more normal rate policy as the right path. This doesn’t guarantee they’ll follow through, but it implies that the most vocal “no more cuts” governors may not reflect the centre of gravity inside the institution.
If the Fed eventually reassures the market that normalization is still the plan, and pairs that with the end of balance sheet reduction, that would be supportive for risk assets, including Bitcoin.
But the December FOMC meeting is still about 20 days away. And not everyone is convinced the Fed can keep easing while inflation remains sticky (see Monday’s bond market section). Until the Fed provides clarity, this uncertainty will keep adding pressure to Bitcoin’s price.
That’s it for today. Thanks for reading.
Cheers,
Nick
P.S. Every week, our team conducts extensive research analyzing market data, tracking emerging trends, and creating professional-grade charts and analysis.
Our mission: Deliver actionable macro and Bitcoin insights that help institutional investors and financial advisors make better-informed decisions.
Ready for institutional-grade research that puts you ahead of the market? Click below to access our premium insights.
The liquidation loop you described really captures what's hapenning here. When outflows drive price lower and lower prices trigger more outflows, it becomes self-reinforcng until something breaks the cycle. The 44K BTC outflow since October is masive, and if the Nasdaq continues to weaken, we could see this extend further into your $69K-$81K range.