


Bitcoin Getting Challenged On Risk Adjusted Returns
Also Weak Inflows In August and Inflation At 2%

Welcome to the Friday edition of the Ecoinometrics newsletter.
Every week we bring you the three most important charts on the topics of macroeconomics, Bitcoin and digital assets.
Today we'll cover:
Bitcoin Getting Challenged On Risk Adjusted Returns
Weak Inflows For The Bitcoin ETFs in August
Inflation At 2%
Each topic comes with a small explanation and one big chart. So let’s dive in.
In case you missed it, here are the other topics we covered this week:


If you aren’t subscribed yet, hit the subscribe button, to receive this email every week directly in your inbox:
Bitcoin’s Risk Adjusted Returns Are Being Challenged
Risk adjusted returns measure how much return an investment provides compared to the amount of risk it takes on. This helps investors compare assets with different risk levels.
When you measure the risk-adjusted returns of large cap assets over four years or more, Bitcoin consistently delivers high results. Despite its volatility, large corrections, and uneven growth, Bitcoin remains a worthwhile investment.
But over shorter time periods Bitcoin doesn't always come out on top. Looking at the last 12 months:
Nvidia is delivering the best risk-adjusted returns.
Bitcoin is in second place, closely followed by Meta.
Gold is quickly becoming a strong challenger.
In terms of pure returns, Bitcoin is still performing well. But watching its risk-adjusted performance is crucial. There are two main reasons institutional investors buy Bitcoin:
It has proven to be a good hedge against fiat currency debasement.
It improves portfolio performance thanks to its risk-adjusted returns.
If Bitcoin remains a good debasement hedge but its risk-adjusted returns weaken, it becomes a less obvious choice for portfolios. This could impact institutional demand.
It's worth keeping an eye on these trends.

Weak Inflows For The Bitcoin ETFs In August
Generally, larger inflows for Bitcoin ETFs correspond to higher returns that month. So it's no surprise to see net flows of only about 1,500 Bitcoins in August while BTC is down almost 10%.
There's a silver lining, though. Despite Bitcoin's downturn this month, the ETFs haven't seen significant outflows.
It seems Bitcoin and crypto aren't top priorities for investors right now. People are focusing on AI and the broader US economy, not monetary and fiscal policy.
But there's a season for everything. If the US faces a clear economic slowdown, monetary and fiscal questions will again take center stage. That's when Bitcoin will return to the spotlight.
When that happens, the ease of getting Bitcoin exposure via ETFs will likely push demand to new heights.
Until then, we can take comfort in the fact that ETF holders aren't selling.

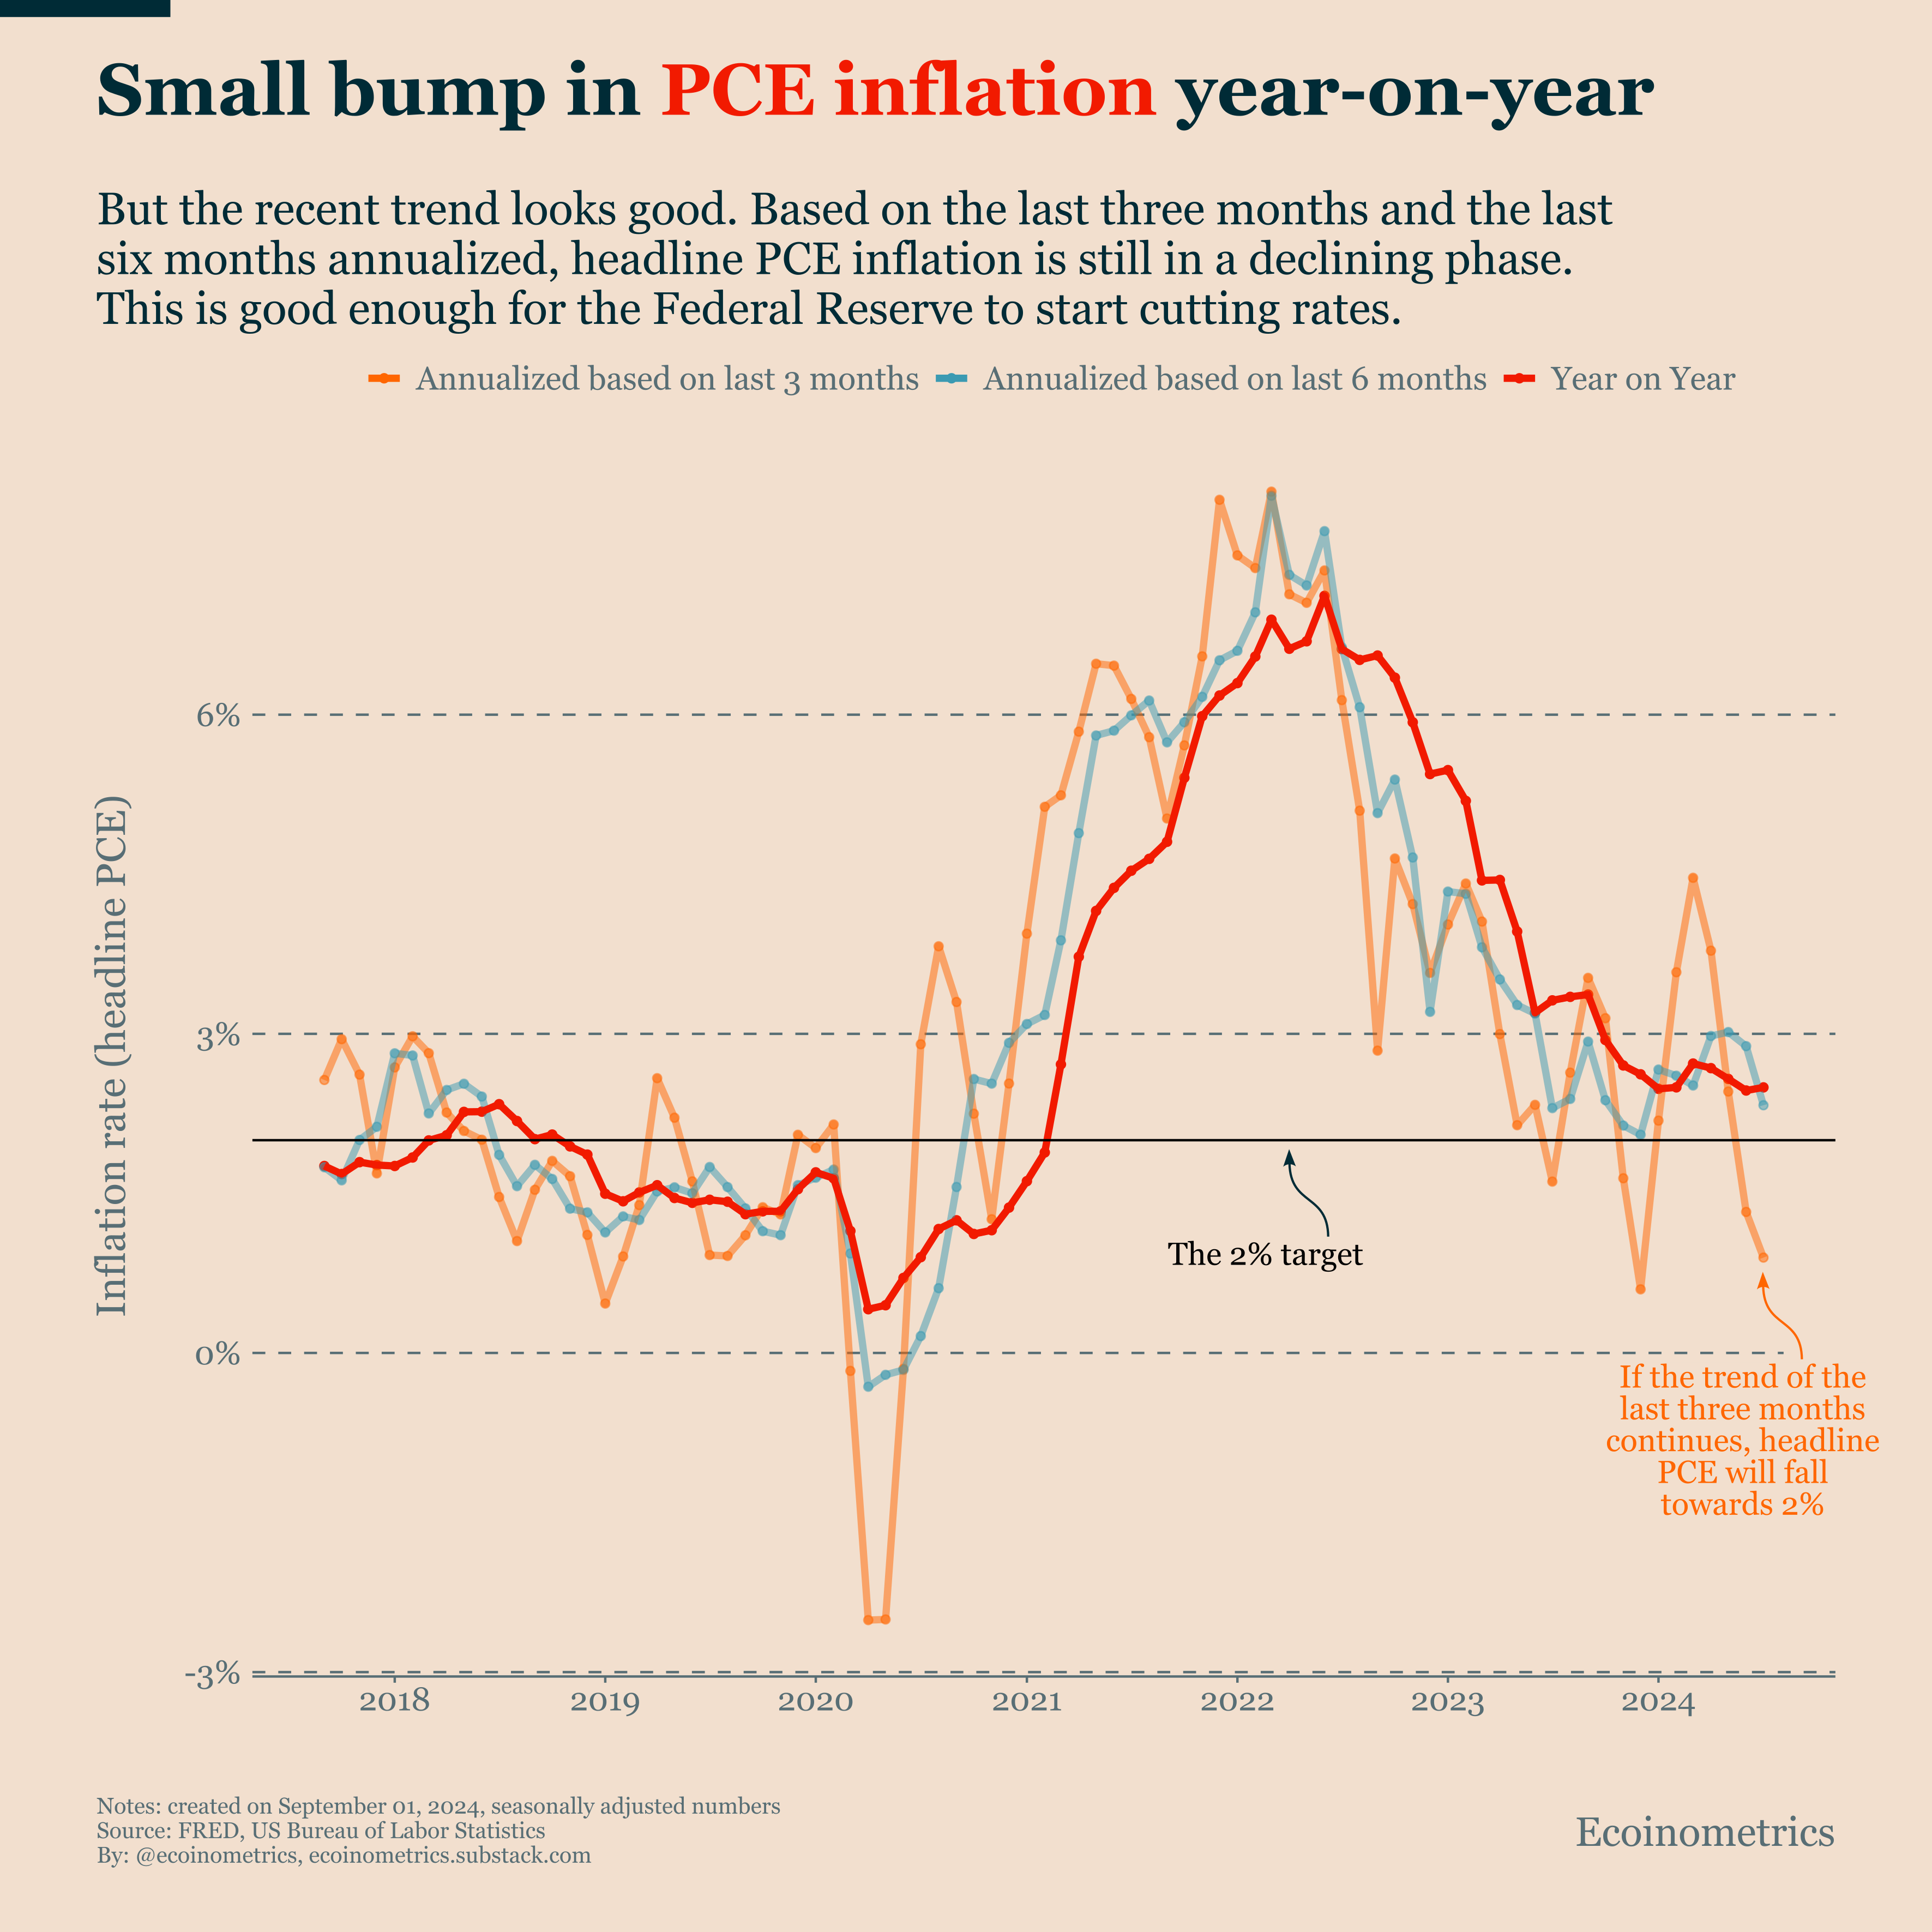
When Inflation At 2%?
PCE inflation, or Personal Consumption Expenditures inflation, is the Federal Reserve's preferred measure of inflation. It tracks the change in prices of goods and services purchased by consumers.
The Federal Reserve doesn't expect PCE inflation to return to the 2% target before 2026. But the Fed has been wrong about inflation before.
We've just had three good months in a row for month-on-month PCE inflation. If this trend continues, headline inflation could decline steeply, as shown by the annualized trajectories in the chart below.
As a result, inflation might reach the 2% target much faster than the Fed anticipates. We could be looking at 6 to 12 months instead of the 24 months projected by the FOMC.
Why is inflation cooling down faster than expected? It's possible that instead of achieving a soft landing, we're moving towards an economic downturn.
At this point, it's not entirely clear. There's a lot of uncertainty in the data. So while it's good to be a long-term optimist, it's worth being cautious in the short term.
That’s it for today. I hope you enjoyed this. We’ll be back next week with more charts.
Cheers,
Nick
P.S. We spend the entire week, countless hours really, doing research, exploring data, surveying emerging trends, looking at charts and making infographics.
Our objective? Deliver to you the most important insights in macroeconomics, Bitcoin and digital assets.
Armed with those insights you can make better investment decisions.
Are you a serious investor? Do you want to get the big picture to get on the big trades? Then click on the button below.
Amazing post! Super insightful!
Great content as always. Cyclical assets such as Bitcoin are best measured across the full cycle (4 years in this case). While the annual comparison is interesting, looking at the last 4 years would be much more telling.