
Bitcoin Is Bleeding Capital
Also Bitcoin’s Drawdown Deepens & Core Inflation Confirms The Problem Runs Deeper

Welcome to Ecoinometrics’ Friday edition.
Each week, we analyze the three most critical market signals impacting Bitcoin and macro assets, delivering institutional-grade insights through data-driven charts and analysis.
Today we’ll cover:
Bitcoin Is Bleeding Capital
Bitcoin’s Drawdown Deepens
Core Inflation Confirms The Problem Runs Deeper
It’s been another difficult week for Bitcoin. But rather than focusing on the price itself, let’s look at what the latest market data says about the forces driving this selloff and whether anything has materially changed beneath the surface.
In case you missed it, here are the other topics we covered this week:


Get these professional-grade insights delivered to your inbox:
Bitcoin Is Bleeding Capital
Bitcoin falling below $60K shouldn’t come as a surprise when you look at what’s been happening beneath the surface.
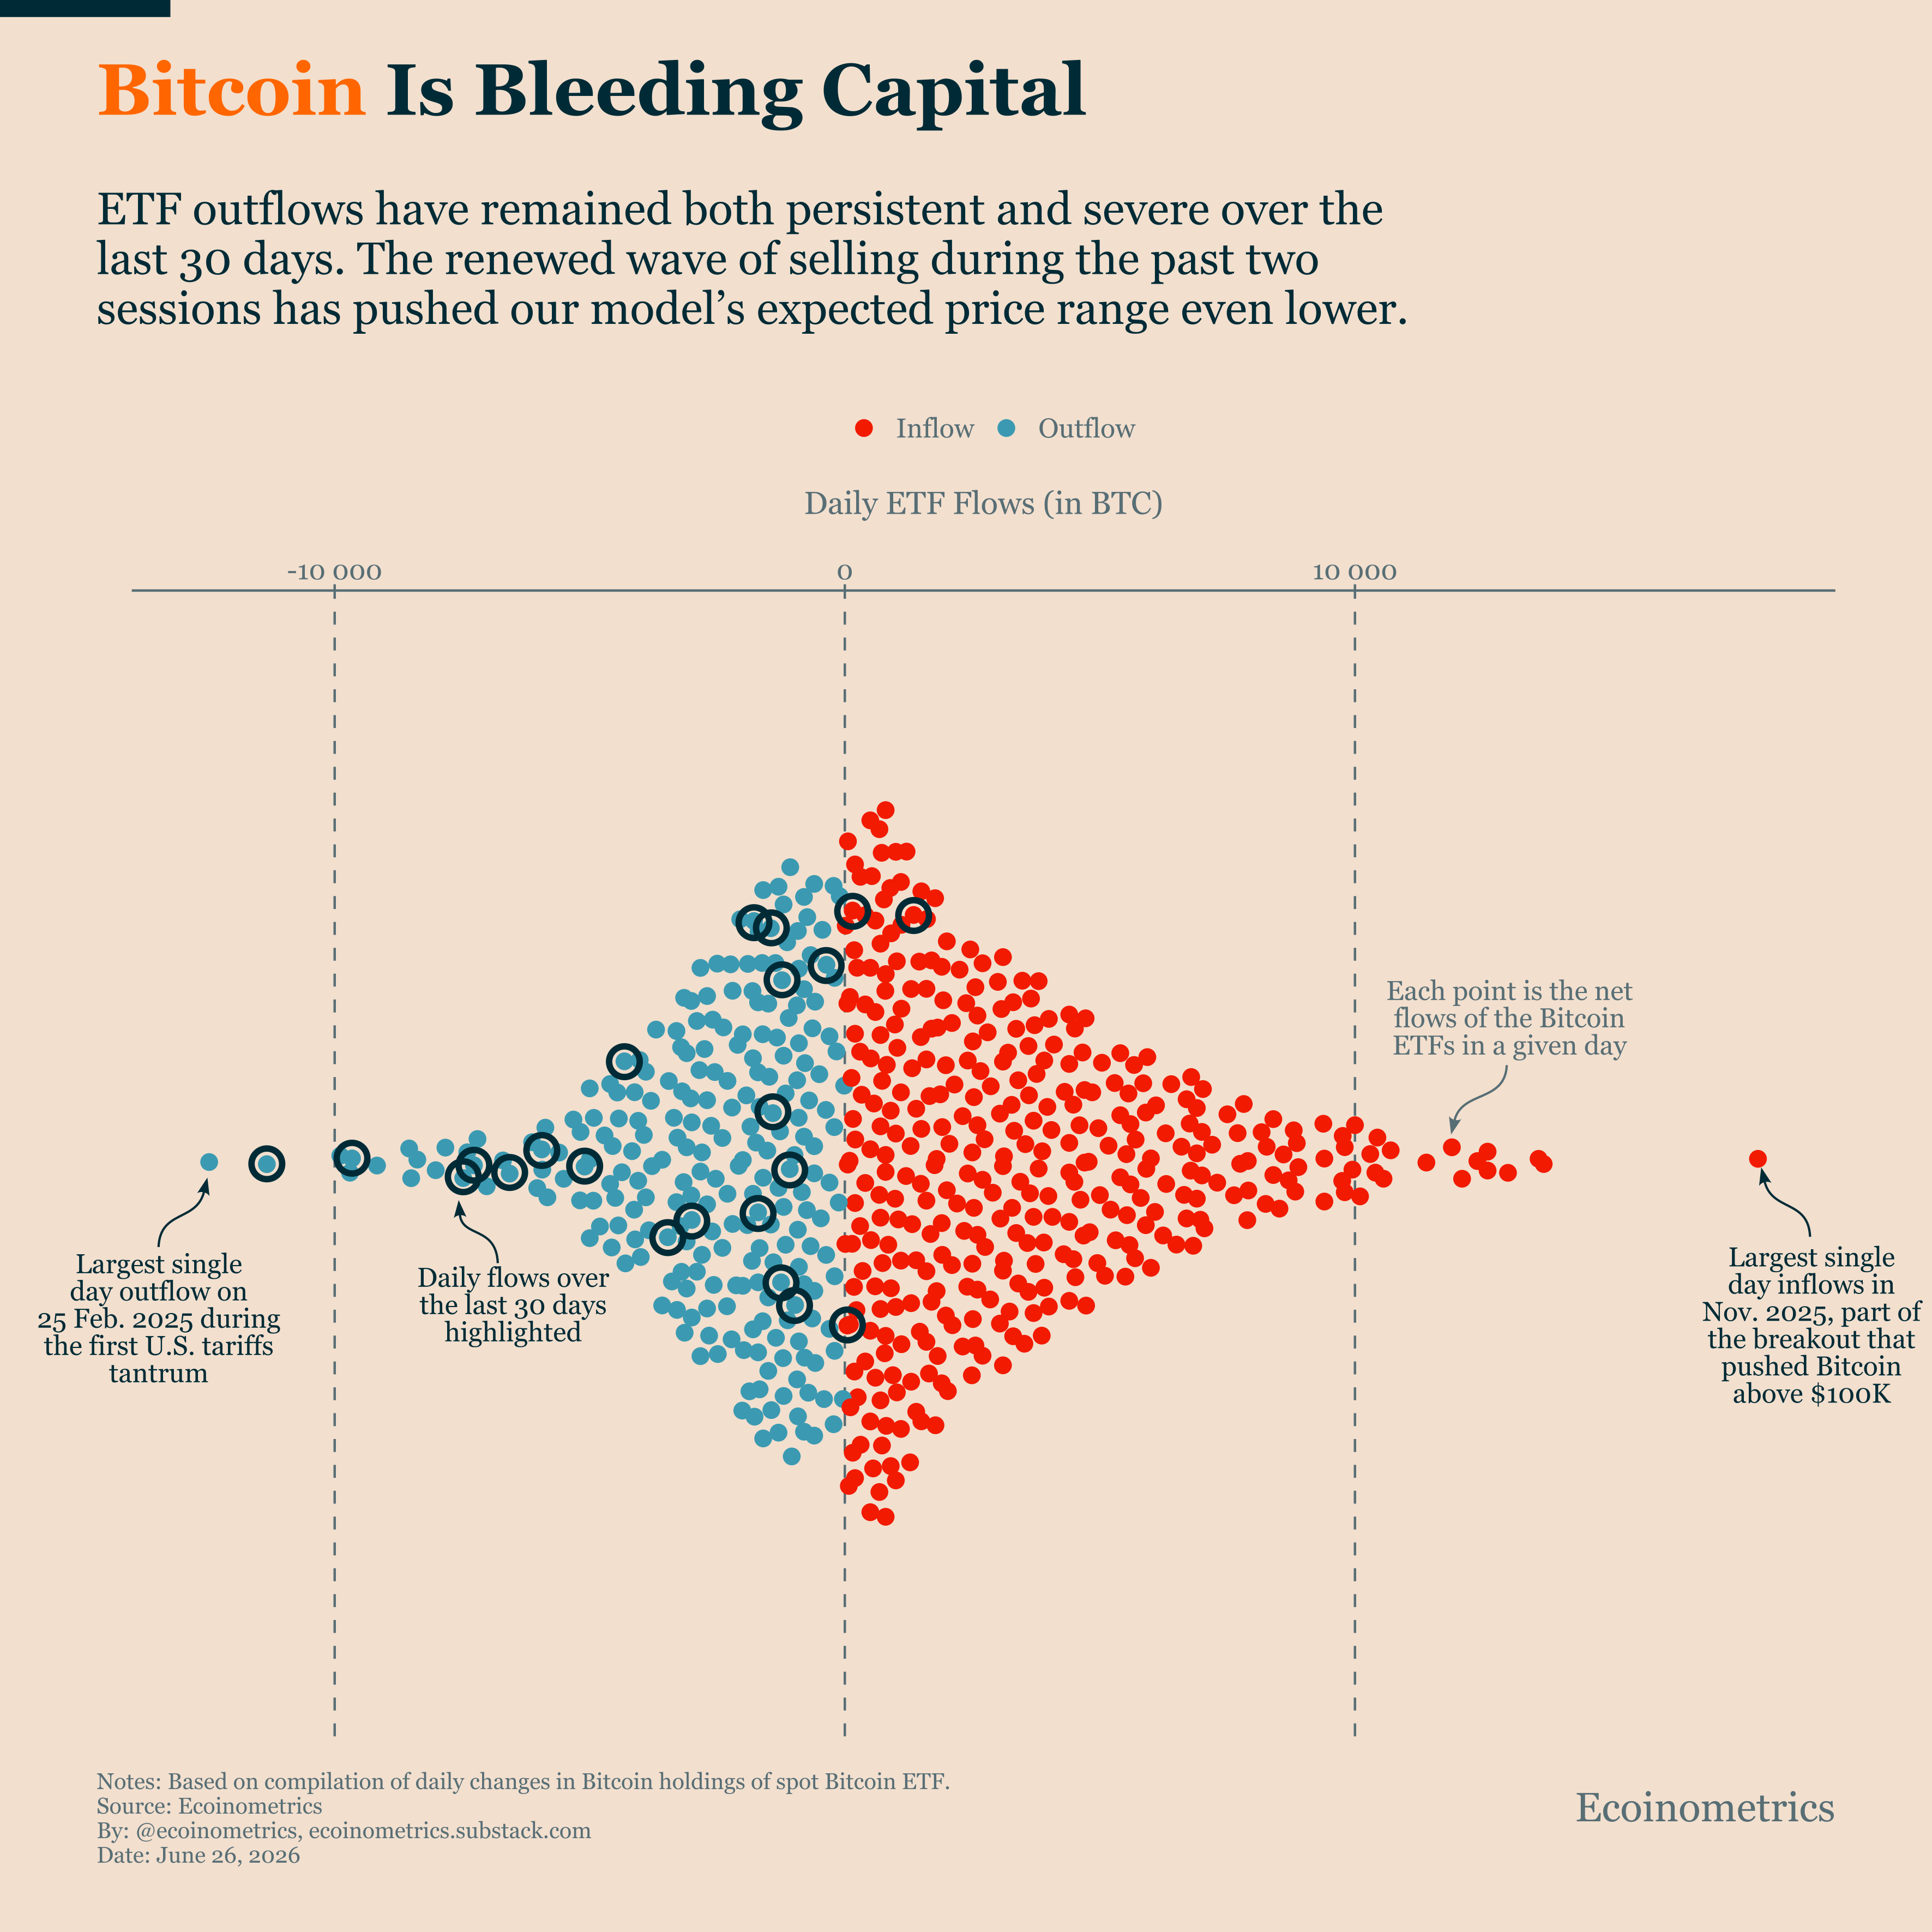
The chart below shows the distribution of daily ETF flows since the spot Bitcoin ETFs launched. We’ve highlighted the last 30 days.
What stands out isn’t one spectacular day of selling (although we have seen a few of those). What stands out is the consistency. Nearly every recent trading session has ended with investors pulling money out of the ETFs, creating one the most persistent stretches of outflows we’ve seen since the funds began trading.
Because ETF demand has become one of the largest drivers of Bitcoin’s price and there is nothing else to compensate that can only result in a bad outcome. As long as that capital keeps leaving the market, Bitcoin has to work against a steady headwind.
The renewed wave of outflows over the last two sessions tells us that process isn’t over yet. Until ETF demand stabilizes, the path of least resistance for Bitcoin is lower.
Bitcoin’s Drawdown Deepens
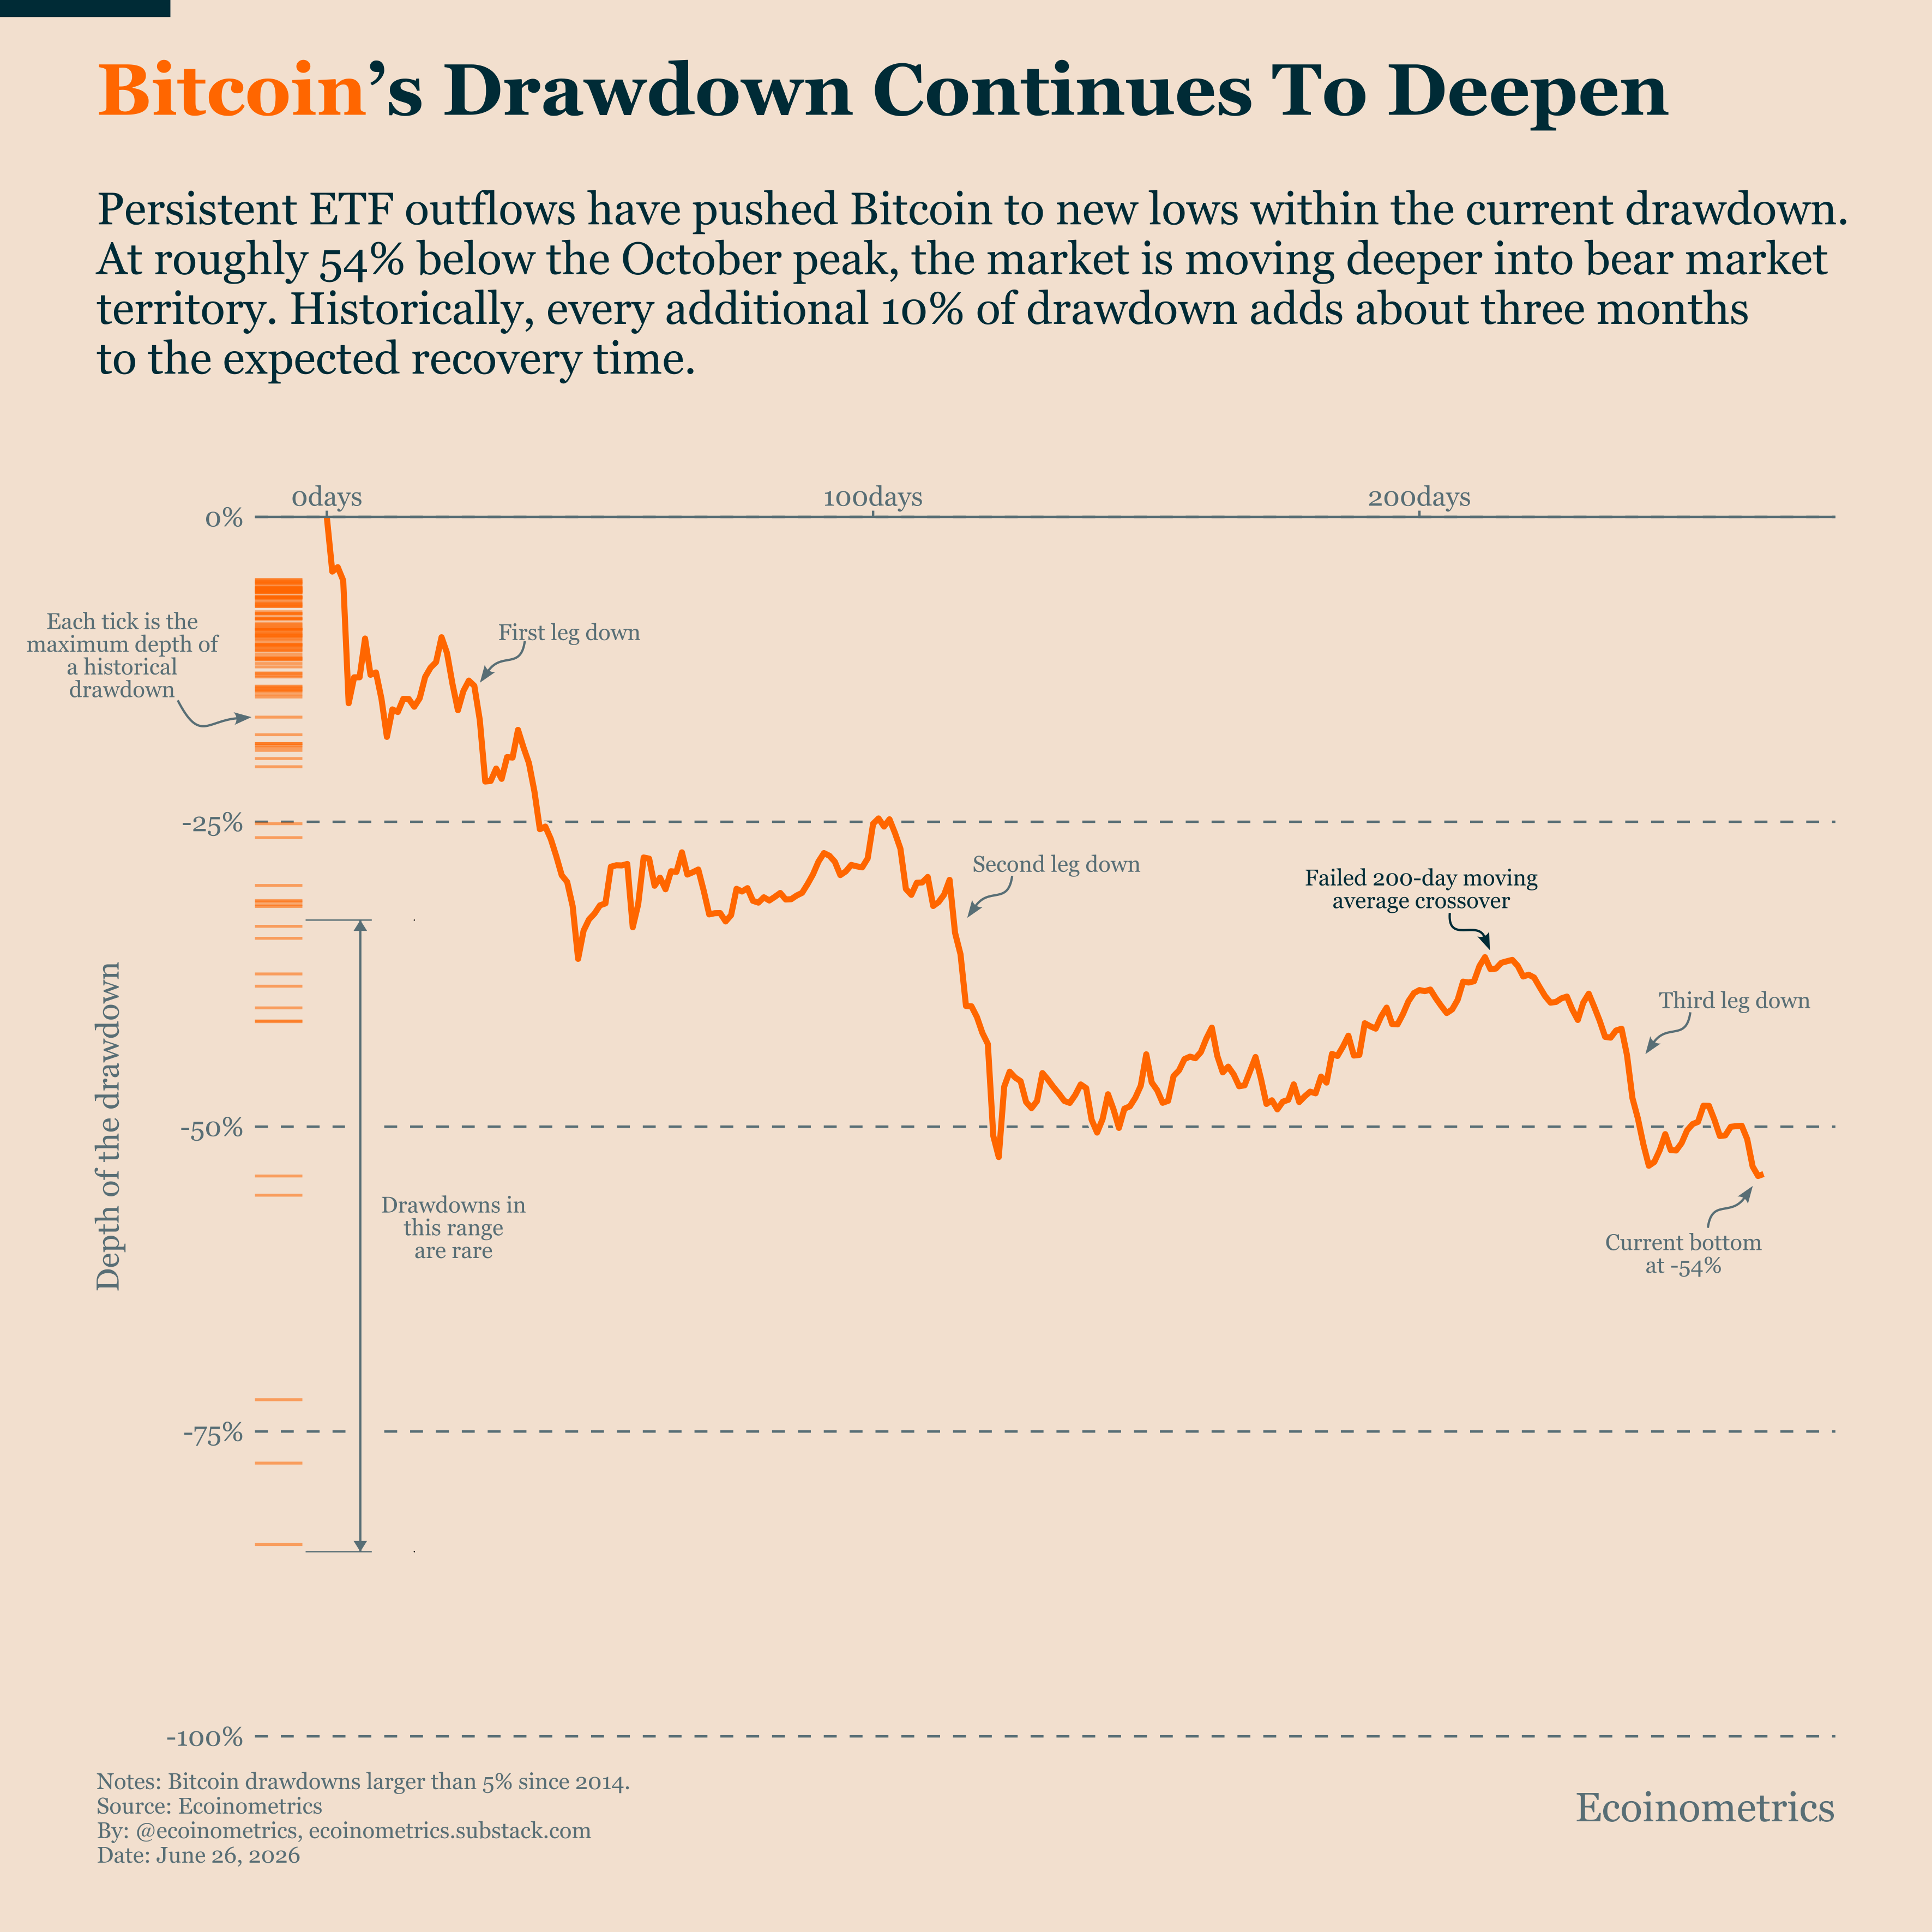
Persistent ETF outflows aren’t just pushing Bitcoin lower. They’re pushing it deeper into bear market territory.
Bitcoin has now fallen about 54% from last October’s peak, making this the deepest point of the current drawdown. That’s already an unusually severe correction by historical standards.
The implication isn’t simply that prices are lower. Historically, deeper drawdowns also take longer to recover from. Looking across previous Bitcoin cycles, every additional 10% decline has typically added around three months to the recovery process.
If selling pressure continues, investors should prepare not only for the possibility of lower prices but also for a bear market that lasts considerably longer than the current conditions suggest.
Core Inflation Confirms The Problem Runs Deeper
Last week we discussed how the latest FOMC meeting signalled the Fed is prepared to keep policy tight, and most likely tighten further this year if inflation refuses to cooperate.
This week’s PCE inflation report explains why.
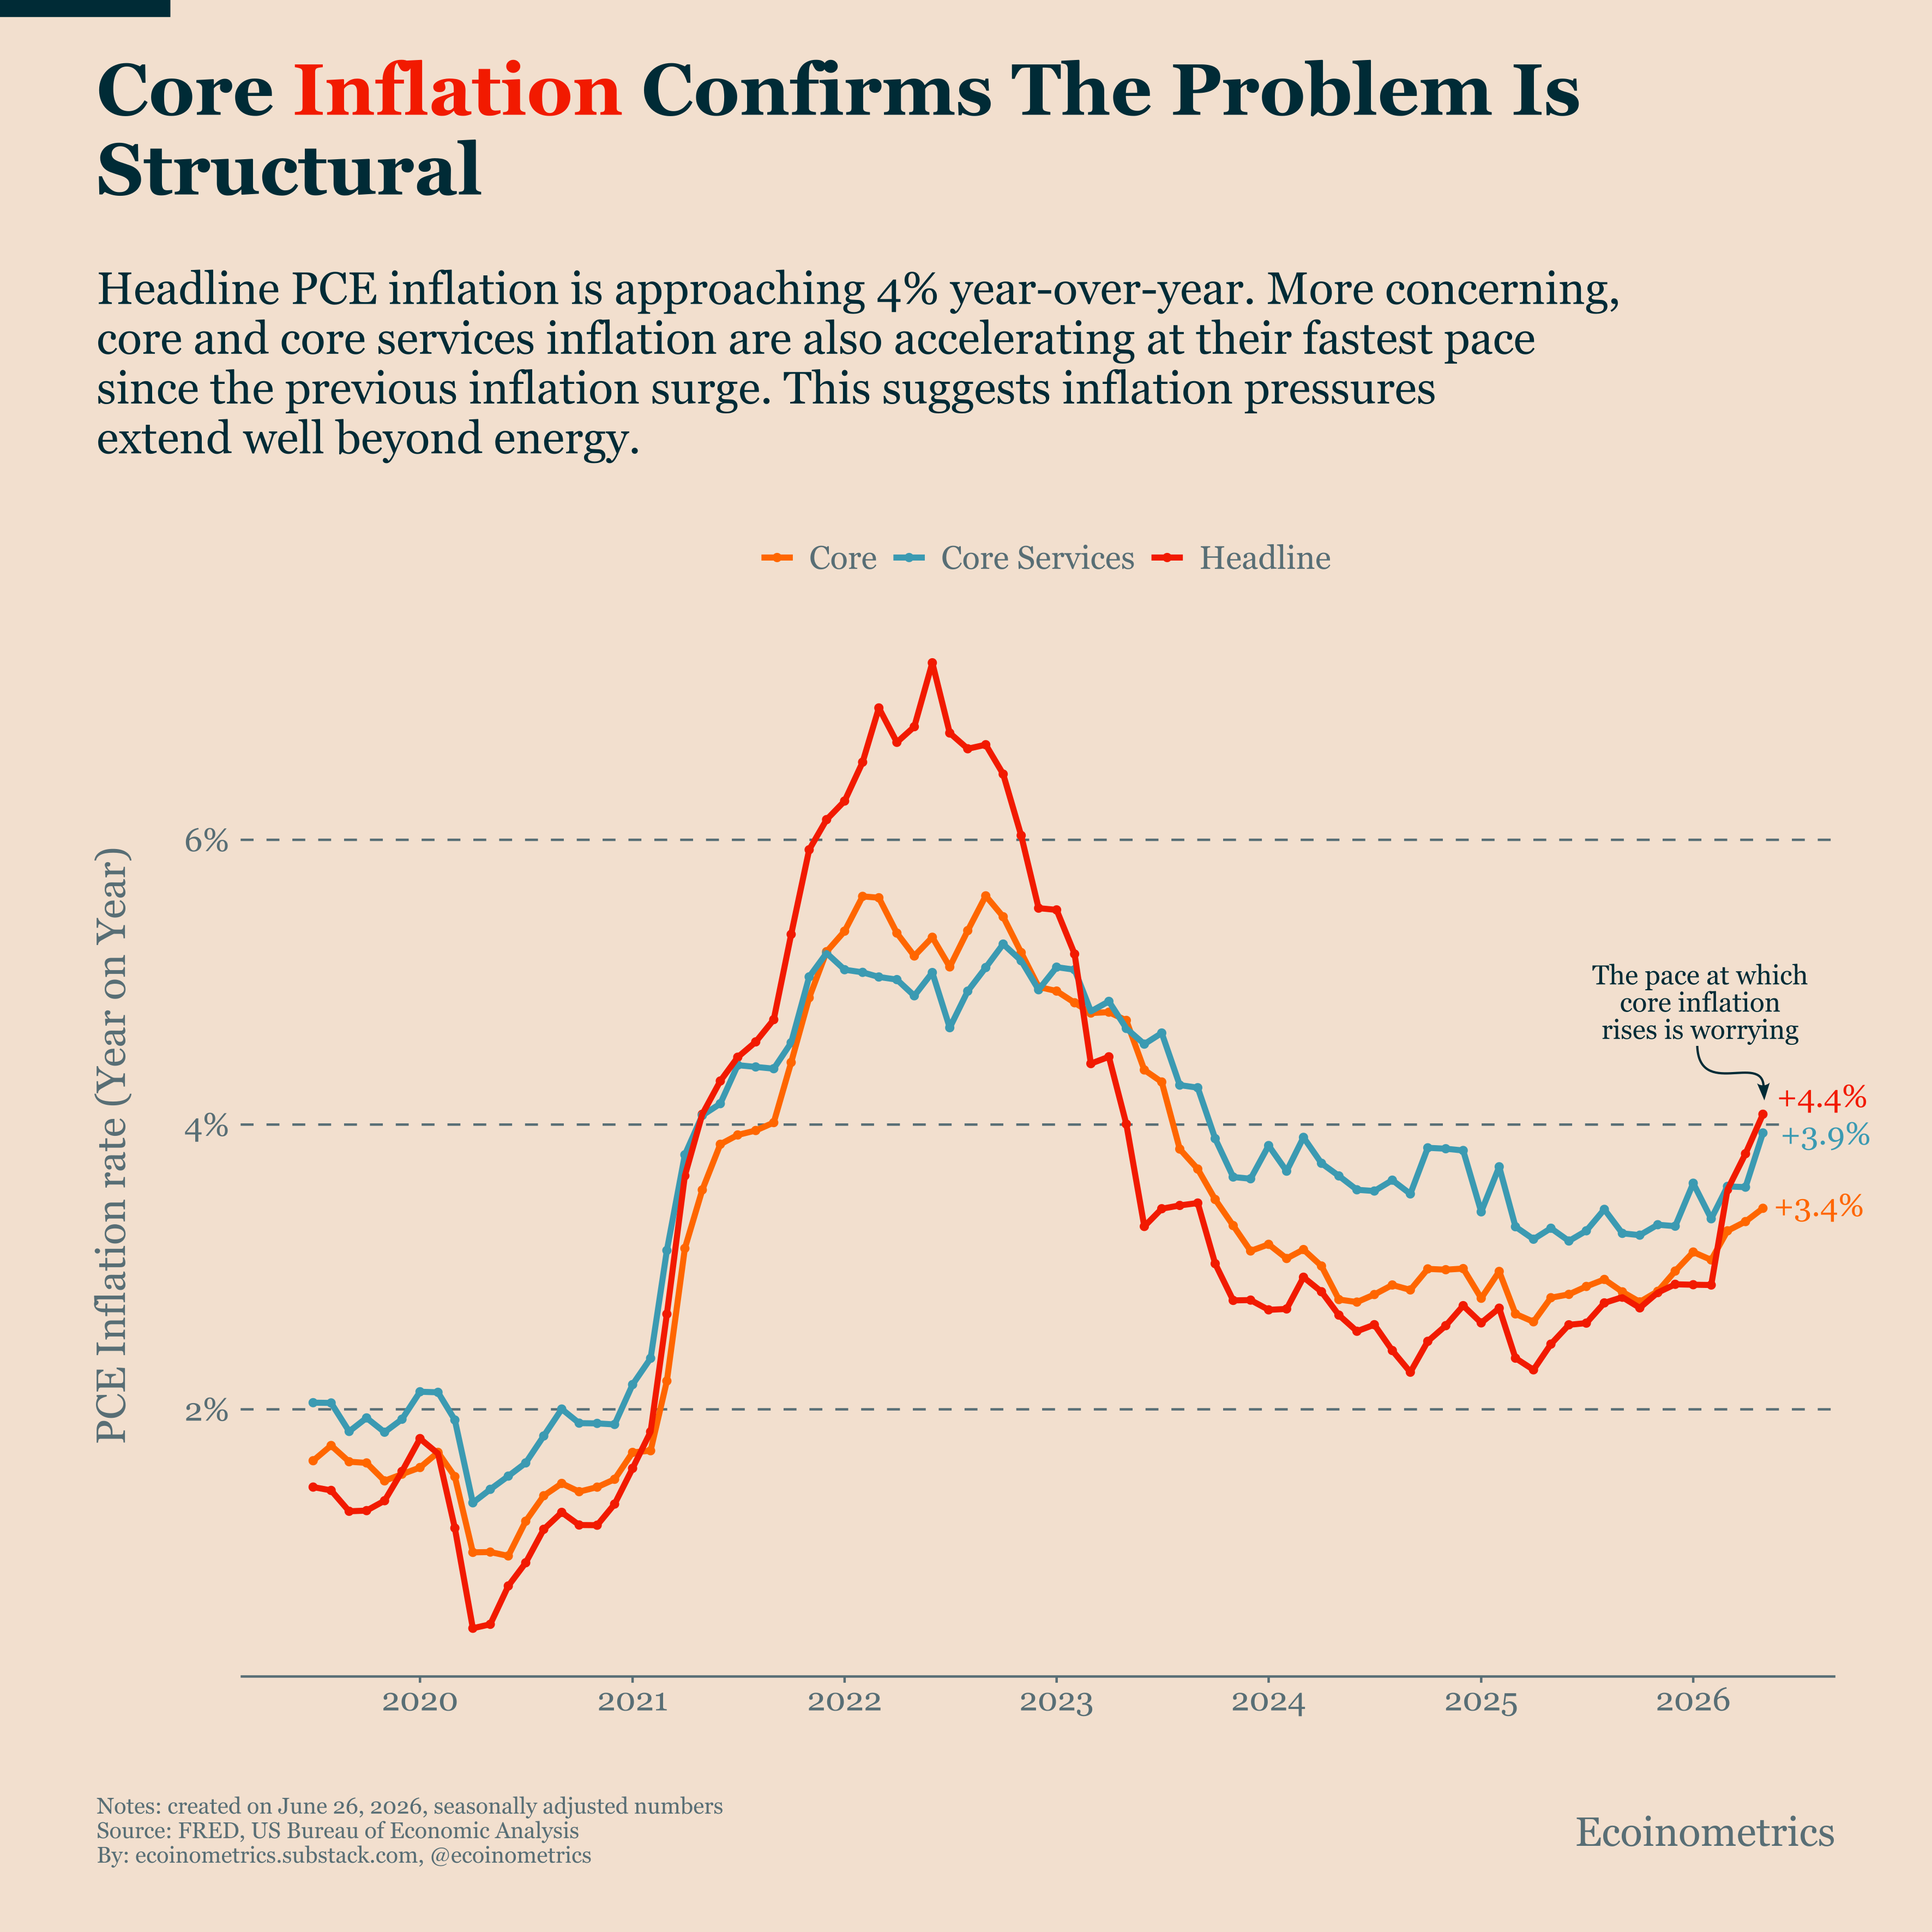
Headline inflation has climbed back above 4%, partly reflecting higher energy prices. On its own, that wouldn’t necessarily be enough to change the policy outlook since that can be seen as transient.
The bigger concern is that core inflation and core services inflation are accelerating as well. Those measures strip out the most volatile components of inflation, making them a better gauge of the underlying trend. Their recent acceleration suggests inflation pressures are becoming more entrenched rather than fading away.
That leaves the Fed with no room to pivot toward easier policy. Financial conditions have already started tightening in response, and that’s another headwind for Bitcoin while ETFs are already bleeding capital.
Tactical Takeaway
All three charts point to the same conclusion: the forces that normally support Bitcoin are absent.
ETF investors continue to withdraw capital, the bear market is pushing into increasingly deep territory, and the latest inflation data reduces the odds of a near-term improvement in monetary policy.
All those forces pulls in the wrong direction.
So that argues for staying patient rather than trying to call a bottom. Our bias remains that Bitcoin is more likely to extend this bear market than begin a durable recovery.
We’ll reassess that view once the data starts telling a different story. As long as capital continues to leave the market, there isn’t much to hope for.
That’s it for today. Thanks for reading.
Cheers,
Nick
P.S. Every week, our team conducts extensive research analyzing market data, tracking emerging trends, and creating professional-grade charts and analysis.
Our mission: Deliver actionable macro and Bitcoin insights that help institutional investors and financial advisors make better-informed decisions.
Ready for institutional-grade research that puts you ahead of the market? Click below to access our premium insights.
Failed to authenticate. API Error: 401 {"type":"error","error":{"type":"authentication_error","message":"Invalid authentication credentials"},"request_id":"req_011CcSE8ncubgHvfxms3UHCG"}
Love this visualization of the last 30 days, I seen a lot of people display this but I think this is my favorite one. Nice work.