Bitcoin Is Following Its Usual Post-Halving Pattern
Also Bitcoin Is Already Catching Up To Gold And Hawkish Vibes At The Fed
Welcome to the Friday edition of the Ecoinometrics newsletter.
Every week we bring you the three most important charts on the topics of macroeconomics, Bitcoin and digital assets.
Today we'll cover:
Bitcoin Is Following Its Usual Post-Halving Pattern
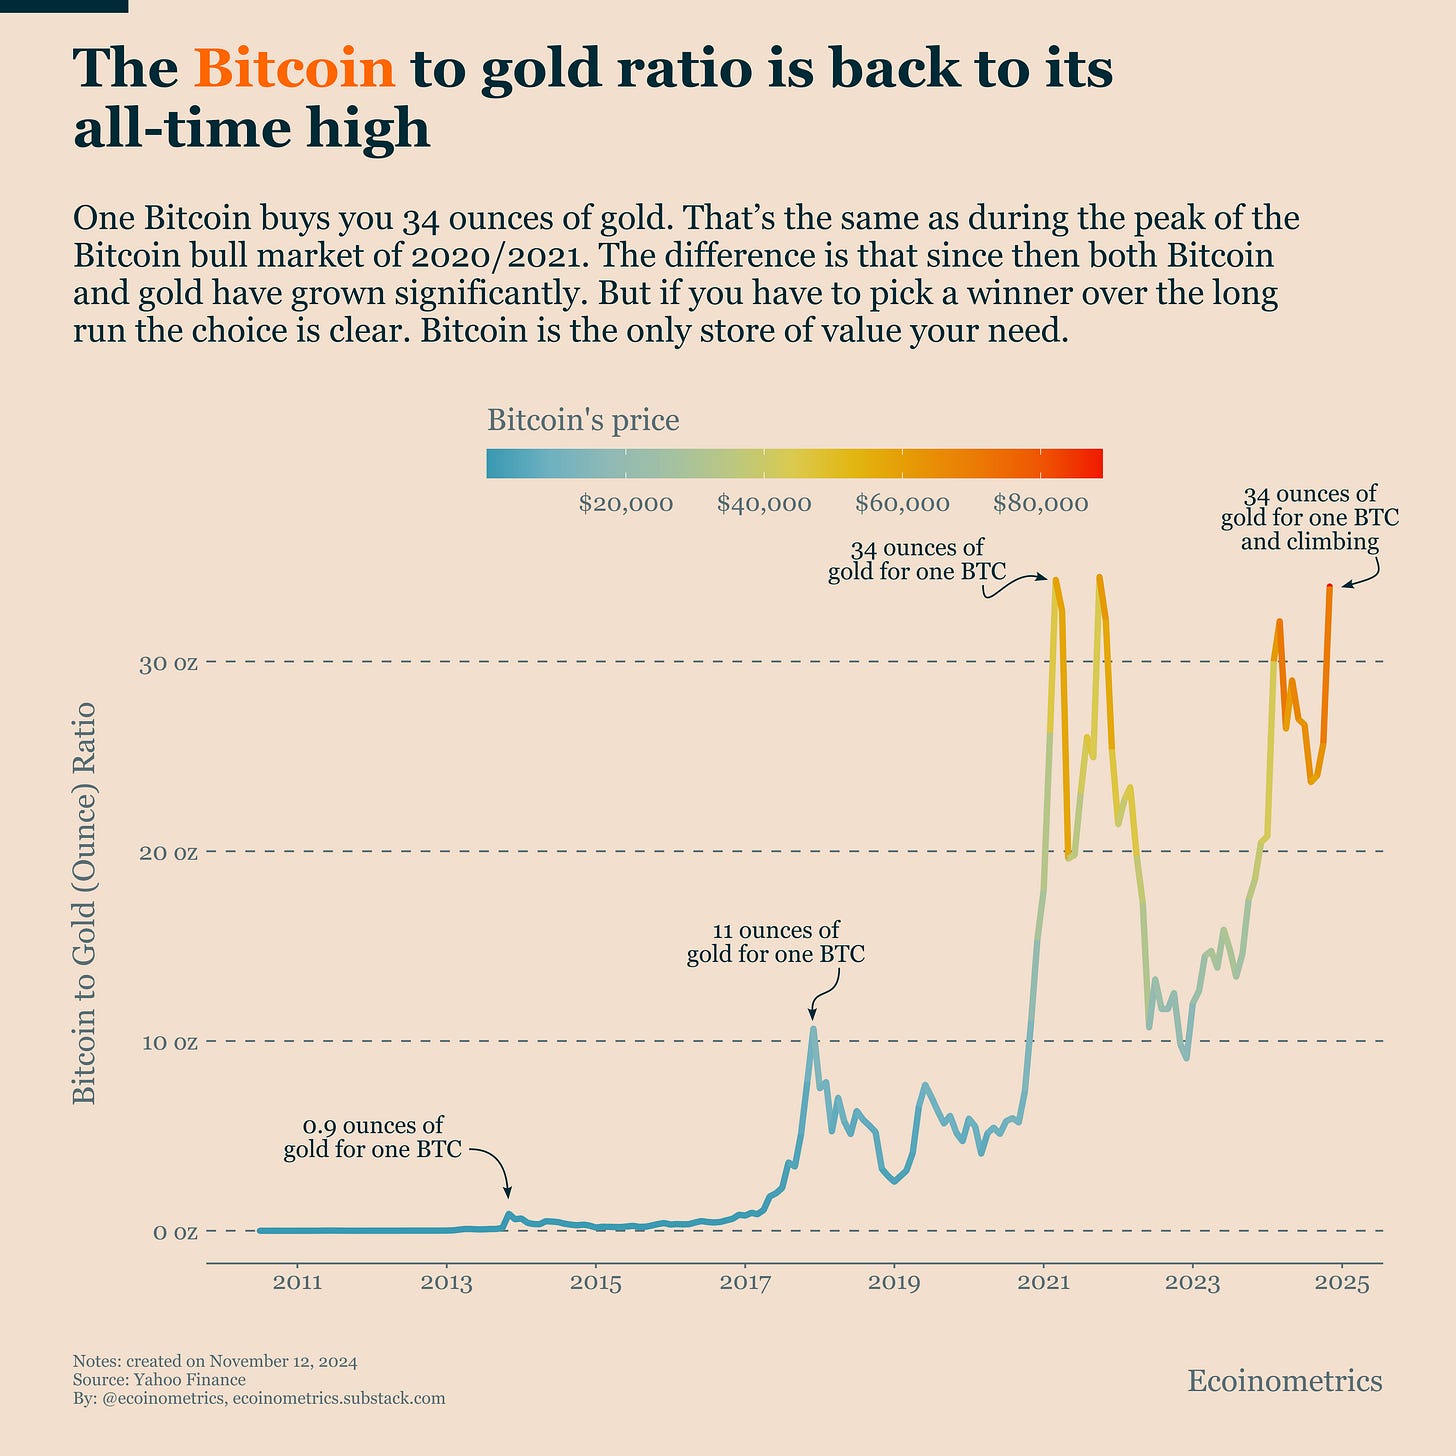
Bitcoin Is Already Catching Up To Gold
Hawkish Vibes At The Fed
Each topic comes with a small explanation and one big chart. So let’s dive in.
In case you missed it, here are the other topics we covered this week:
If you aren’t subscribed yet, hit the subscribe button, to receive this email every week directly in your inbox:
Bitcoin Is Following Its Usual Post-Halving Pattern
What's Bitcoin's typical pattern after a halving?
Step 1 - The halving event itself has little immediate impact.
Step 2 - For several months after, prices remain relatively flat.
Step 3 - Then, typically in the fall, a bull market emerges.
This pattern is playing out again in 2024.
The Bitcoin ETF launches drove prices up early this year. In contrast, the April 19 halving had minimal impact.
Now, seemingly triggered by the result of the U.S. presidential election, Bitcoin is entering a new bull market phase.
Each halving cycle has different catalysts, but the timing remains remarkably consistent.
Despite reaching a new all-time high, Bitcoin still lags behind historical post-halving growth patterns. But it's approaching the lower end of the historical range.
If like me you believe Bitcoin won't face diminishing returns this cycle, here's a rough projection using the bottom of the historical range (see chart below):
BTC at $100,000 by January 1, 2025
BTC at $120,000 by February 1, 2025
BTC at $199,000 by March 1, 2025
If you expect diminishing returns, consider these values as upper limits for Bitcoin's price in the following months.
But the strong ETF inflows, even without ideal financial conditions, are a good sign for this cycle.
Bitcoin Is Already Catching Up To Gold
Over the past 12 months, we've tracked the impressive performance of both major store-of-value assets: Bitcoin and gold.
Bitcoin leads in total returns, though its gains come in dramatic bursts rather than steady increases.
Gold, meanwhile, delivers smoother (and still impressive) returns, giving it better risk-adjusted performance.
But watching Bitcoin's explosive moves when demand surges makes investing in gold instead of Bitcoin feel like picking up pennies in front of a steamroller.
This is exactly what we have witnessed this week. Despite gold's historic run this past year, Bitcoin needed just one week to reclaim its all-time high against gold.
Today, one Bitcoin buys 34 ounces of gold. And don’t forget that Bitcoin's market size remains just a fraction of gold's.
This is promising.
Hawkish Vibes At The Fed
Many investors have been waiting for Fed rate cuts, seeing them as the starting gun for a new golden age in risk assets and crypto.
But as we’ve noticed a long time ago this expectation doesn't make much sense, for two key reasons.
First, financial conditions are already loose. Anything short of a return to quantitative easing (QE) won't significantly change the picture.
Second, with core inflation remaining sticky, the Fed's hands are tied. Deep rate cuts aren't feasible, even if they wanted to.
The market is slowly waking up to this reality, prompted by Jerome Powell's increasingly hawkish tone.
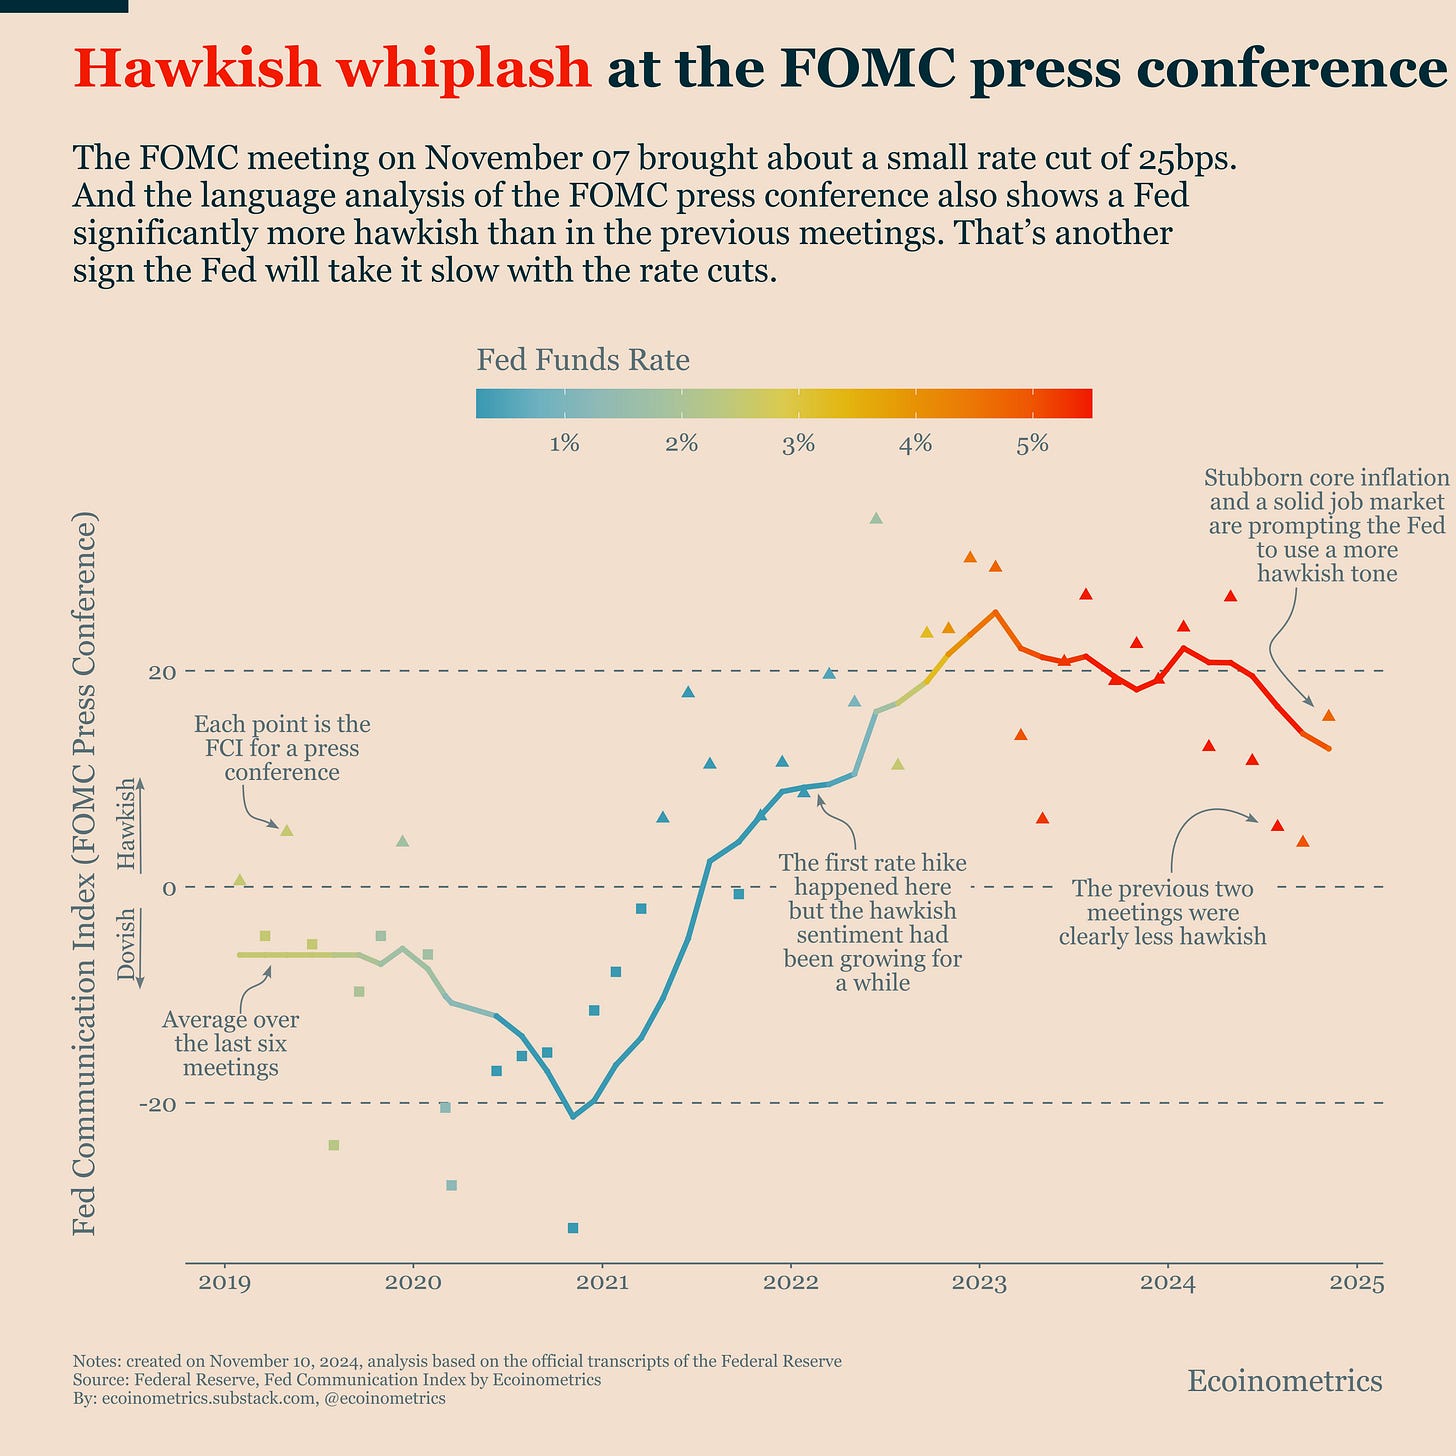
Our Fed Communications Index (FCI) confirms this shift. This index uses quantitative text analysis to measure how hawkish or dovish the Fed sounds across its various communication channels.
Looking at the press conferences since 2020, we can see a clear pattern. While the Fed was gradually becoming less hawkish leading up to the first rate cuts, Powell's tone at the last meeting was notably more hawkish.
This sends a clear message about the near-term direction of rates and the Fed's balance sheet: barring a recession, don't expect drastic actions.
That’s it for today. I hope you enjoyed this. We’ll be back next week with more charts.
Cheers,
Nick
P.S. We spend the entire week, countless hours really, doing research, exploring data, surveying emerging trends, looking at charts and making infographics.
Our objective? Deliver to you the most important insights in macroeconomics, Bitcoin and digital assets.
Armed with those insights you can make better investment decisions.
Are you a serious investor? Do you want to get the big picture to get on the big trades? Then click on the button below.


In a high risk high vol environment the Gold Bitcoin spread widens no? We have already seen this pattern previously, gold, g4+ a few currency’s get bought - Bitcoin doesn’t
Re diminishing returns: in your graph 3rd halving line is lower than 2nd which is lower than 1st. I.e. the three data lines clearly point to diminishing returns?