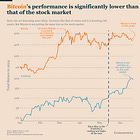
Bitcoin two months after the halving
Also ETFs flows drying up and the Fed target for inflation
Welcome to the Friday edition of the Ecoinometrics newsletter.
Every week we bring you the three most important charts on the topics of macroeconomics, Bitcoin and digital assets.
Today we'll cover:
Bitcoin two months after the halving
No inflows for the Bitcoin ETFs
Federal Reserve target for inflation
Each topic comes with a small explanation and one big chart. So let’s dive in.
In case you missed it, here are the other topics we covered this week:
Bitcoin two months after the halving
How long does it take for Bitcoin to take off after the halving?
Typically 6 to 9 months. During this time, people debate whether the halving is priced in. Spoiler alert: usually it isn't.
Two months post-halving, Bitcoin is hitting the bottom range of trajectories from previous cycles. This bottom corresponds to the second halving cycle's trajectory.
While this may not matter in the big picture, it's where we stand currently. The coming months will be crucial in determining if Bitcoin follows historical patterns or charts a new course.
No inflows for the Bitcoin ETFs
With the Bitcoin ETFs there is a kind of a chicken and egg situation.
Is Bitcoin's price rising what attracts inflows towards the ETFs? Or are the ETFs inflows which are driving Bitcoin's price up by influencing the balance of supply and demand?
The answer is both.
Bitcoin ETFs and price action exhibit a reflexive relationship - rising prices attract inflows, while inflows can drive prices up by influencing supply and demand.
Currently, the average daily coin purchases by ETFs are trending towards zero. This lack of demand is insufficient to sustain price growth.
Given this dynamic, some BTC weakness shouldn't be surprising until ETF inflows pick up. This situation highlights the importance of institutional interest in driving Bitcoin's next moves.
Federal Reserve target for inflation
Where is inflation going ultimately?
If you ask the Federal Reserve they will tell you 2%... over the long run. That's not surprising right? This is the stated goal. The FOMC isn't going to project that they plan on not doing a good job over the long run…
But their shorter-term projections are more revealing.
So here is the plan (for PCE inflation, year on year):
2024 2.6%
2025 2.4%
2026 2%, mission accomplished
Now of course the Federal Reserve has been wrong about inflation before. So take that with a grain of salt.
While the Fed has misjudged inflation before, their plan shows a gradual return to target over 2+ years. Interestingly, they're also preparing for potential rate cuts of 200+ basis points.
This combination of slowly declining inflation and significant rate cuts presents a complex economic scenario. It will be crucial to monitor how these projections align with reality in the coming years.
That’s it for today. I hope you enjoyed this. We’ll be back next week with more charts.
Cheers,
Nick
P.S. We spend the entire week, countless hours really, doing research, exploring data, surveying emerging trends, looking at charts and making infographics.
Our objective? Deliver to you the most important insights in macroeconomics, Bitcoin and digital assets.
Armed with those insights you can make better investment decisions.
Are you a serious investor? Do you want to get the big picture to get on the big trades? Then click on the button below.


¡Muy buenos datos, gracias por el trabajo!