Welcome to the Friday edition of the Ecoinometrics newsletter.
Every week we bring you the three most important charts on the topics of macroeconomics, Bitcoin and digital assets.
Today we'll cover:
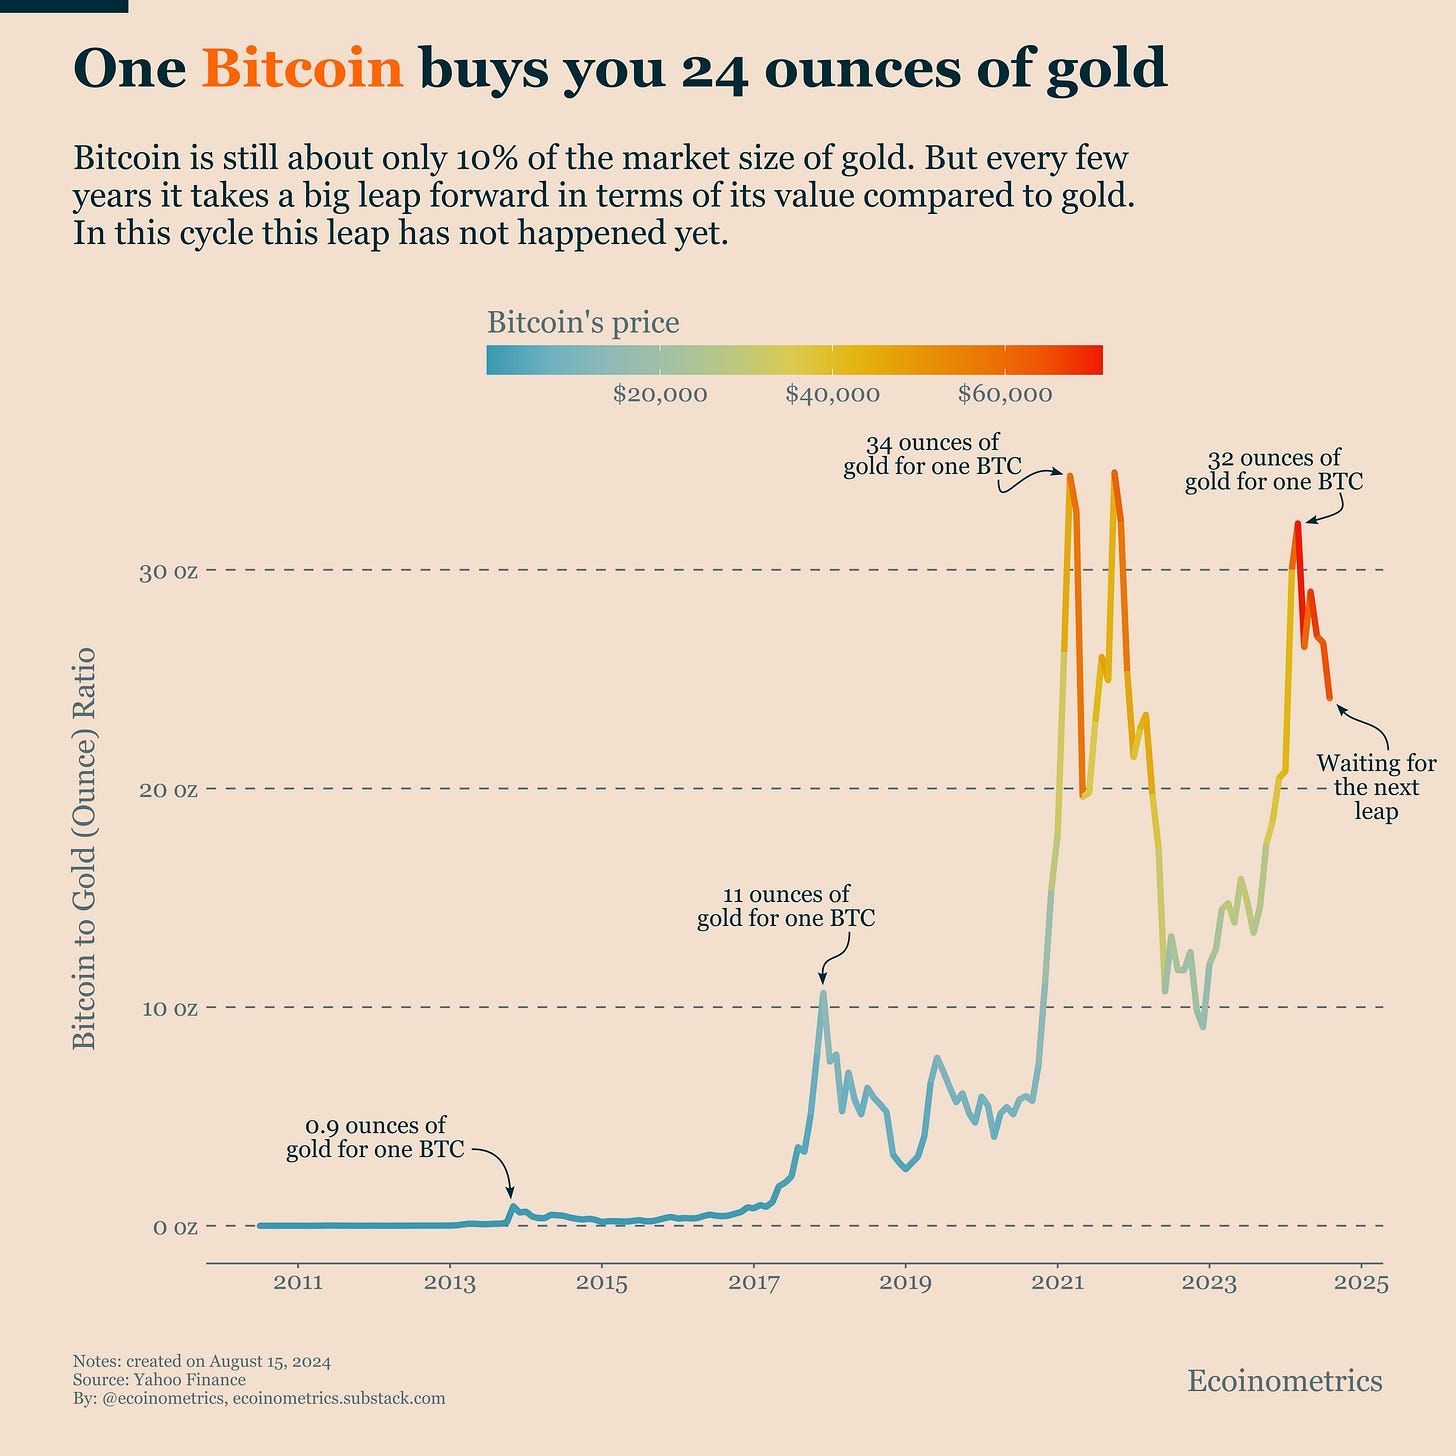
Bitcoin’s Weight in Gold
Four Years of Microstrategy
Inflation Trend Confirmed
Each topic comes with a small explanation and one big chart. So let’s dive in.
In case you missed it, here are the other topics we covered this week:
If you aren’t subscribed yet, hit the subscribe button, to receive this email every week directly in your inbox:
Bitcoin's Weight in Gold: The Battle for Store of Value Supremacy
The battle for the dominant store of value asset continues.
Currently, one Bitcoin buys you about 24 ounces of gold. While this might seem impressive, it actually represents little progress in the grand scheme of things. During the previous halving cycle, we witnessed a peak of 34 ounces of gold for one BTC.
But gold has been slowly moving higher while we are still waiting for the real bull market to start with Bitcoin. So here we are.
You might be tempted to still consider gold a safe bet. However it's crucial to remember that while both assets serve as stores of value, their market sizes differ dramatically. Gold has a market capitalization of over $10 trillion, while Bitcoin's market cap sits at a relatively modest $1 trillion.
So if you have to bet on a store of value for the next decade it makes sense to bet on the one that has the highest growth potential on top of simply keeping up with debasement.
That makes Bitcoin the clear choice.
Four Years of Microstrategy
It's been four years. In that time, Microstrategy has been steadily buying Bitcoin. Now, they own more than 1% of all the Bitcoin out there. That's a big deal.
I talked more about what we can learn from this in Monday's newsletter.
But here's an important reminder: pessimists sound smart while optimists make money.
Four years ago, many folks said Microstrategy's plan was crazy. They thought the company would fail and that Bitcoin wasn't good for businesses to own.
Now look at Microstrategy. They own billions of dollars worth of Bitcoin. They made it through a tough bear market. Their stock price has gone up like 8x.
This shows us something important. If you have done your research, if you trust in your strategy, stick to it and don’t listen to the naysayers.
Inflation Trend Confirmed
The US economy keeps sending mixed signals. Over the past few weeks, we've seen:
Inflation clearly trending downward.
Consumers continuing to spend heavily.
The services sector bouncing back from a brief slowdown, according to the ISM PMI (a measure of economic activity).
US manufacturing still struggling.
With such a mix of data, people can cherry-pick information to support their views. This flexibility in interpretation could work in the Federal Reserve's favour if they want to start cutting interest rates.
The Fed could argue that "the job is done with inflation." Looking at the chart, we can see the annualized inflation rate based on the last 3 months and 6 months is pointing strongly downward. This trend gives the Fed room to start bringing interest rates back to normal levels.
All signs suggest the Federal Reserve wants to cut rates, so it's likely they will. However, as I mentioned last week, I doubt small cuts will have a big impact. We might need to see more significant reductions before we feel major effects in the economy.
The chart shows three different ways of measuring inflation:
Year-on-Year: This compares prices to the same month last year.
Annualized based on last 6 months: This takes the last 6 months of data and projects it to a full year.
Annualized based on last 3 months: This does the same, but with just the last 3 months.
Notice how the 3-month and 6-month lines are dropping faster than the Year-on-Year line. This suggests inflation is cooling off more quickly than it might appear at first glance.
The chart also points out that the pre-COVID inflation level was around 2%. We're getting closer to that target, which could further support the Fed's case for rate cuts.
Let's keep an eye on how this plays out in the coming months.
That’s it for today. I hope you enjoyed this. We’ll be back next week with more charts.
Cheers,
Nick
P.S. We spend the entire week, countless hours really, doing research, exploring data, surveying emerging trends, looking at charts and making infographics.
Our objective? Deliver to you the most important insights in macroeconomics, Bitcoin and digital assets.
Armed with those insights you can make better investment decisions.
Are you a serious investor? Do you want to get the big picture to get on the big trades? Then click on the button below.


😂