Crypto Is Getting A Boost
Also The Four Year Bitcoin Cycle And Money Supply On The Rise
Welcome to the Friday edition of the Ecoinometrics newsletter.
Every week we bring you the three most important charts on the topics of macroeconomics, Bitcoin and digital assets.
Today we'll cover:
Crypto Is Getting A Boost
The Four Bitcoin Year Cycle
Money Supply On The Rise
Each topic comes with a small explanation and one big chart. So let’s dive in.
In case you missed it, here are the other topics we covered this week:
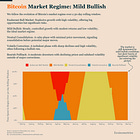
Also checkout the Bitcoin Market Monitor to see what’s driving the market in five charts:
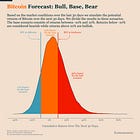
And here is the first version of our Bitcoin Market Forecast for key risk metrics derived from our market regime model:
If you aren’t subscribed yet, hit the subscribe button, to receive this email every week directly in your inbox:
Crypto Is Getting A Boost
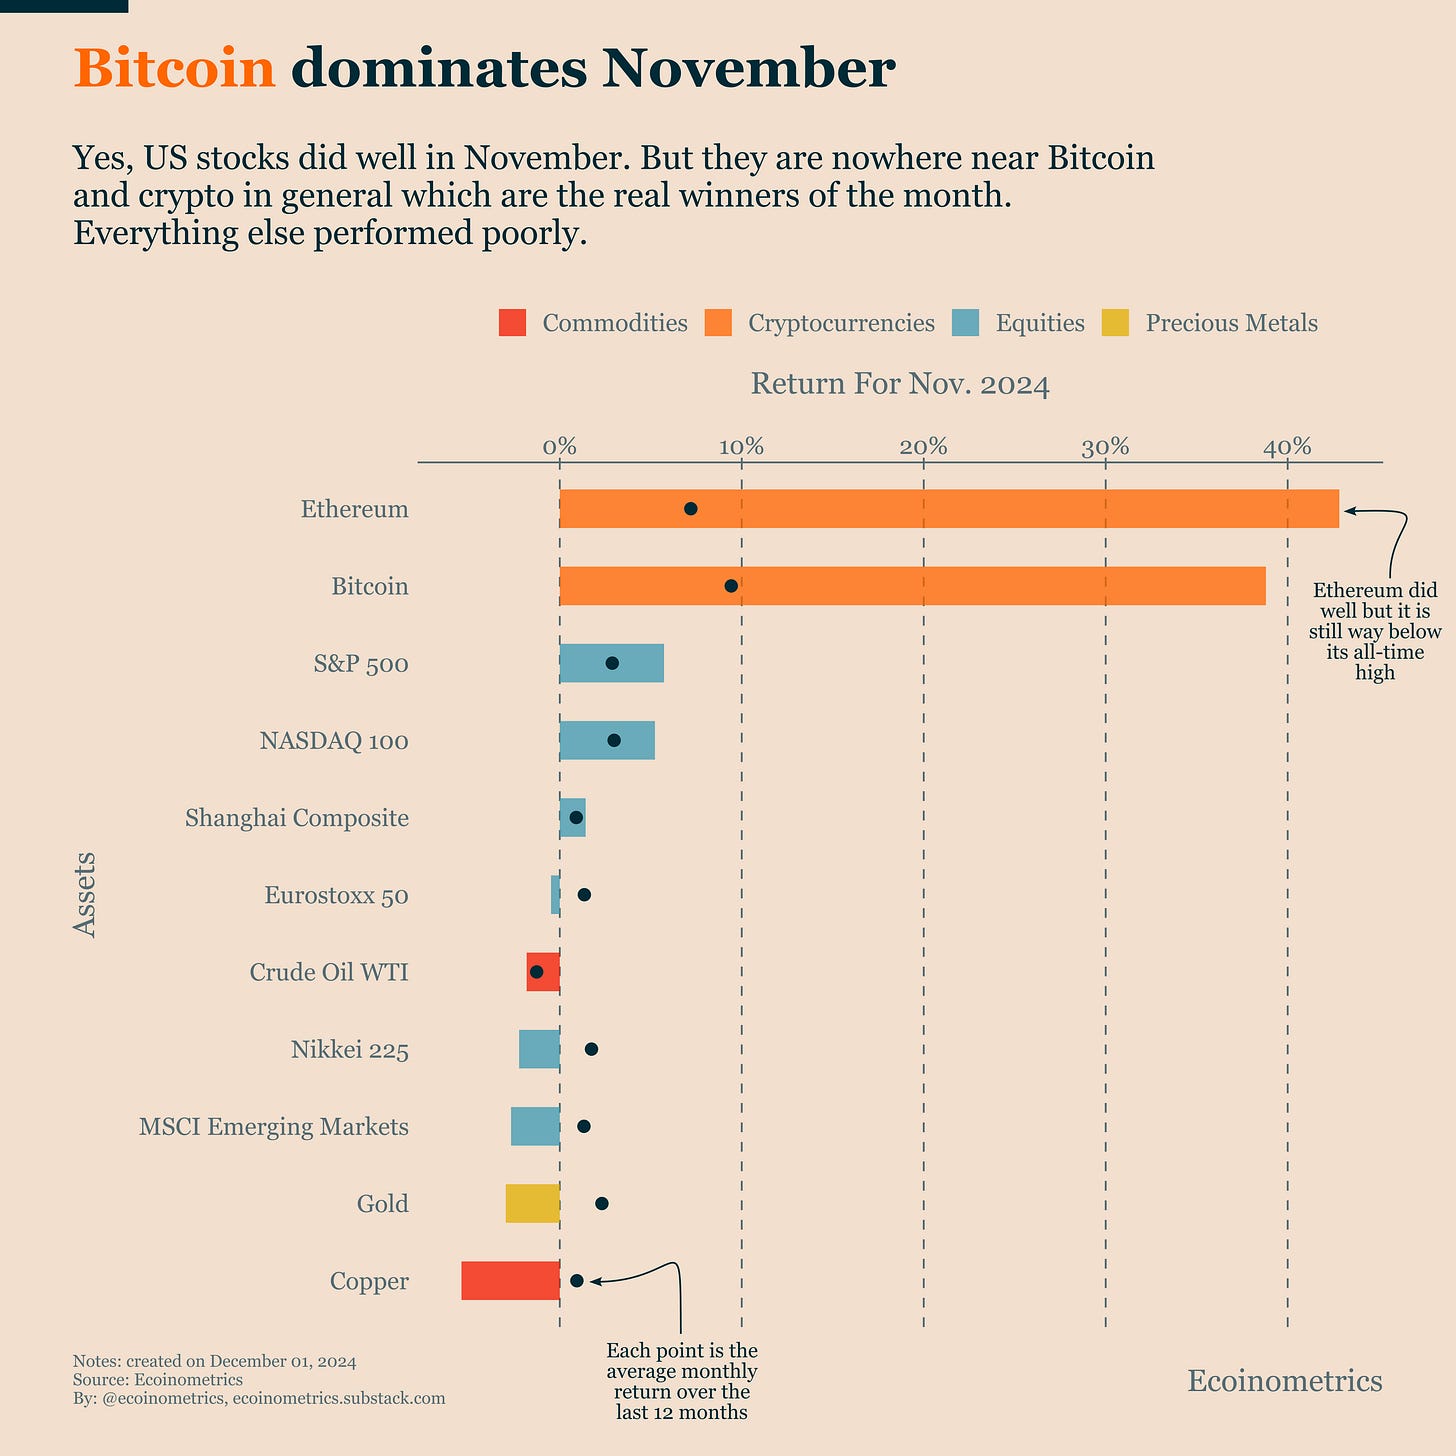
Bitcoin had an extraordinary November. The numbers speak for themselves (and we discuss it through a slightly different angle on Monday).
The chart below compares various assets' November returns. Each dot shows the average monthly return for that asset over the past 12 months.
The assets fall into three distinct groups:
Crypto stands alone at the top. Both Bitcoin and Ethereum showed massive returns that exceeded their 12-month averages.
US stocks performed well, but their gains were modest compared to crypto's potential for rapid growth.
Everything else struggled. International stock indices, commodities, and even gold had a poor month.
Two factors are driving this surge. First, we're seeing a Q4 rotation into crypto from institutional money. Second, investors are betting on favourable crypto policies under the Trump administration.
Ethereum's strong performance suggests this rally goes beyond Bitcoin's strategic value. Investors seem to be responding to Trump's broader pro-crypto stance.
Yet Bitcoin clearly leads the pack. While BTC breaks above $100k and sets weekly all-time highs, ETH remains below its previous cycle peak. Most other cryptocurrencies show limited movement.
For conservative investors, focusing on Bitcoin remains a solid approach.
For those seeking higher-risk opportunities, now might be the time to consider alt coins. The market is showing early signs of broader momentum.
The Four Year Cycle
Looking at history, when Bitcoin gains momentum at year's end, it often signals the start of a powerful bull market.
I won't pretend to fully explain why.
Take the halving, for example. Bitcoin typically enters a bull market in the 12 months after each halving event.
The halving's direct impact on liquidity should be smaller now. New Bitcoin mining adds much less to the total supply than it used to.
And while miners are important players, they can't drive a bull market by themselves anymore. Bitcoin has become too financialized for that.
What we actually see is several four-year cycles running in parallel:
The US presidential election
Global liquidity patterns
The Bitcoin halving
Institutional adoption waves
That last point is crucial this time around. We've seen spot Bitcoin ETFs launch this year (see our report on Wednesday for the impact of ETF flows on the price). These products make it much easier for traditional financial institutions to add Bitcoin exposure. As the market rises, these institutions typically increase their positions, creating a self-reinforcing cycle.
Unless we see major macroeconomic disruptions (which look unlikely right now), this pattern should hold. All signs point to an upcoming period of market exuberance.
Money Supply On The Rise
The US money supply expansion is back, fitting into the four-year liquidity cycle I mentioned earlier. We're seeing a clear reversal after the post-COVID decline.
The current growth rate is modest at 3.1% year-on-year. This is actually lower than the pre-COVID average of about 5%.
But direction matters more than speed right now. We're in the early stages of an upward trend. Like a rocket at launch, it needs to build momentum before the real acceleration kicks in.
This gradual money supply expansion provides additional fuel for Bitcoin's potential bull run as we head into the new year.
That’s it for today. I hope you enjoyed this. We’ll be back next week with more charts.
Cheers,
Nick
P.S. We spend the entire week, countless hours really, doing research, exploring data, surveying emerging trends, looking at charts and making infographics.
Our objective? Deliver to you the most important insights in macroeconomics, Bitcoin and digital assets.
Armed with those insights you can make better investment decisions.
Are you a serious investor? Do you want to get the big picture to get on the big trades? Then click on the button below.


Great stuff, thank you for sharing!! ♥️☀️☮️🌈🏁