The previous post-halving bull markets ended with very large corrections that followed extreme parabolic moves.
If the same thing happens during this cycle you can be sure that the likes of Bloomberg or the Financial Times will declare Bitcoin dead and lament of investors having lost extraordinary sums of money.
But the truth is, unless for the few who started buying at the peak, hodlers will be up significantly over the cycle.
Time for some napkin math.
The Ecoinometrics newsletter decrypts Bitcoin’s place in the global financial system. If you want to get an edge in understanding the future of finance you only have to do two things:
Click on the subscribe button right below.
Done? That’s great! Now let’s dive in.
Bear market correction
But before we do some back of the envelope calculations let's just go back on the ‘if’ from the intro.
There are two thesis:
Parabolic moves have to be followed by massive corrections. That’s just how things are, greed and fear at play.
The Bitcoin market is more mature than it was in the previous cycles. If we start seeing a big correction, deep pockets investors will pick up coins at a discount. That should dampen the extent of the drawdown.
In favour of the 2nd thesis you can say that, yes, the landscape of Bitcoin investors has changed. In 2013 and 2017 the market was driven almost entirely by retail investors.
This time, on top of the retail crowd, we also have hedge funds (big and small), companies using Bitcoin as a treasury tool and big asset managers just starting to enter the space.
So you might think that if the retail crowd wants to cash out after a parabolic move there will be players with a long term horizon to buy those coins. And that should prevent the BTC from experiencing say -85% drawdowns.
Fair enough.
But at the same time institutional investors are introducing new risks. For each institutional player that buys Bitcoin as a long term hedge against inflation / fiat currency risks, how many are just buying to try and make a quick profit?
If you run a hedge fund and your Bitcoin position has returned you 500% for the quarter it is pretty likely that you are going to cash out some of those gains.
Many funds rebalancing by selling BTC at the end of the quarter certainly creates a new risk of negative pressure on the price.
Then there is risk. While not universally true, institutional players tend to have tighter risk management for their books than retail investors.
As an individual investor, if Bitcoin dropped 50% tomorrow I’d just yawn and go stack more sats. But in a business context it could be that my portfolio manager comes tapping me on the shoulder and asks me to offload my position.
Again many institutional players doing this at the same time could trigger a very large drawdown.
So really who knows what can happen.
You might as well assume the worst, see how it would look like and compare that to more favourable scenarios. This way you can weigh the risk vs the potential reward and decide if it is worth taking the bet.
Right now we are in another one of those drawdowns that commonly happens during a post-halving bull market: 20% drawdown, 5 days, nothing special.
Honestly the current price action does not look like a bull market top for Bitcoin.
But after the top of the last two cycles BTC experienced prolonged bear markets which bottomed around 85% from the previous top.
So as promised, armed with that knowledge we can do some napkin math.
Imagine some extreme scenario.
You build a Bitcoin position. After that’s done you ride the entire bull market up to the top. Then you ride the bear market all the way down to the bottom.
At the bottom of the bear market what would your return on investment look like? Would you still be positive or would your position be under water?
Alright, to answer this question we need:
The average price at which you purchased BTC. That’s the reference for calculating your return on investment.
The price at which BTC will find its top during this cycle. That’s the reference for which you calculate the drawdown of the bear market.
The size of the drawdown expressed as the percentage drop from the top.
The math is simple, you can follow along:
Take the price at which you think Bitcoin will find its top.
Multiply that price by 1 minus the size of the drawdown to get the bottom of the bear market.
Take the bottom of the bear market minus your average purchase price to find out if you are in the green or in the red.
Or if you don’t want to do that just look at the pictures below...
Scenario number 1: you have been dollar cost averaging for ages and your average purchasing price is now $5,000 per coin.
Check out the chart below:
On the horizontal axis you have the value of BTC at the top.
On the vertical axis you have the size of the drawdown.
Each point corresponds to your return on investment for a given value of the top and a given size of the drawdown.
The darker the colour of the point the larger your return on investment.
If Bitcoin tops at $120k (which is where it would flip Apple) and experience a -85% drawdown then your position would still be up +260%.
And if instead we get a much smaller drawdown this time then your ROI is easily above 500% even if the top is at a much lower price.
That’s nice, but not everyone has been hodling for years or bought at the bottom in March 2020.
So on to scenario 2: you started stacking sats after the 3rd halving and now your position is at an average price of $10,000 per BTC.
In that case as long as the top is above $70k, even if the drawdown of the bear market reaches -85% your position will still be in profit.
Very nice. But what if you don’t have any position yet? What if you start buying now and your average purchasing price is $60k per BTC.
In this 3rd scenario if BTC can reach PlanB’s S2FX target then you can still sustain an 80% drawdown without being in the red.
So what’s my point?
Even the worst case scenarios don’t look that bad compared to the potential upside. Start stacking sats now and you should be able to weather anything the market throws at you.
CME Bitcoin Derivatives
Let’s do a quick review of the state of the CME derivatives.
The most interesting thing this week happened in the options market. You know how I’ve been saying for weeks that options are dead?
Well we got some activity on the puts. The drop over the weekend got some people worried and you can see that yesterday the number of puts surged. Mostly one position for around 500 BTC at the $40k strike.
As a result the puts to calls ratio is back at 1 to 1. We haven’t seen that pretty much since the CME introduced Bitcoin options last year.
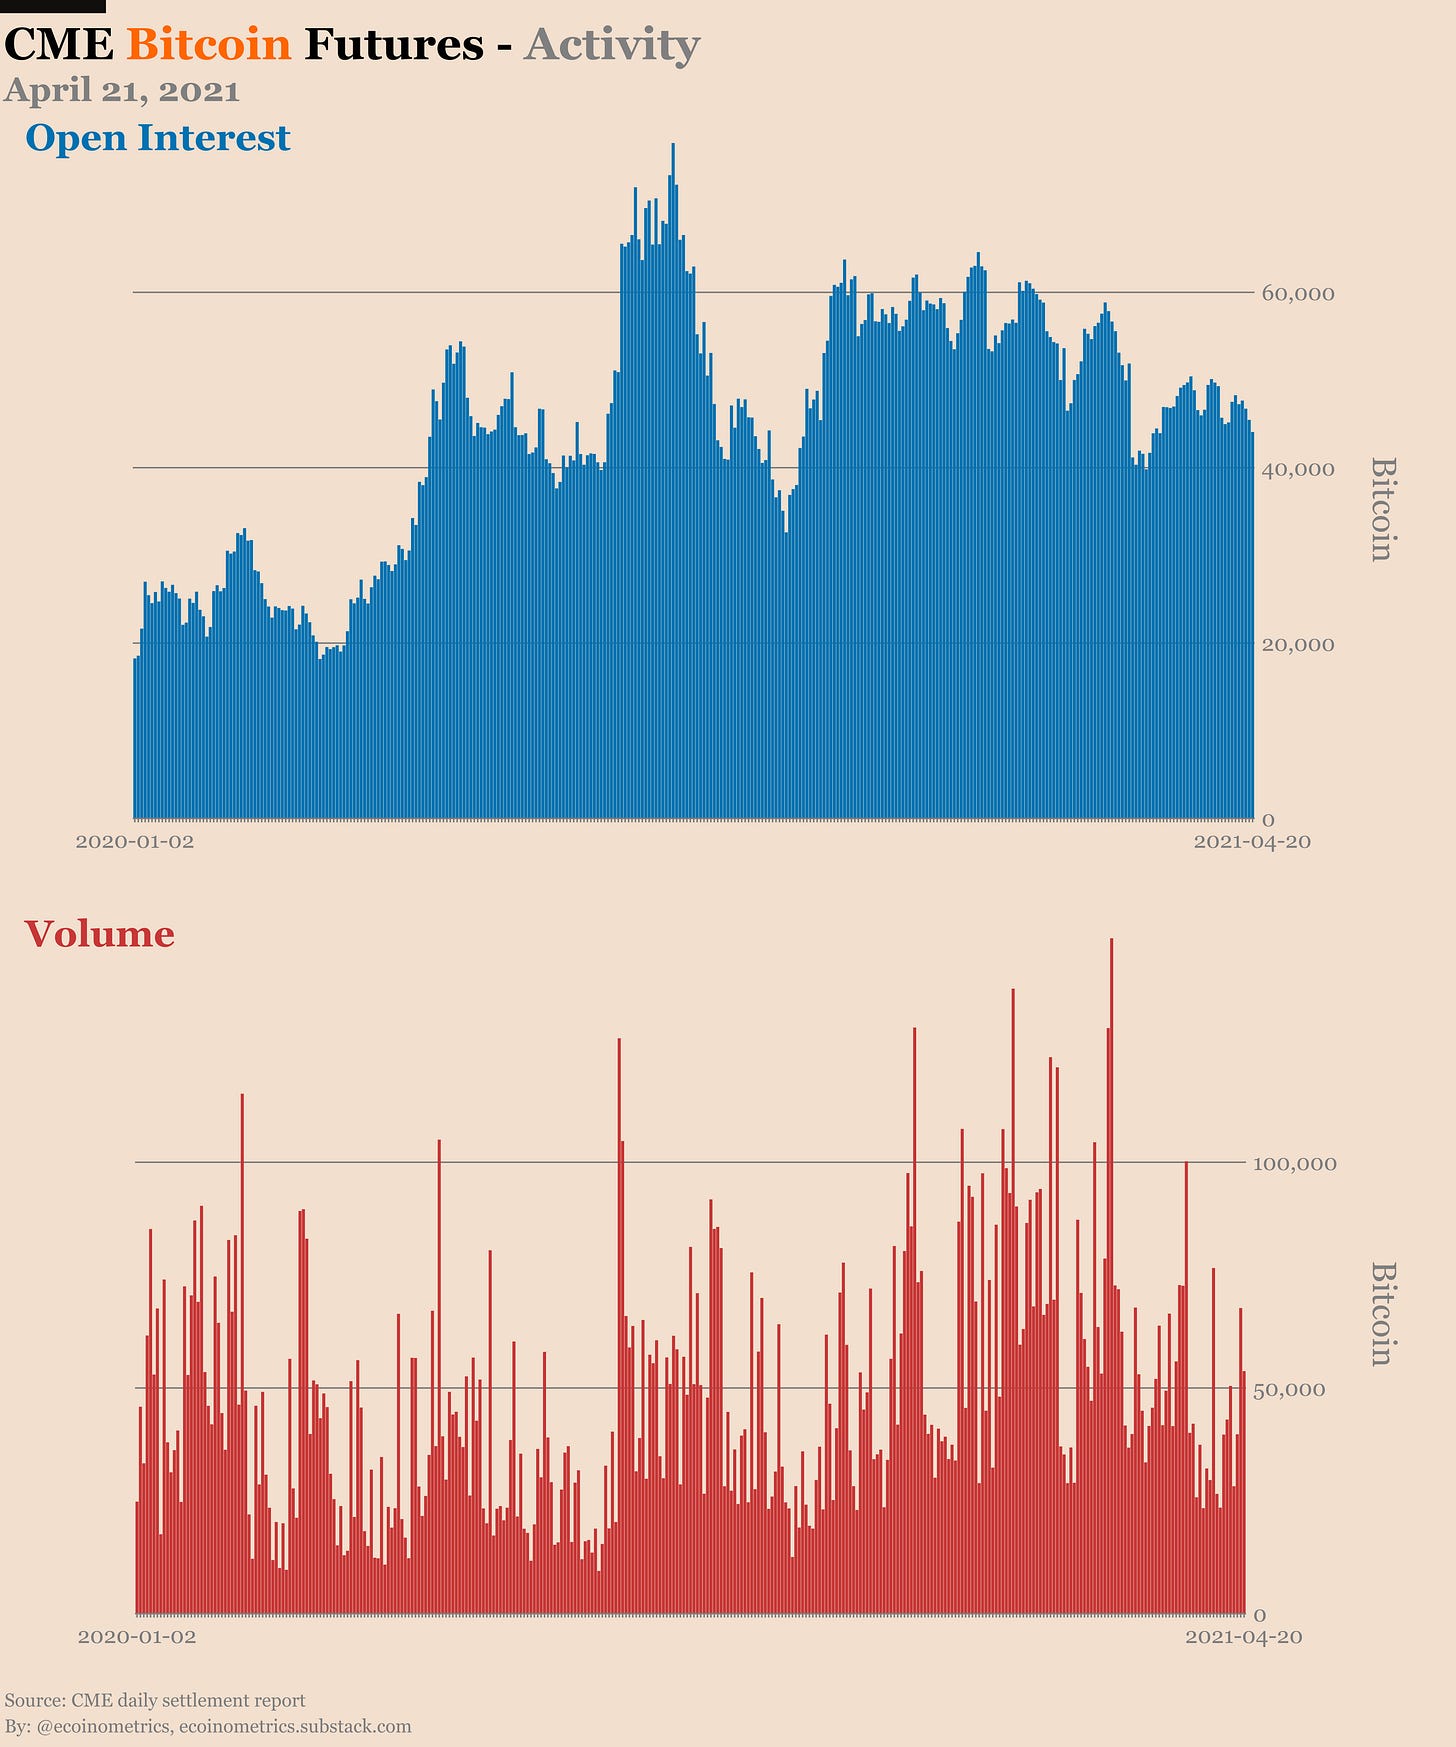
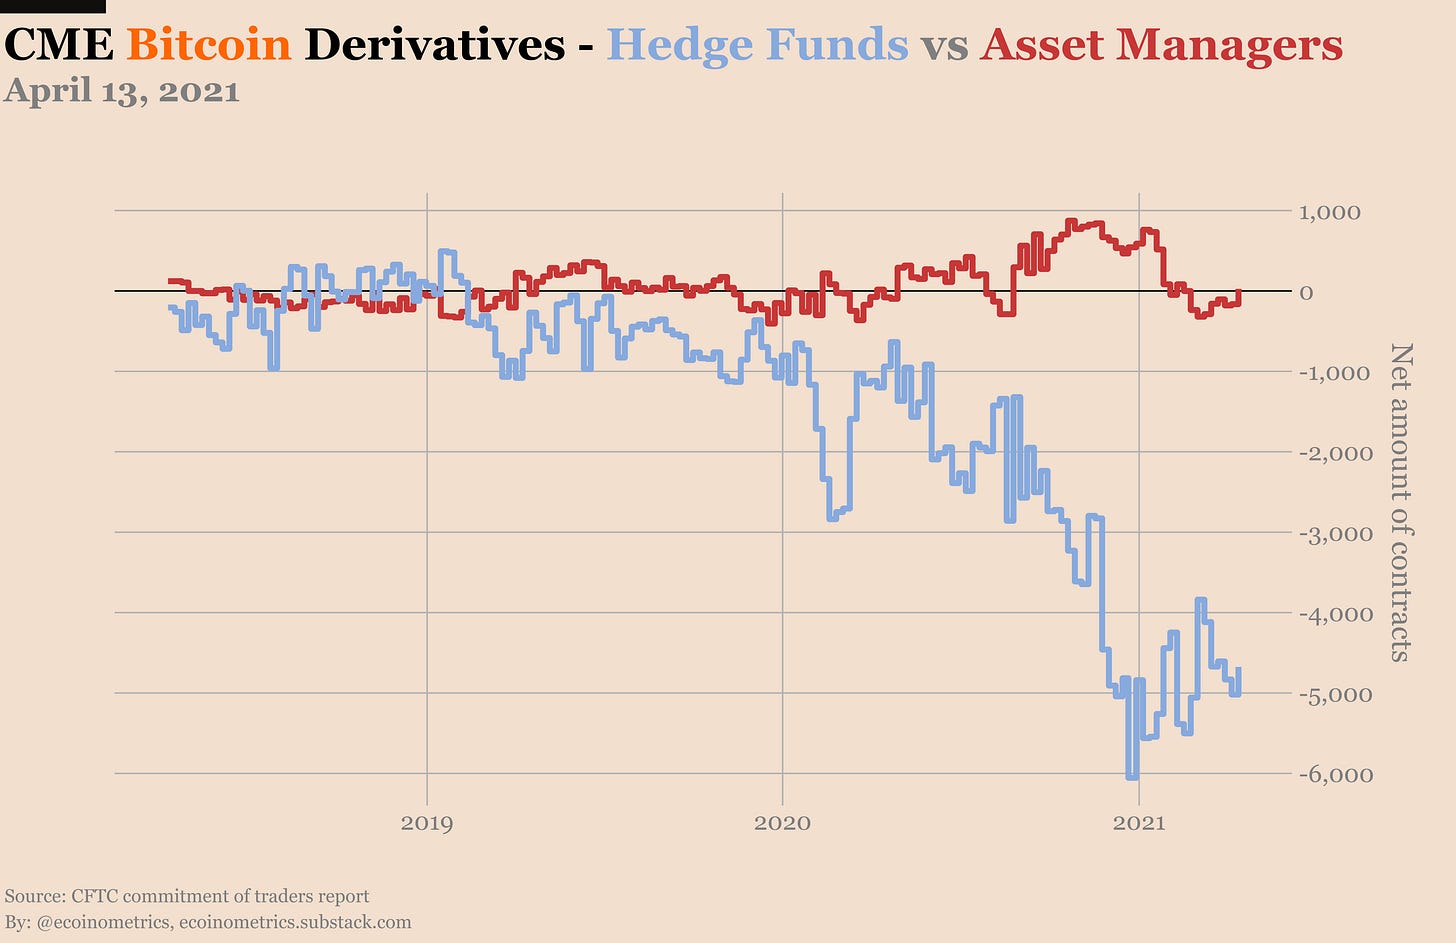
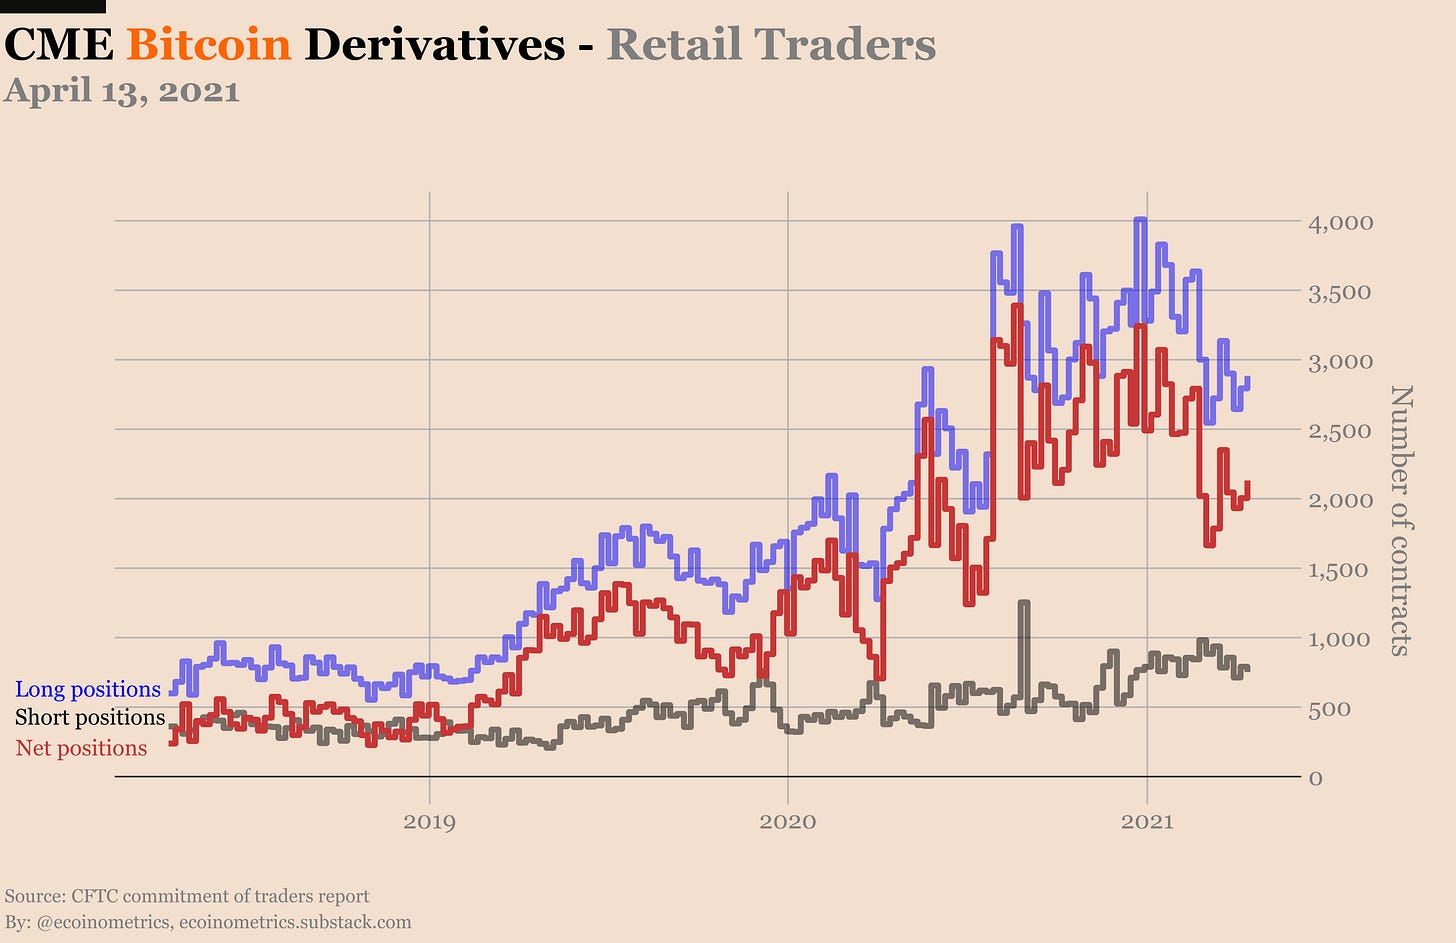
Except for that nothing is going on in the futures. The open interest is stuck on a plateau and there is no significant change in the positions reported by the Commitment of Traders report.
See for yourself.
That’s it for today. If you have learned something please subscribe and share to help the newsletter grow.
Cheers,
Nick
The Ecoinometrics newsletter decrypts Bitcoin’s place in the global financial system. If you want to get an edge in understanding the future of finance you only have to do two things:
Click on the subscribe button right below.
Done? That’s great!


Thank you!!
Thanks for another great letter