


Ecoinometrics - April 28, 2021
Commodities bull market...

What do copper, lumber and soybean have in common? Those three are the most expensive they have been in the past 10 years.
But they aren’t the only one. Welcome to a commodities bull market.
The Ecoinometrics newsletter decrypts Bitcoin’s place in the global financial system. If you want to get an edge in understanding the future of finance you only have to do two things:
Click on the subscribe button right below.
Done? That’s great! Now let’s dive in.
Commodities bull market
If you aren’t new around here then you’ll have noticed that, thanks to the action of the central banks, we’ve experienced a strong phenomenon of asset price inflation since at least 2008.
That’s the price to pay when a large part of the almost $8 trillion on the balance sheet of the Federal Reserve flows towards the financial sector.
But asset price inflation isn’t something most people are afraid of. If the average citizen can’t afford to get their hands on a house or some tech stocks that sucks for them but Jay Powell is not going to lose any sleep over it.
If things from day to day life start getting more expensive though then we might have a problem.
And that’s why keeping an eye on the price of commodities isn’t a bad idea. As “raw materials” if they get more expensive chances are the finished product could follow suit.
This is not something guaranteed. Everyone along the chain might decide to take smaller margins in order to reduce the impact on the consumer. But with enough businesses already struggling they might as well pass on the costs to you and I.
So where are we standing right now?
Let’s take a bird’s eye view of the situation.
Below you can see the evolution of the price of a selection of commodities (plus Bitcoin) across different sectors over the past 10 years.
Almost everywhere there is a clear trend that starts in 2020. Check it out.

Copper, corn, gold, pigs, lumber, palladium, soybean… all of these are at or close to their 10 years high in price.
Coffee, cotton, crude oil, gasoline, cattle, platinum, silver, sugar and wheat are also trending up. And while they aren’t at their 10 years high, they are definitely at their 5 years high.
Why are we seeing that?
While there are some specifics to each commodity, a combination of under investments in production, supply chain disruption and a weaker US dollar against emerging markets is driving the main trend.
So unless you think the Fed will stop monetizing the debt tomorrow and the world will be out of the pandemic in no time, then you can bet on sustained elevated prices for a while.
And the longer it lasts the bigger the risk of headline inflation.
This is good for Bitcoin...
Talking about Bitcoin, here is a question for you: Bitcoin versus a commodities bull market, who would win?
Since you are reading this newsletter I guess you know the answer. So far it is Bitcoin of course.
If you focus on the first quarter of 2021, BTC ends up ahead although it is closer than you might think thanks to the correction of the past two weeks.

But if you zoom out and start the comparison from the beginning of 2020 then Bitcoin is head and shoulders above the rest. Honourable mention for lumber though.
See for yourself.

So it isn’t a bad idea to bet on commodities trending higher. But Bitcoin still has a 5x potential upside that should play out this year and you are unlikely to find this asymmetric potential anywhere else.
CME Bitcoin Derivatives
There are only a few days to go until the expiration of the April contract and honestly this is business as usual on the CME Bitcoin derivatives markets.
Take the futures.
Even with the relatively large correction of last week the volume is staying well below the record of 150k BTC equivalents that traded in a single day.
Notice that the open interest is also trending down since the start of the year. I mean the open interest expressed in BTC is trending down. The open interest expressed in US$ is doing fine.
My guess is that it probably means there aren’t many additional new players entering the market. I would expect that if fresh cash came in, the number of open contracts would at least maintain a plateau. But nope, that’s not what we see.

The rollover is playing out as expected. Check out where we stand on the heat map.

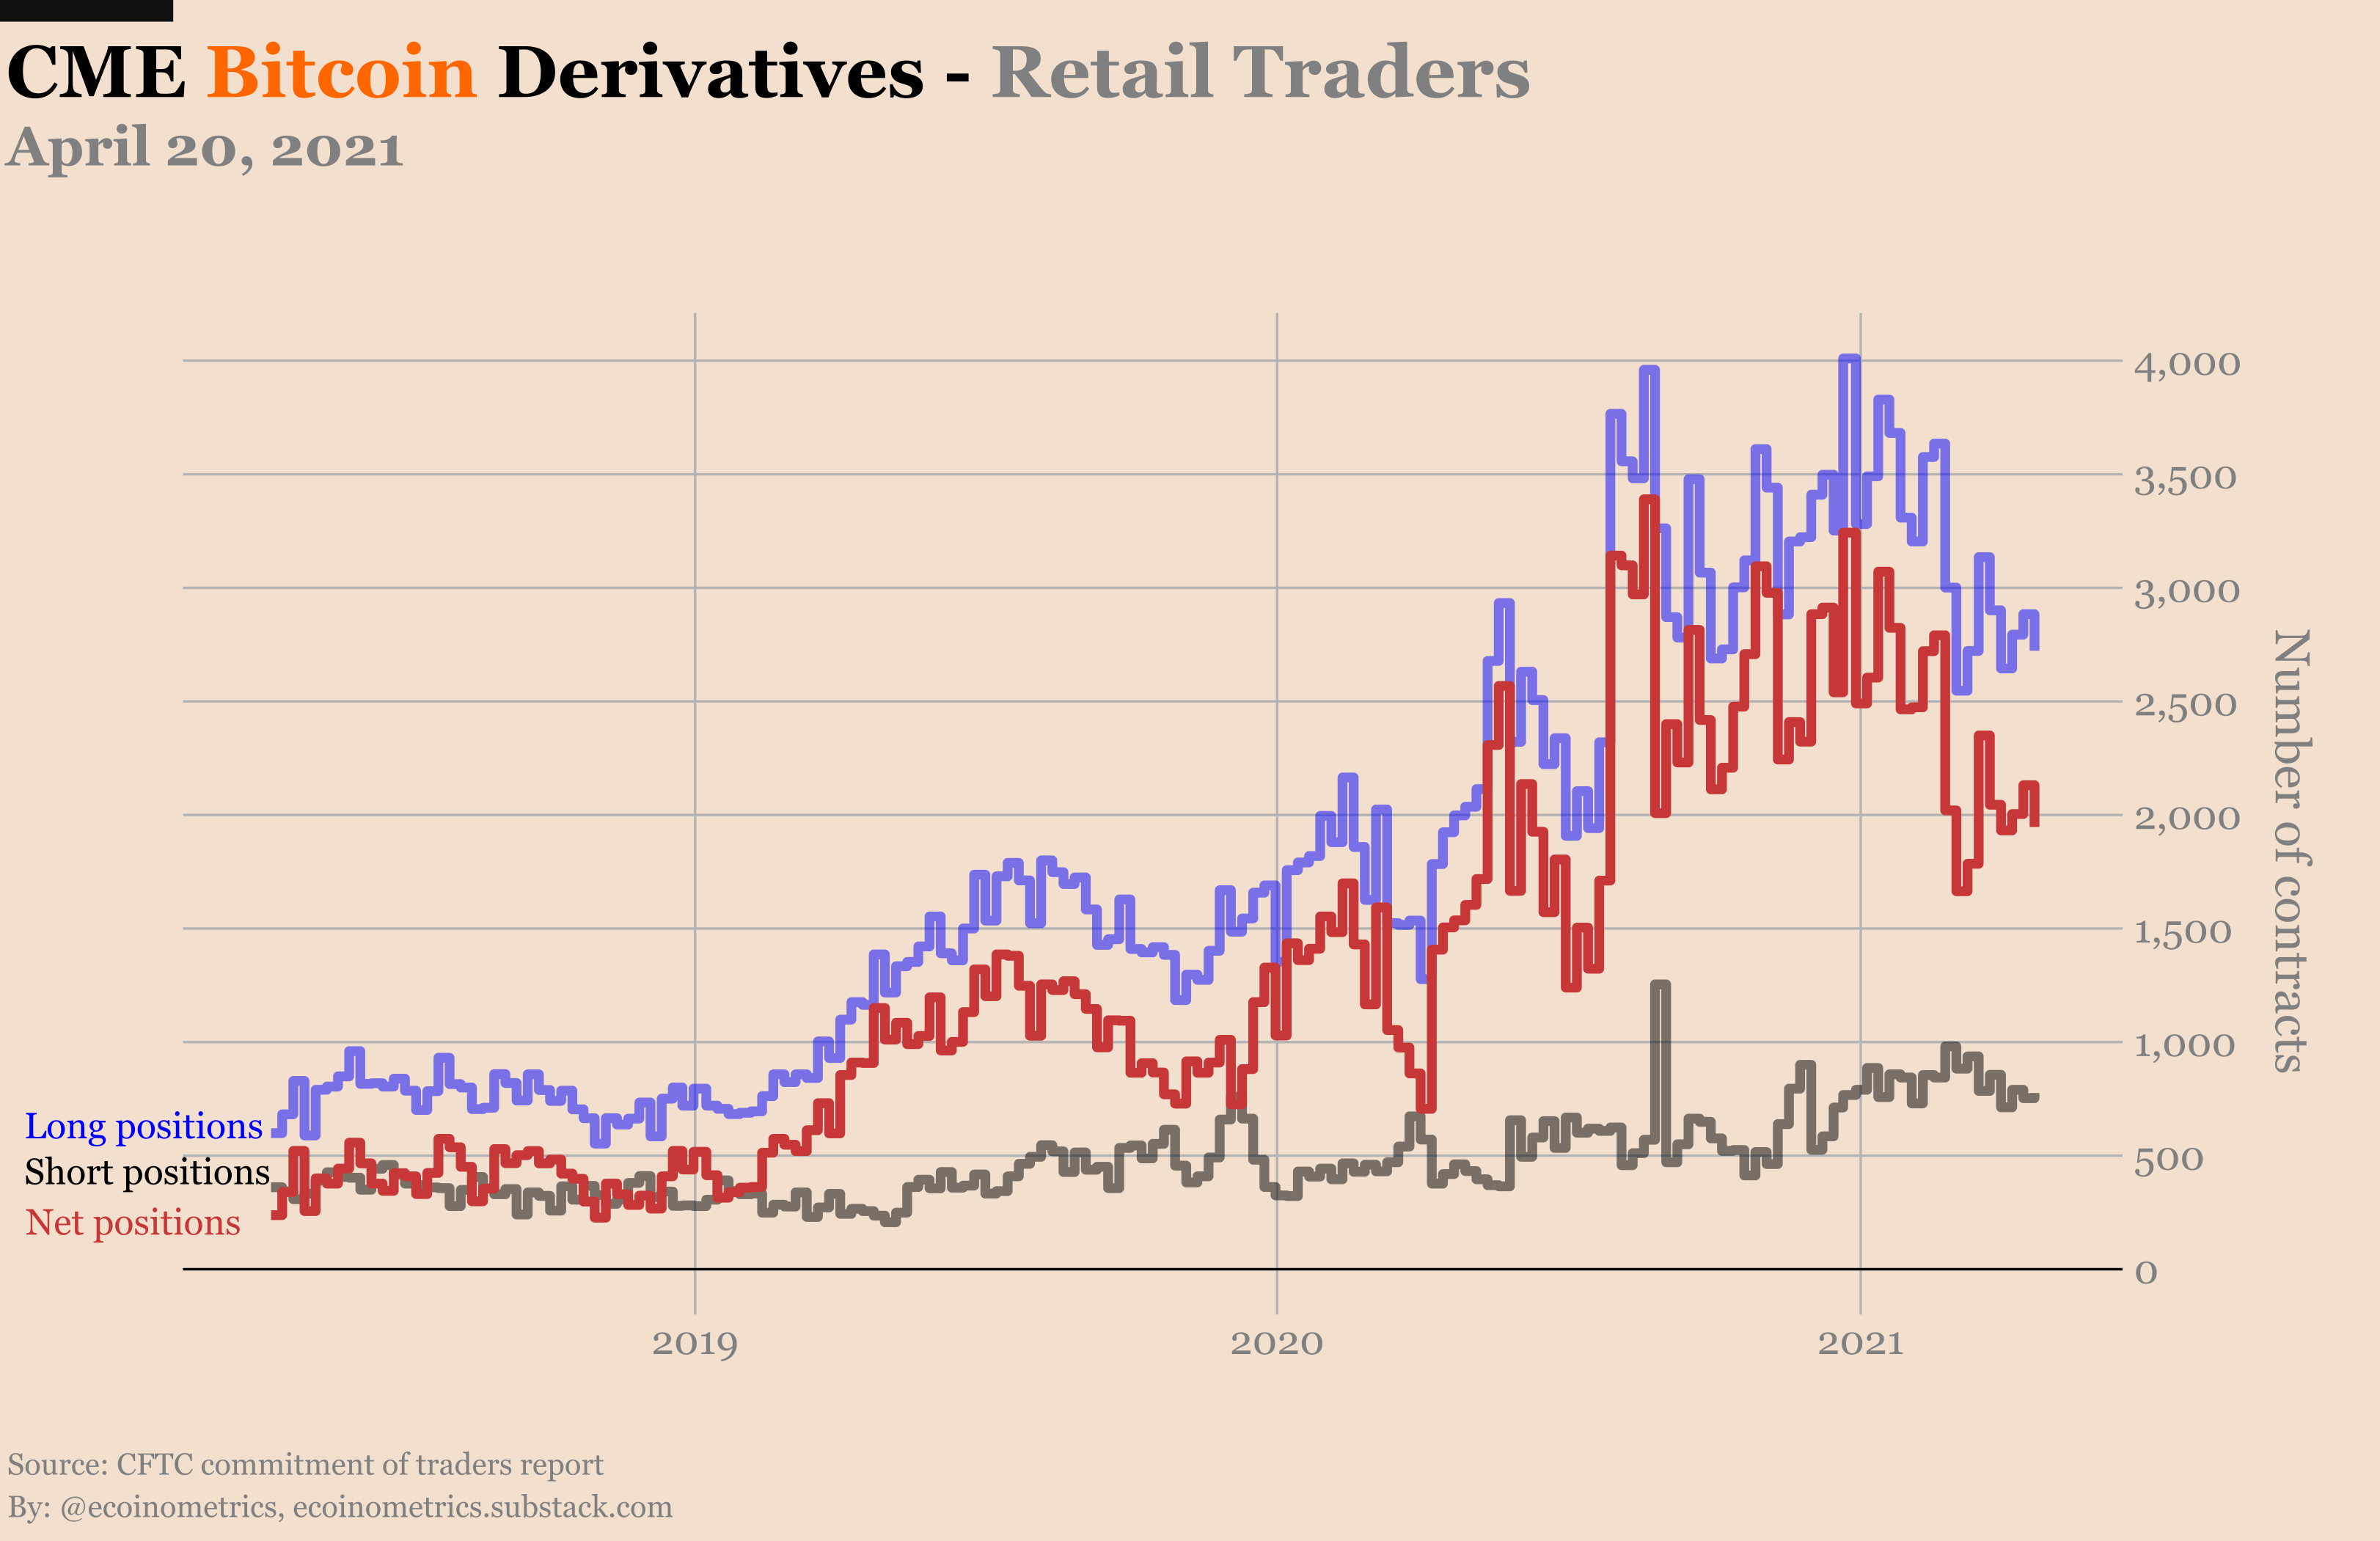
We have the latest Commitment of Traders data which is dated April 20. So this data is after the first drop of BTC to $51k (April 17) but before the low at $47k (April 25).
Apparently this drawdown is leaving the CME traders pretty much unfazed:
Retail traders did not liquidate a massive amount of long positions.
The smart money deleveraged a little on the basis trade (short positions) but nothing significant.
See for yourself.


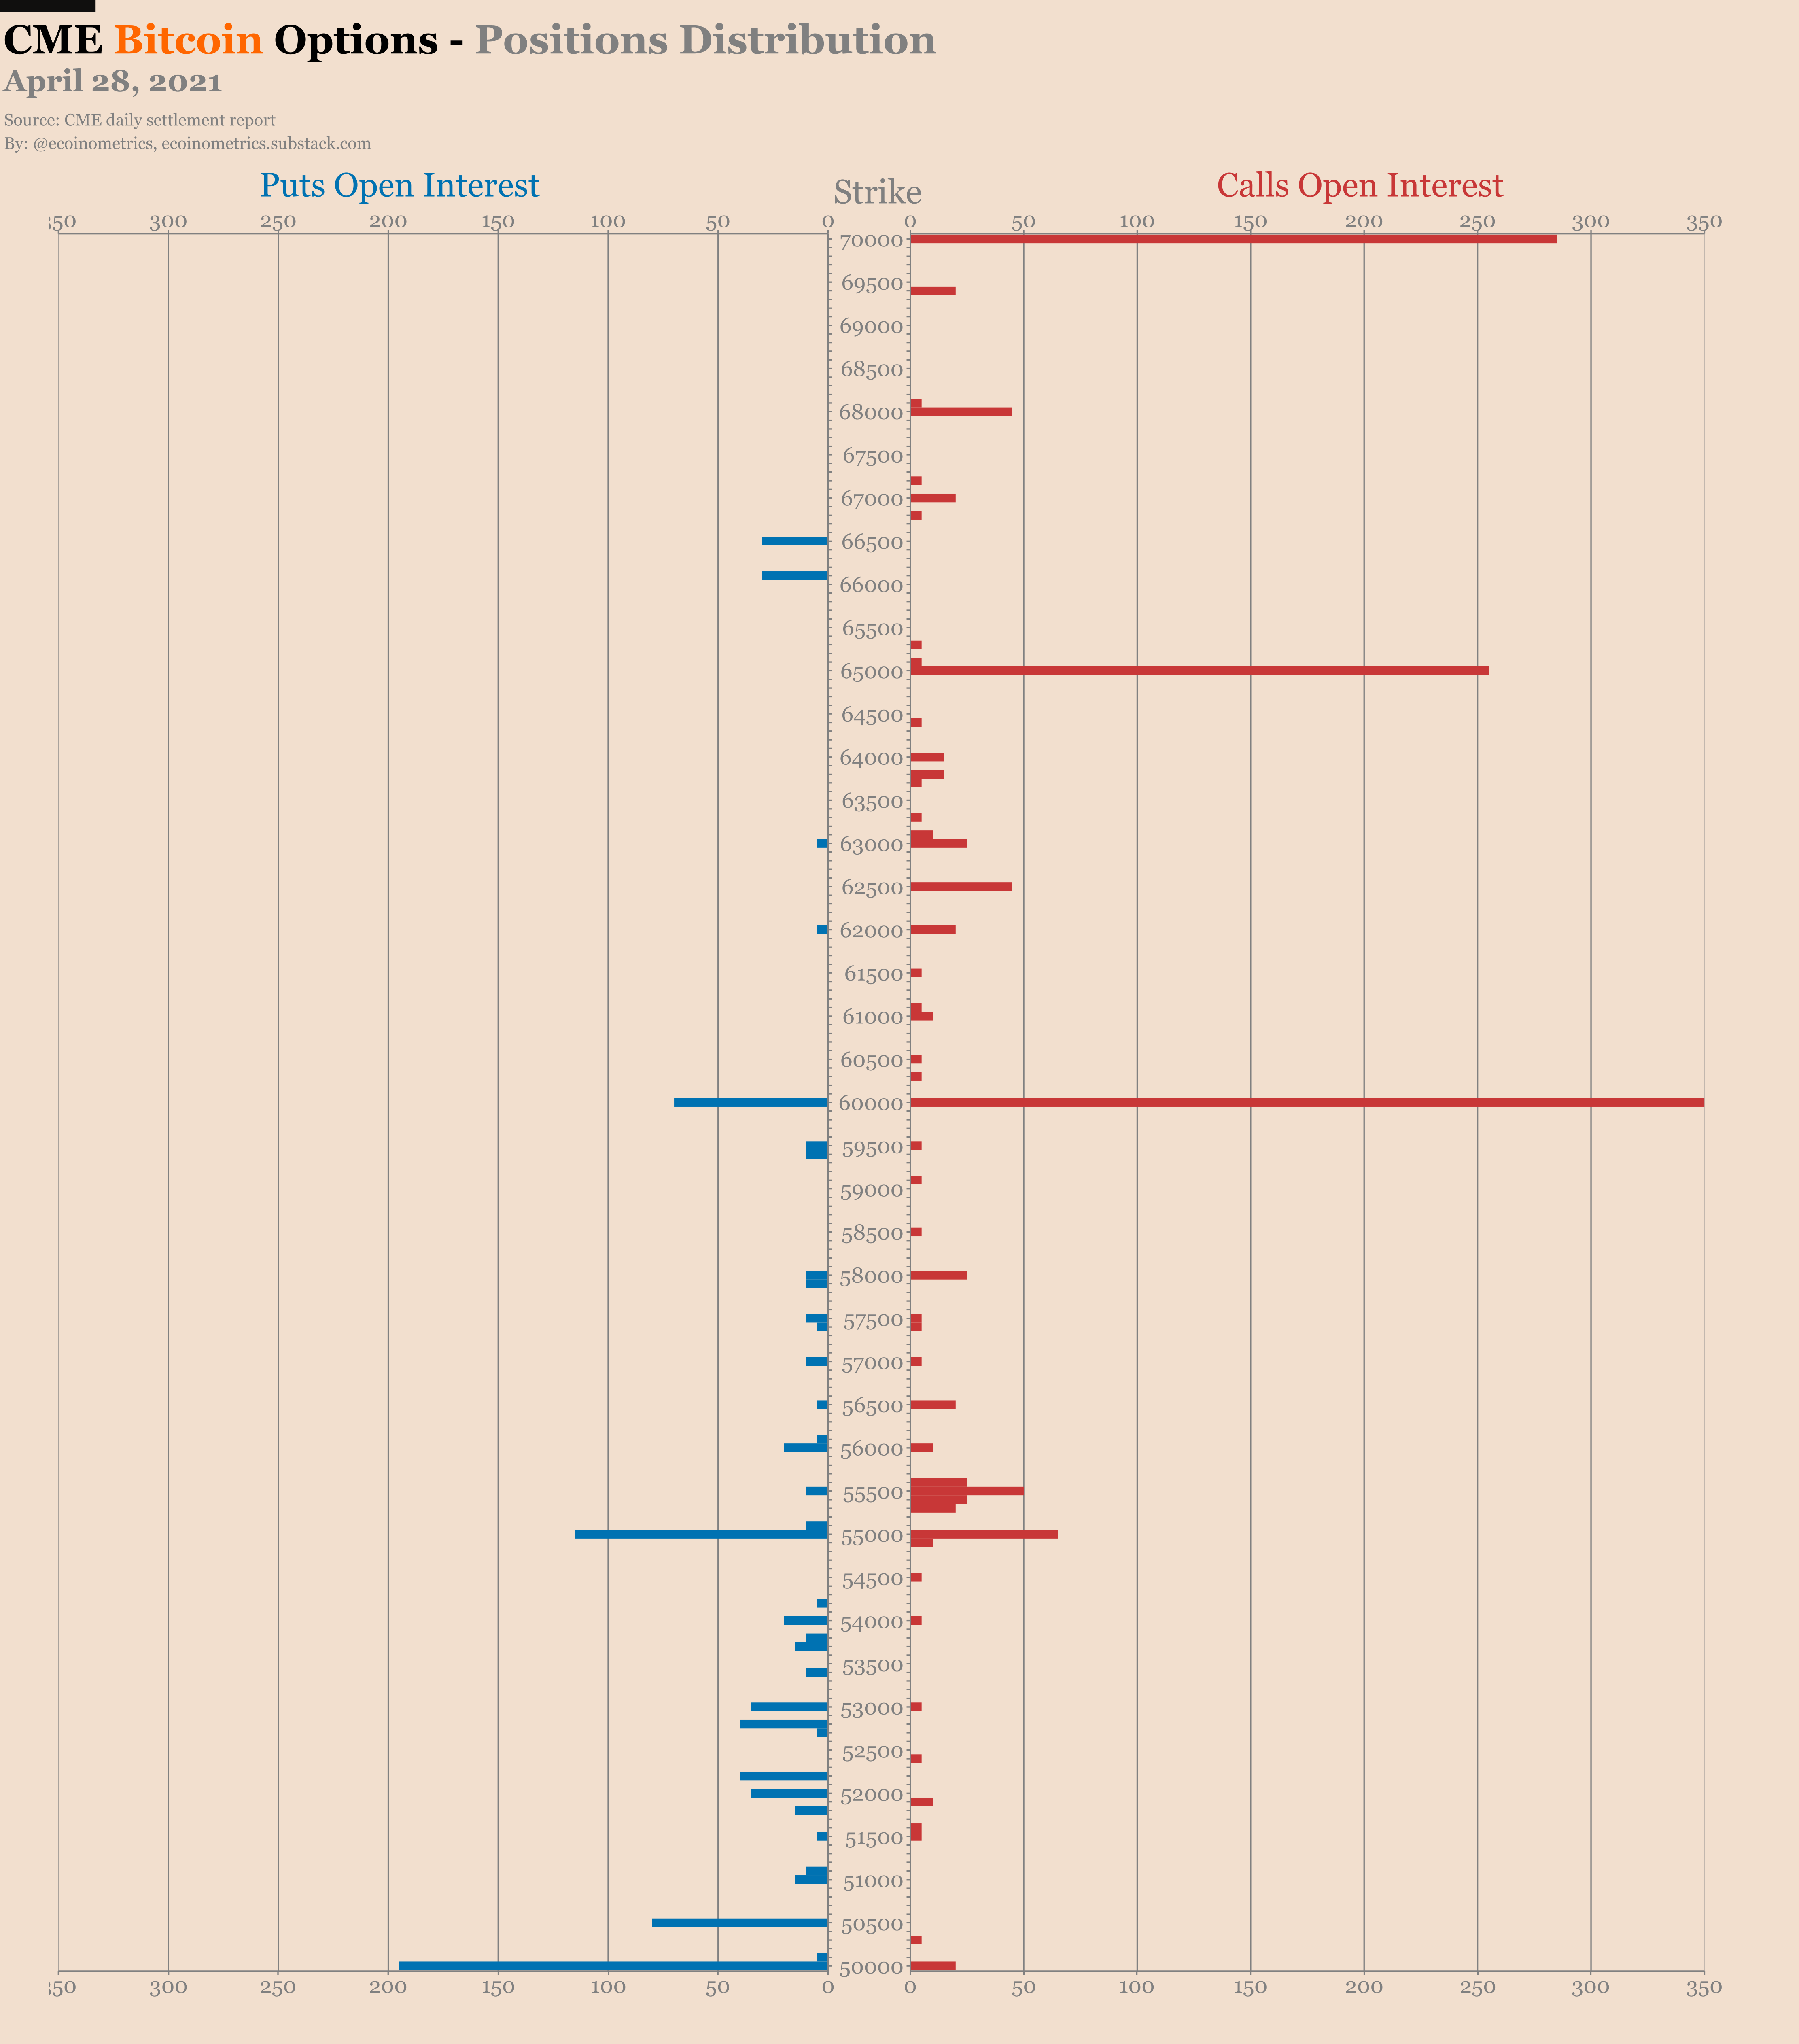
If you read this section every week you know that I’ve been pessimistic regarding the future of the CME Bitcoin options market. I might even have suggested that it could end up the same way as the Bakkt options market.
Now, while I still think liquidity looks low, the options market has some respite thanks to a certain amount of fear in the air. Traders are buying what looks like protective puts right now but that might not last if we get a new leg up in the Bitcoin bull market.

Some stats for the final days of the April contract:
43% of the contracts are due to expire on Friday.
Currently only 7% of the calls are in the money.
But 24% of the puts are in the money.
That’s a much more balanced market than we are used to.
That’s it for today. If you have learned something please subscribe and share to help the newsletter grow.
Cheers,
Nick
The Ecoinometrics newsletter decrypts Bitcoin’s place in the global financial system. If you want to get an edge in understanding the future of finance you only have to do two things:
Click on the subscribe button right below.
Done? That’s great!