Ecoinometrics - August 19, 2020
Market cap...
Here is a question I’ve seen a few times in the past couple of weeks: can Bitcoin really 10x or 100x from the current price? To answer this question you need to put the numbers in context.
The Ecoinometrics newsletter decrypts Bitcoin’s place in the global financial system. If you want to get an edge in understanding the future of finance you only have to do two things:
Click on the subscribe button right below.
Follow Ecoinometrics on Twitter at https://twitter.com/ecoinometrics.
Done? That’s great! Thank you and enjoy.
A few weeks ago I started tracking the price trajectory of Bitcoin during this cycle compared to the previous two halvings.
As a refresher here is what you see on the chart as of yesterday:
The starting point is the price of Bitcoin right after the 3rd halving.
The blue band is the range of growth you expect based on the previous two halvings.
The top of the band is applying the growth of the first halving.
The bottom of the bad is applying the growth of the second halving.
As a reference the dark blue line is applying the growth that is the average of the previous two halvings.
The actual price is in orange.

So far the price trajectory is within the range of expected growth albeit on the low range.
But from the feedback I get people have been focusing on the red dots.
However you slice it, if Bitcoin continues to grow as it did during the last two halvings then one BTC could potentially be worth $40k, $100k or even $400k during this cycle.
And some people have been choking when they read those projections. Their reasoning goes like that: if one Bitcoin is worth more than $50k then its market cap is about $1 trillion. So if BTC is worth $400k then its market cap must be about $8 trillion.
The objection is then that this market cap is way too big to be realistic.
But is it really?
I don’t think so.
When you start thinking in terms of trillions of US$ it is best to put things in context. So let’s think of the price of Bitcoin in a different way.
How much must one BTC be worth for Bitcoin’s market cap to match the market cap of say JPMorgan, Gold, the whole US M2 money supply?
Check it out.

Currently Bitcoin is around $12,000 which puts it above the net worth of Jeff Bezos and within a stone’s throw of the market cap of JPMorgan.
Retaking the highs of 2017 will put Bitcoin market cap on an equal footing with Visa.
Doubling the high of 2017 will bring BTC to the market cap of Facebook. But still short of $1 trillion.
At this point Bitcoin would be around $40,000. If this cycle growth follows the average path we will be there at the end year. If we follow a slower growth we might need to wait a full year from now to reach this value.
Next stop is $100,000. This would make Bitcoin as valuable as Apple for a $2 trillion market cap. And this is the target value for BTC during this cycle as per PlanB stock-to-flow model.
Should Bitcoin be as least as valuable as Apple? I’ll let you be the judge. But if you think of Bitcoin as a global store of value then it should be.
And as a store of value it should tend to a market cap similar to gold. For that to happen one Bitcoin would be worth $487,000.
That’s really the top of the range in terms of expected growth for this halving cycle. But again if you think of Bitcoin as a global store of value then a market cap on par with the value stored in gold today is the goal.
So are these target values $40k, $100k or even $400k unrealistic. Definitely not. The timeline for $400k, which is basically Bitcoin replacing gold, is unknown.
But taking Bitcoin to the level of Apple is certainly doable. That’s a 10x growth from now.
The shift from gold to Bitcoin as a global store of value will likely require another kind of market dynamic. One that involves the great wealth transfer from Boomers to Millennials which is expected to play out over the next decade.
But that’s a discussion for another day!
Now let’s take a look at the state of the CME derivatives market.
Some might be frustrated that BTC is not ripping straight through to $14,000 then $20,000 then… the moon I guess. But when you zoom out the positive momentum is still there.

Positive momentum and pretty large spreads that are trending above the 4 months average… apparently some traders on the CME are really bullish and ready to pay for it.

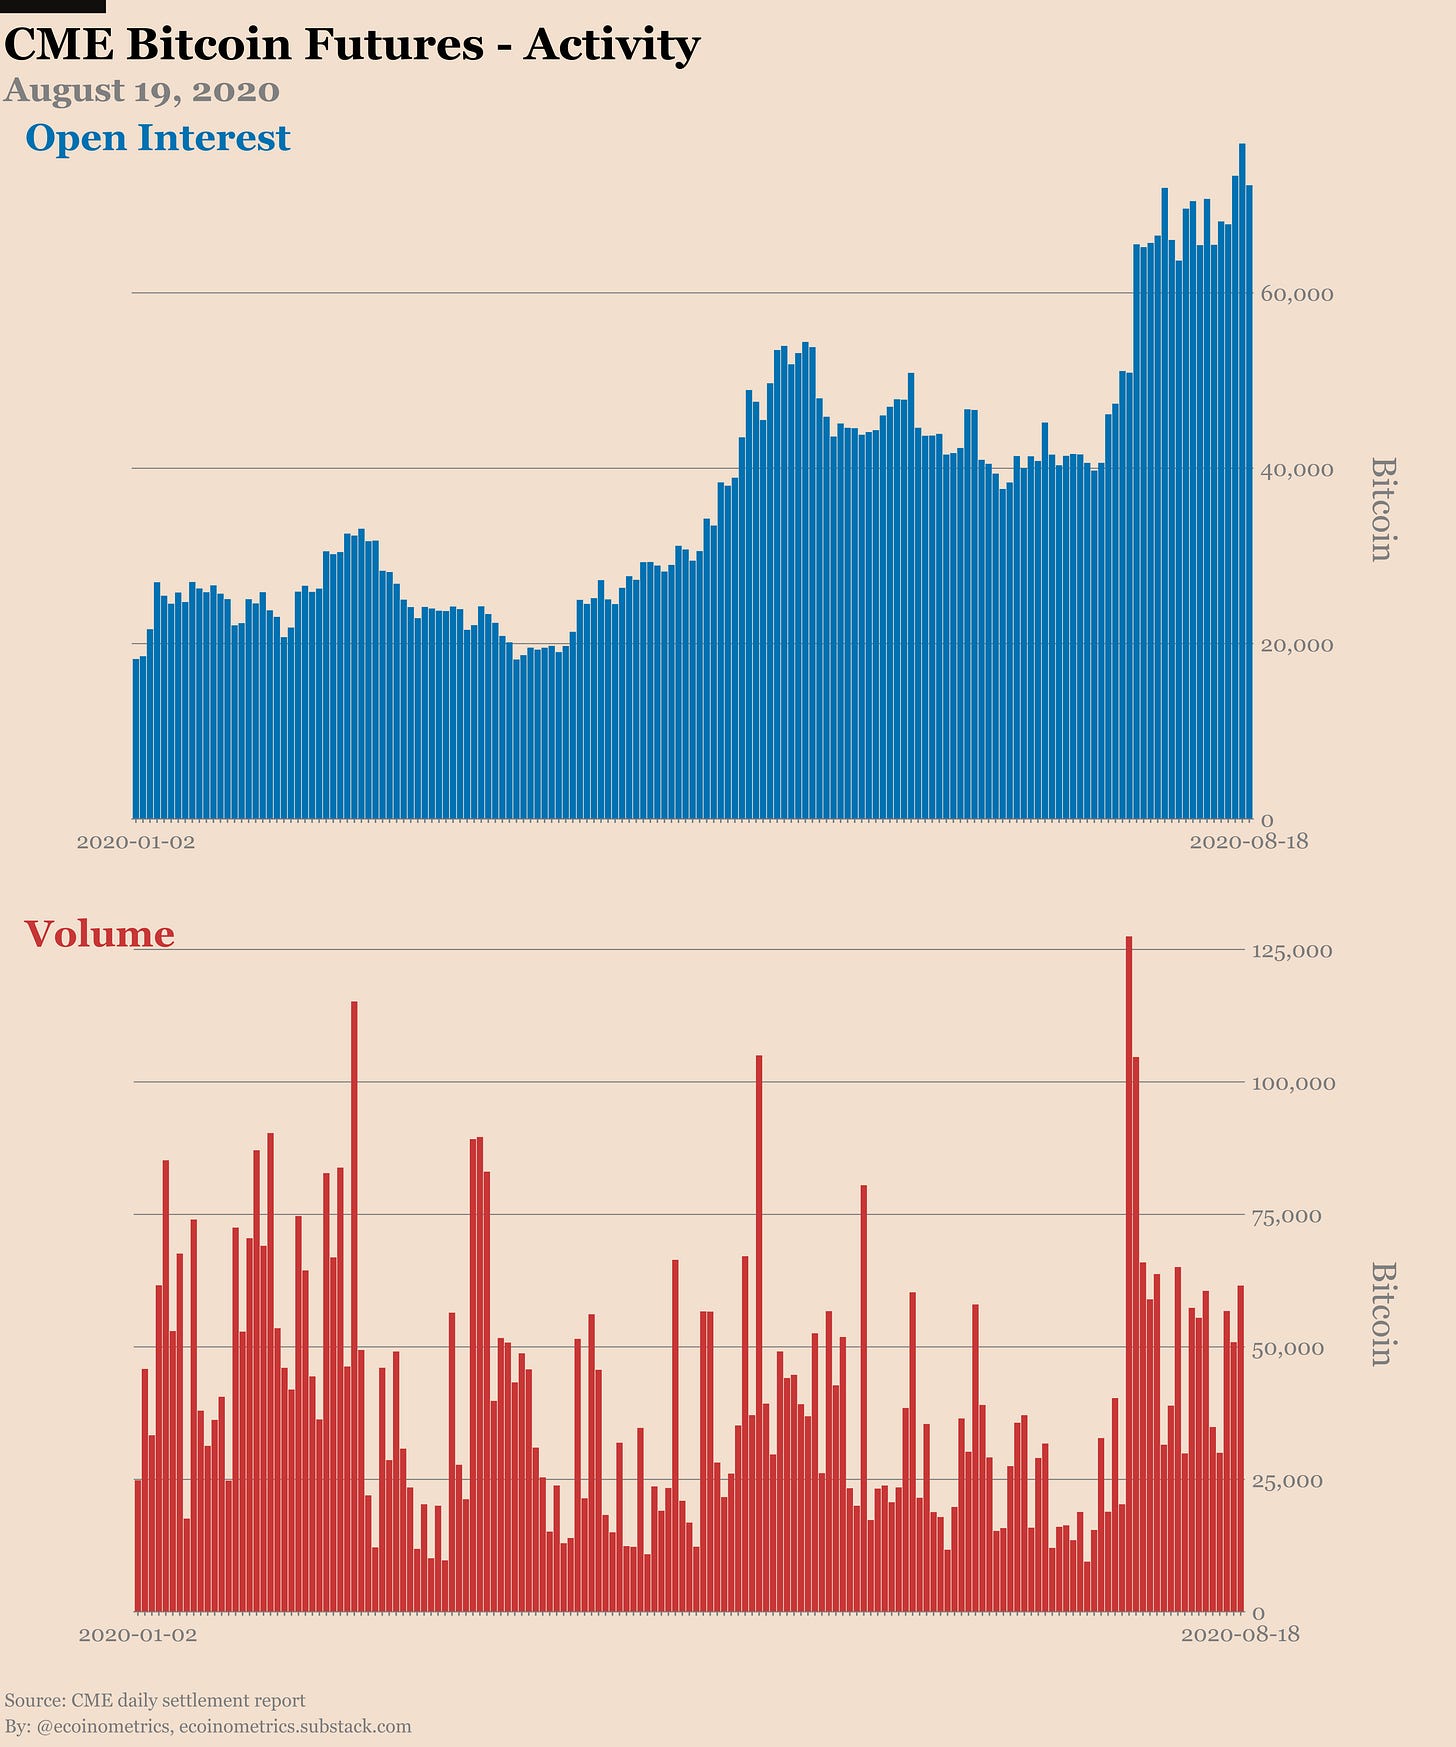
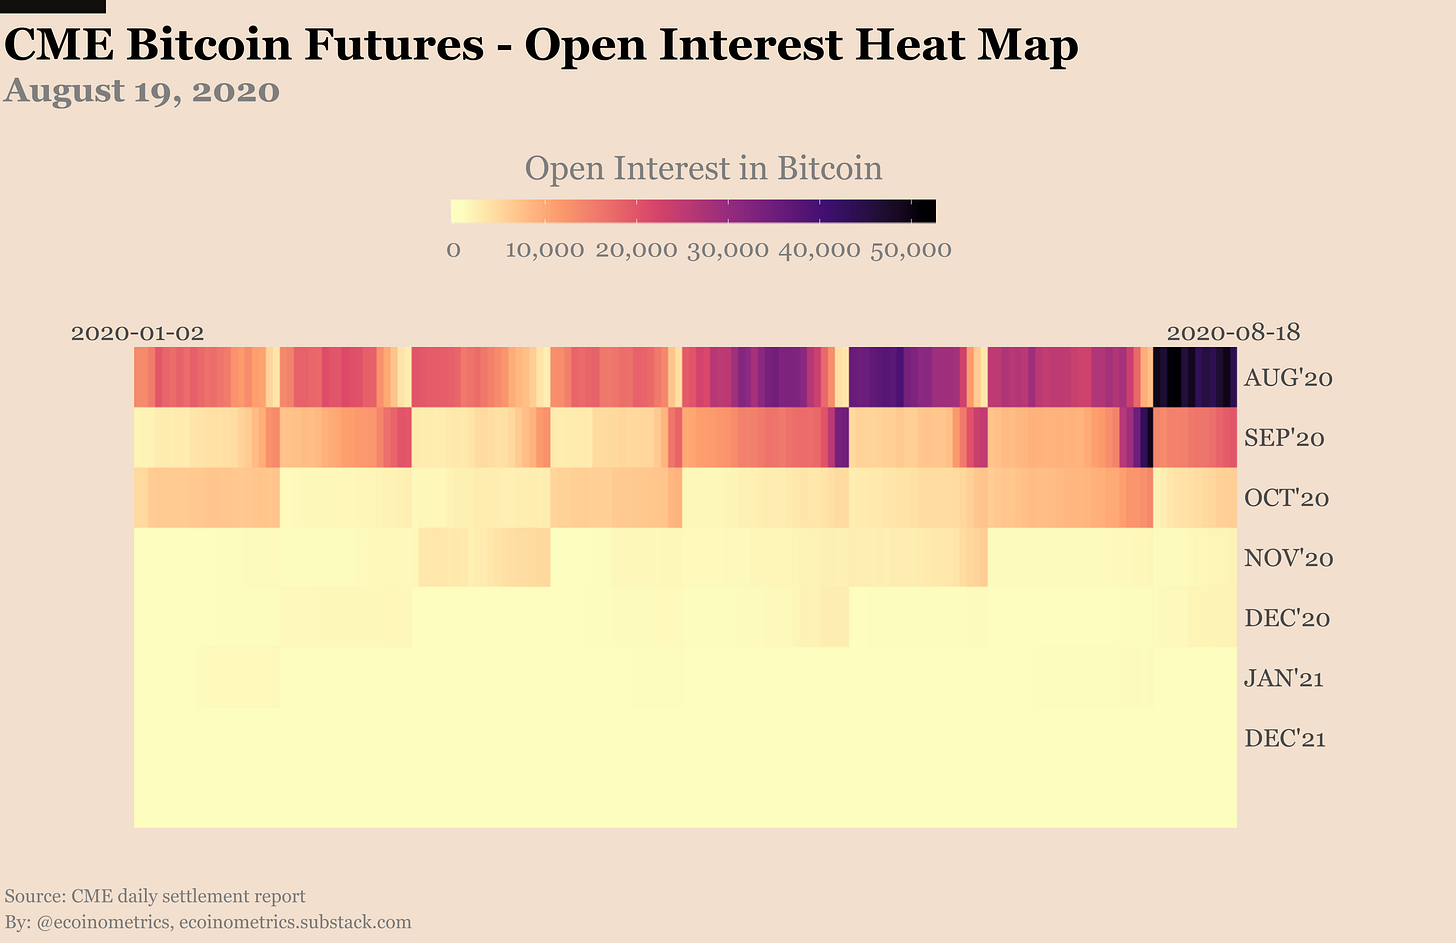
On the futures side of things we are seeing increased average volume and a new record in open interest every single week. This isn’t yet a full blown bull market but Bitcoin futures are already a hot commodity.


The story is different on the options side. On one hand the puts to calls ratio is much more balanced now with 5 calls for every 2 puts. On the other hand the traded volume is really drying up.
The past few days has seen less than 100 contracts changing hands on a daily basis. We can probably blame the quiet end of summer vacation for that. But let’s keep an eye on it.


The Commitment of Traders data from August 11 isn’t showing much changes since last week:
Retail traders are very much net long on the breakout.
The smart money is still net short around the same level with leveraged funds squeezing money out of the cash and carry trade.


The stars are aligned:
The central banks monetary policies are pushing hard assets higher.
Bitcoin is in its post halving growth phase.
The target growth of 10x for this cycle is reasonable based on market cap comparisons.
The general market sentiment feels bullish.
You don’t need to spend the day glued to your trading screen to profit from that, we talked about it last week. You only need to see the big picture and act on it.
Your move.
Nick
The Ecoinometrics newsletter decrypts Bitcoin’s place in the global financial system. If you want to get an edge in understanding the future of finance you only have to do two things:
Click on the subscribe button right below.
Follow Ecoinometrics on Twitter at https://twitter.com/ecoinometrics.
Done? That’s great! Thank you and enjoy.

