


Ecoinometrics - August 26, 2020
Don't let a good drawdown go to waste...

I guess for people who follow financial news but don’t hodl, Bitcoin is known for two things: high volatility and massive drawdowns.
Hodlers know better though. If you got yourself a 8,000% gain in less than a year surely you can live with giving 50% of that away.
But what if I told you that instead of being a problem, drawdowns could be an opportunity...
The Ecoinometrics newsletter decrypts Bitcoin’s place in the global financial system. If you want to get an edge in understanding the future of finance you only have to do two things:
Click on the subscribe button right below.
Follow Ecoinometrics on Twitter at https://twitter.com/ecoinometrics.
Done? That’s great! Thank you and enjoy.
Today I’m back preaching the value of understanding the long term cycles in Bitcoin.
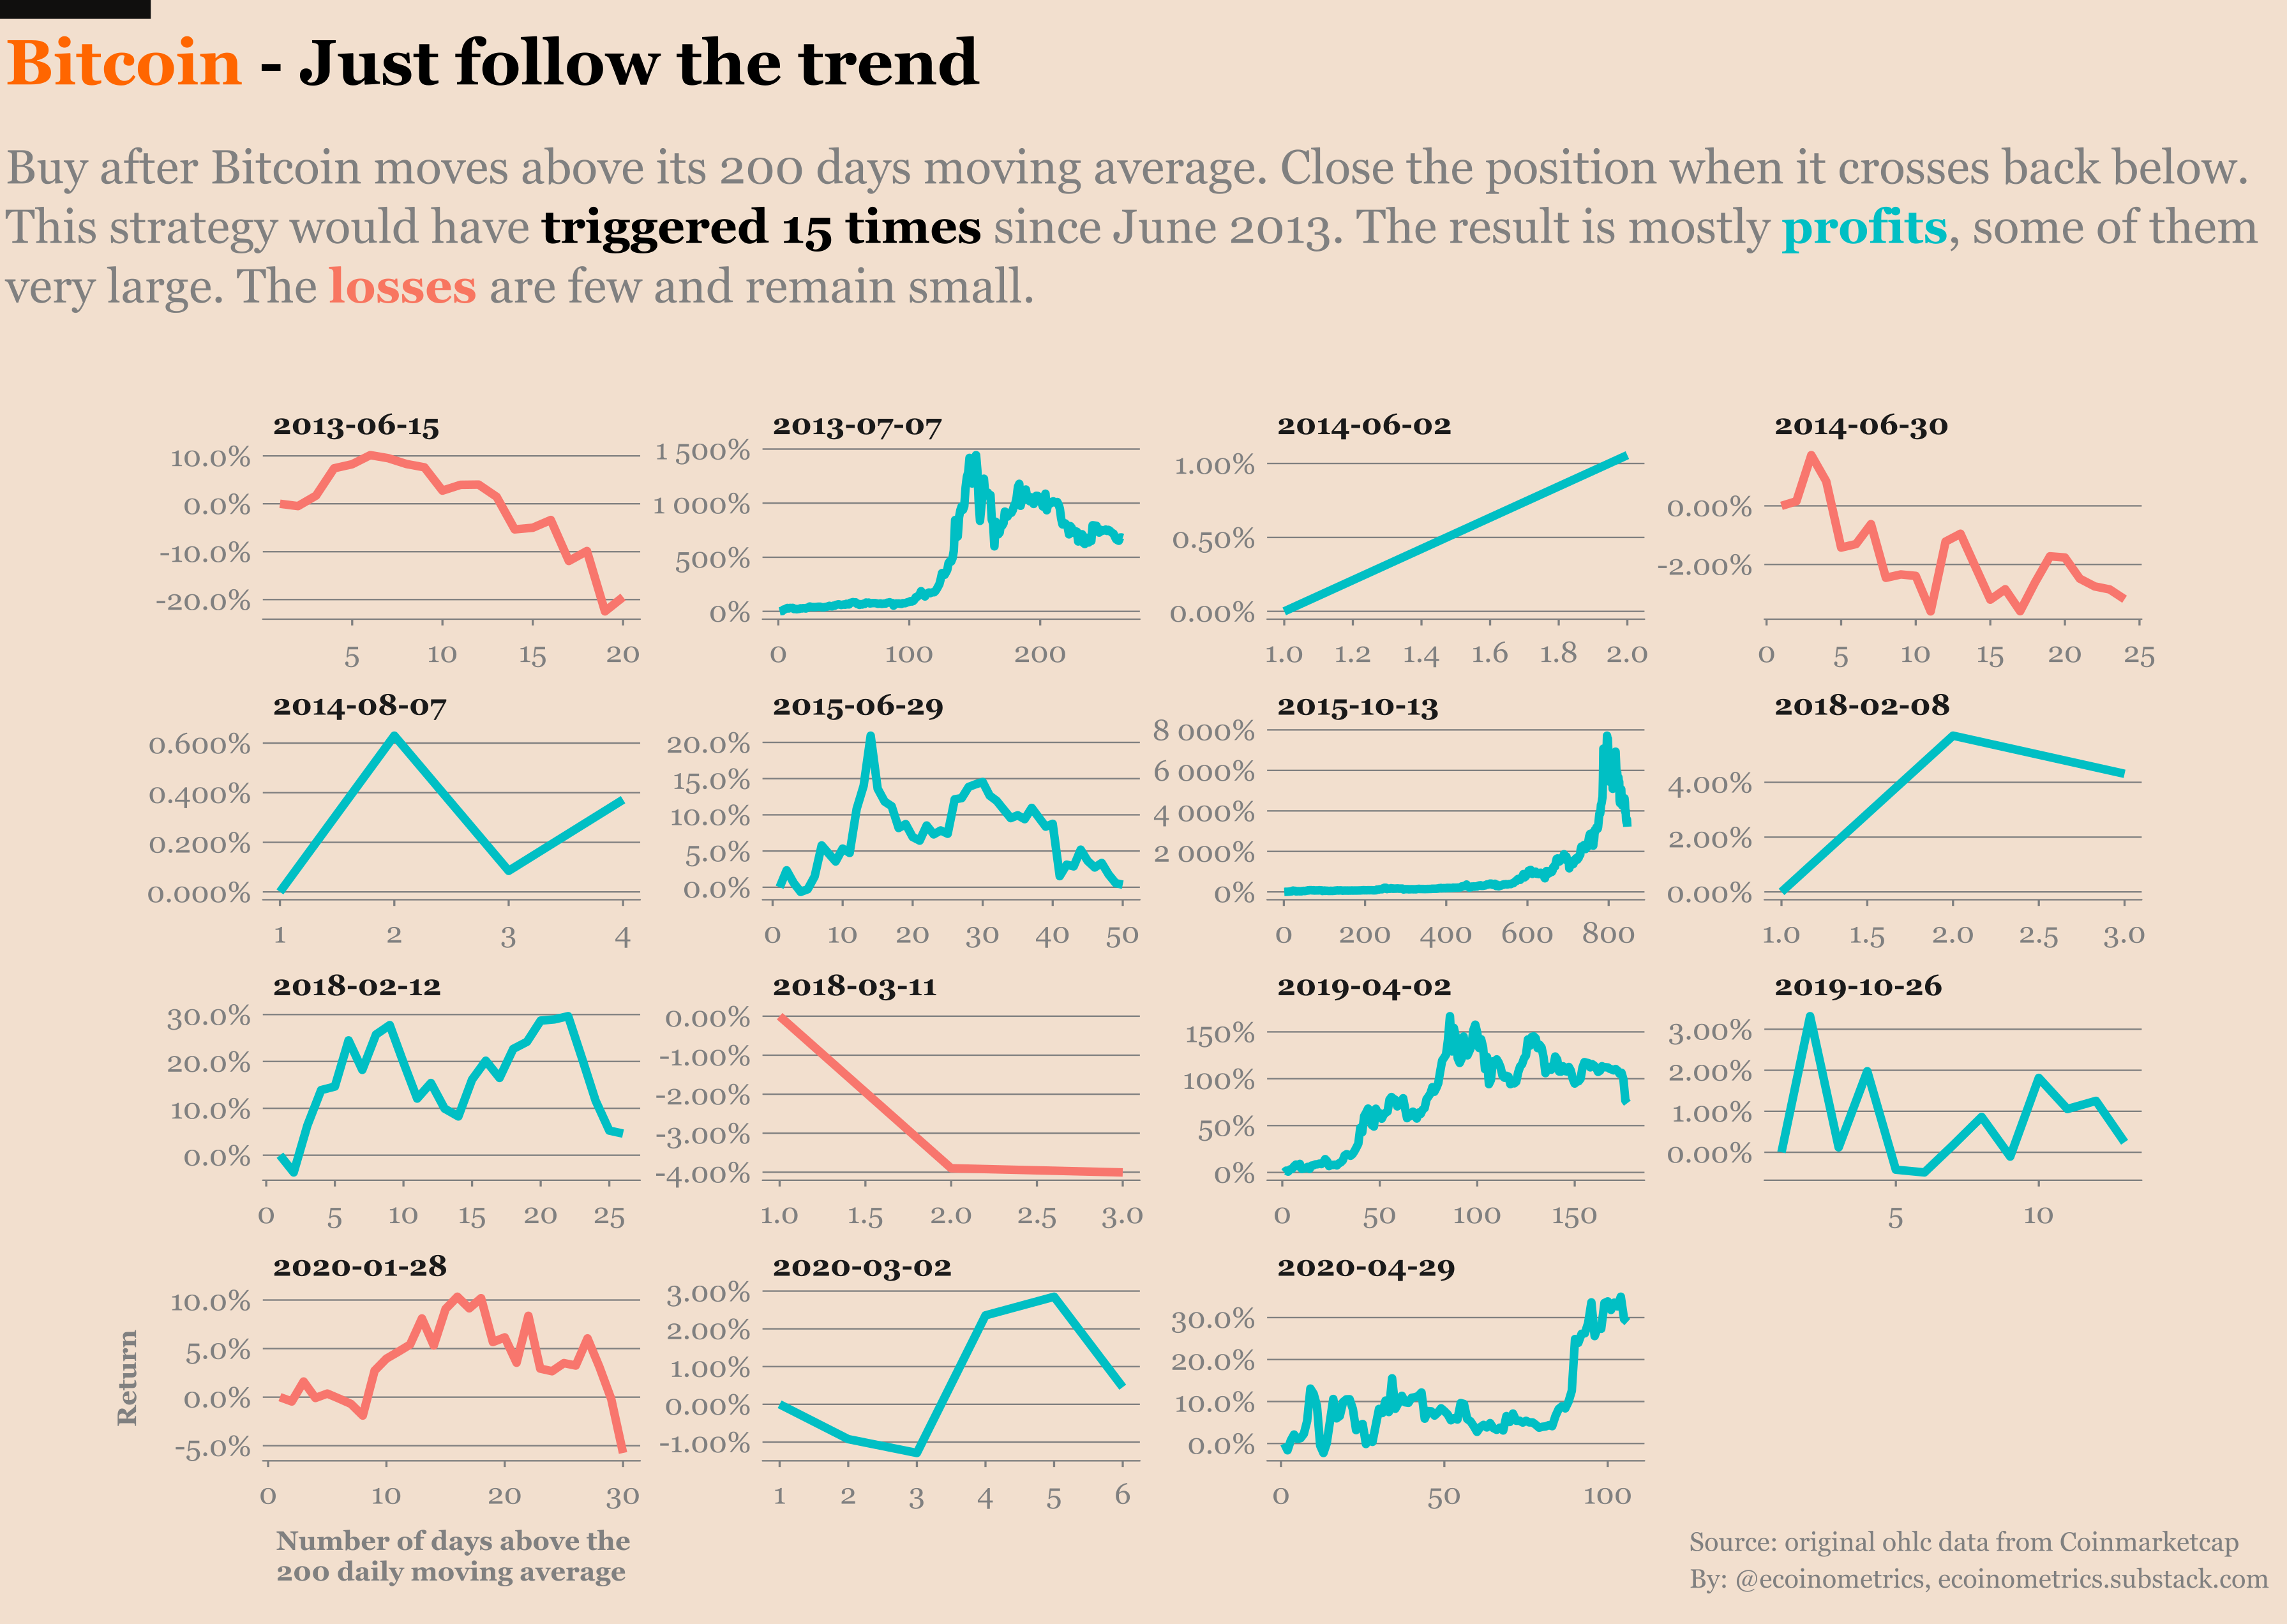
A few weeks ago we looked at how using a simple trend following strategy is an easy way to capture most of the upside in the Bitcoin halving cycles while keeping your losses small.
This week I want to focus on what happens in between those large moves i.e. the drawdown periods.
Assume that you aren’t trading Bitcoin. You are just hodling. You bought 1 BTC at the time of the 1st halving. That’s the entirety of your portfolio.
From the 1st halving you can keep track of every new all time high in the value of your Bitcoin. The periods in between those new all time highs when the price is coming down are the drawdowns in your portfolio.
There are 50 drawdown periods (of more than one day) after the first halving. I’ve tracked the maximum size of the dip for each of them in the graph below.
Check it out.
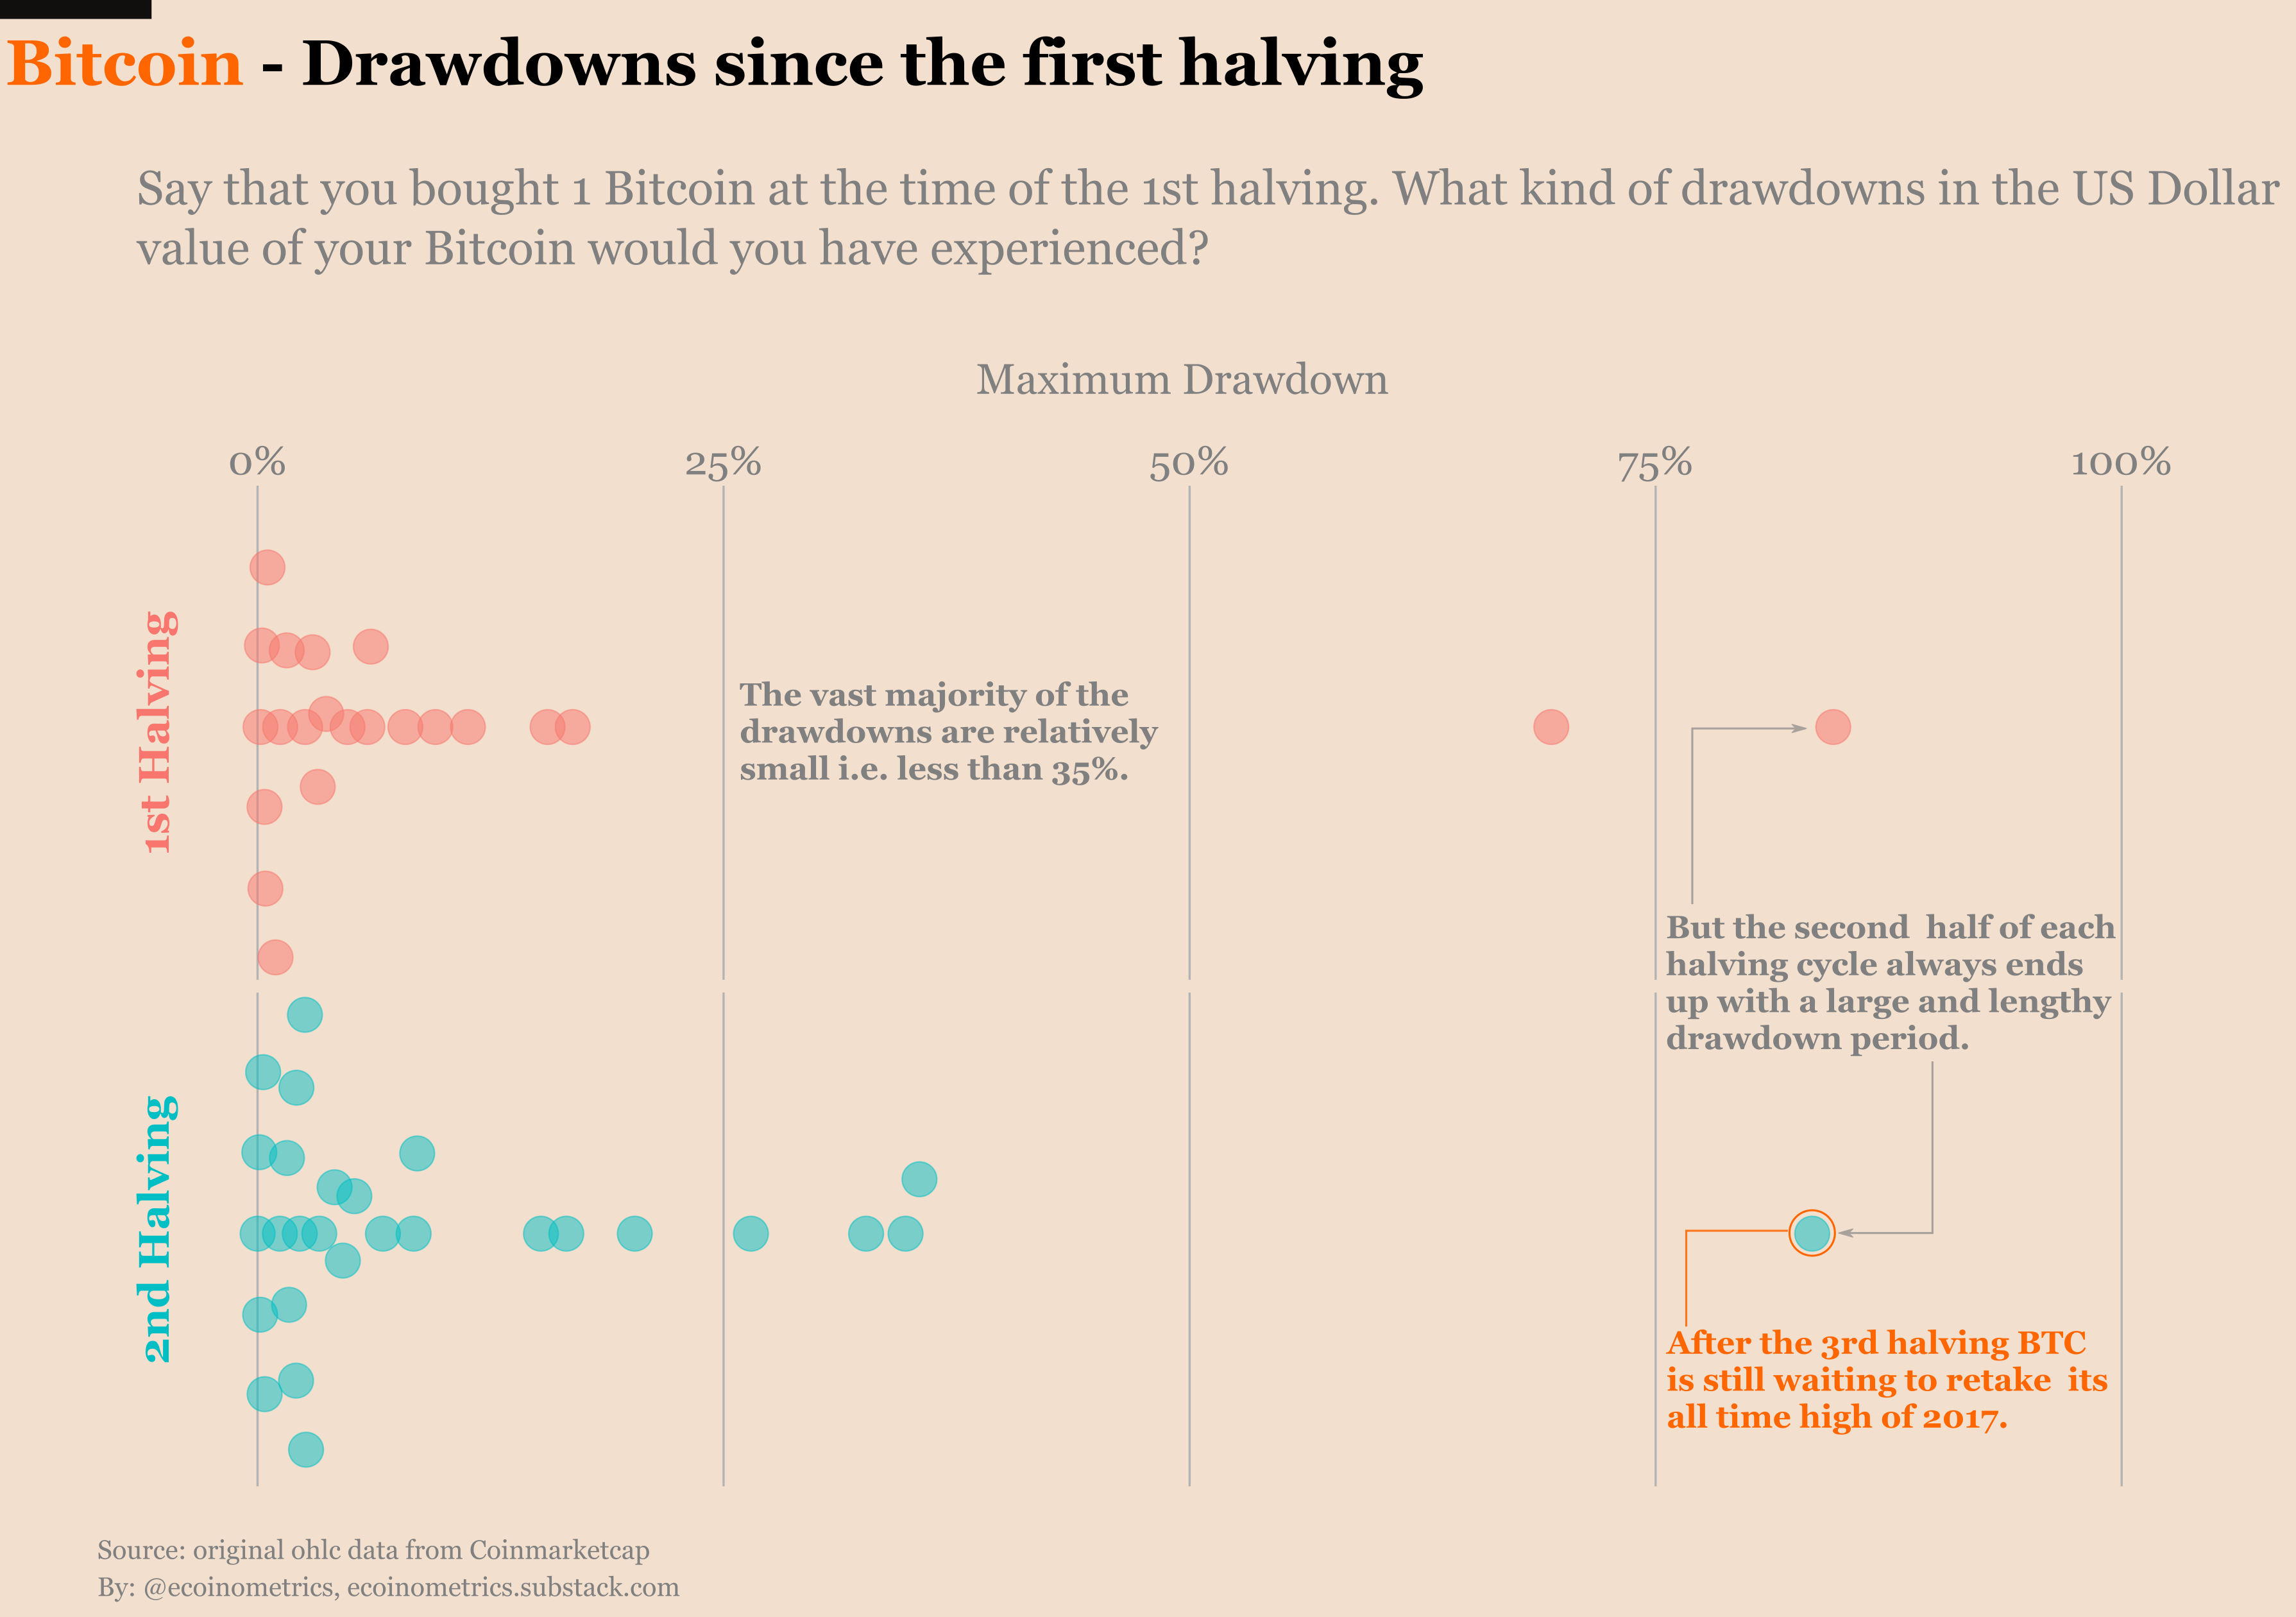
What do we see?
First of all those drawdowns are approximately equally divided between the 1st and the 2nd halving cycles.
Second, most of those drawdowns are relatively small. They rarely go past -35% from the all time high. And those small drawdowns tend to be short lived.
Finally, there are outliers. Massive drawdowns where Bitcoin lost 80% of its value from the peak.
Actually, right now, after the 3rd halving, we are still in the drawdown period that started from the peak of 2017 when Bitcoin had reached $20,000.
But let’s take a closer look.
Here are the details of all the drawdowns that lasted longer than 10 days since the 1st halving.

See what’s going on here?
Those large and lengthy drawdowns (more than 80% max loss from the peak, lasting several years) happen during the second phase of each halving cycle.
So what has happened in the past is that during the two years following a halving, Bitcoin will experience a phase of exponential growth.
But FOMO tends to push the price farther than it should in a reasonable timeframe. The result is a second half of the halving cycle dominated by an extended drawdown period until the next halving comes.
Then the cycle repeats.
How should that inform your trading strategy?
Well for once it means that you might not want to hodl all the way during a halving cycle.
Instead you might decide to take some profit if you see that the price is already up 10x and is on the way down from the top by more than say 35%.
Then you can use those profits to accumulate more Bitcoin by dollar cost averaging during the drawdown until the next halving happens.
That’s something that would play nicely as a complement to the simple 200 days moving average trend following strategy.
If you don’t own any Bitcoin yet this also shows you why now is a good time to buy.
We are still in the drawdown period that ended the 2nd halving but the 3rd halving already happened 100 days ago.
So you are getting a good deal regardless. Don’t let a good drawdown go to waste!
Of course who knows if the same pattern will play out during the 3rd halving cycle. My point is that if you understand the market dynamic:
Quantitative tightening with the halving driving exponential growth...
FOMO pushing it too far...
Drawdown from the top starting to get unusually large…
…then you should be able to use this approach again if the opportunity is there.
If in doubt, you can always hodl or take only small profits from your positions. That’s up to you.
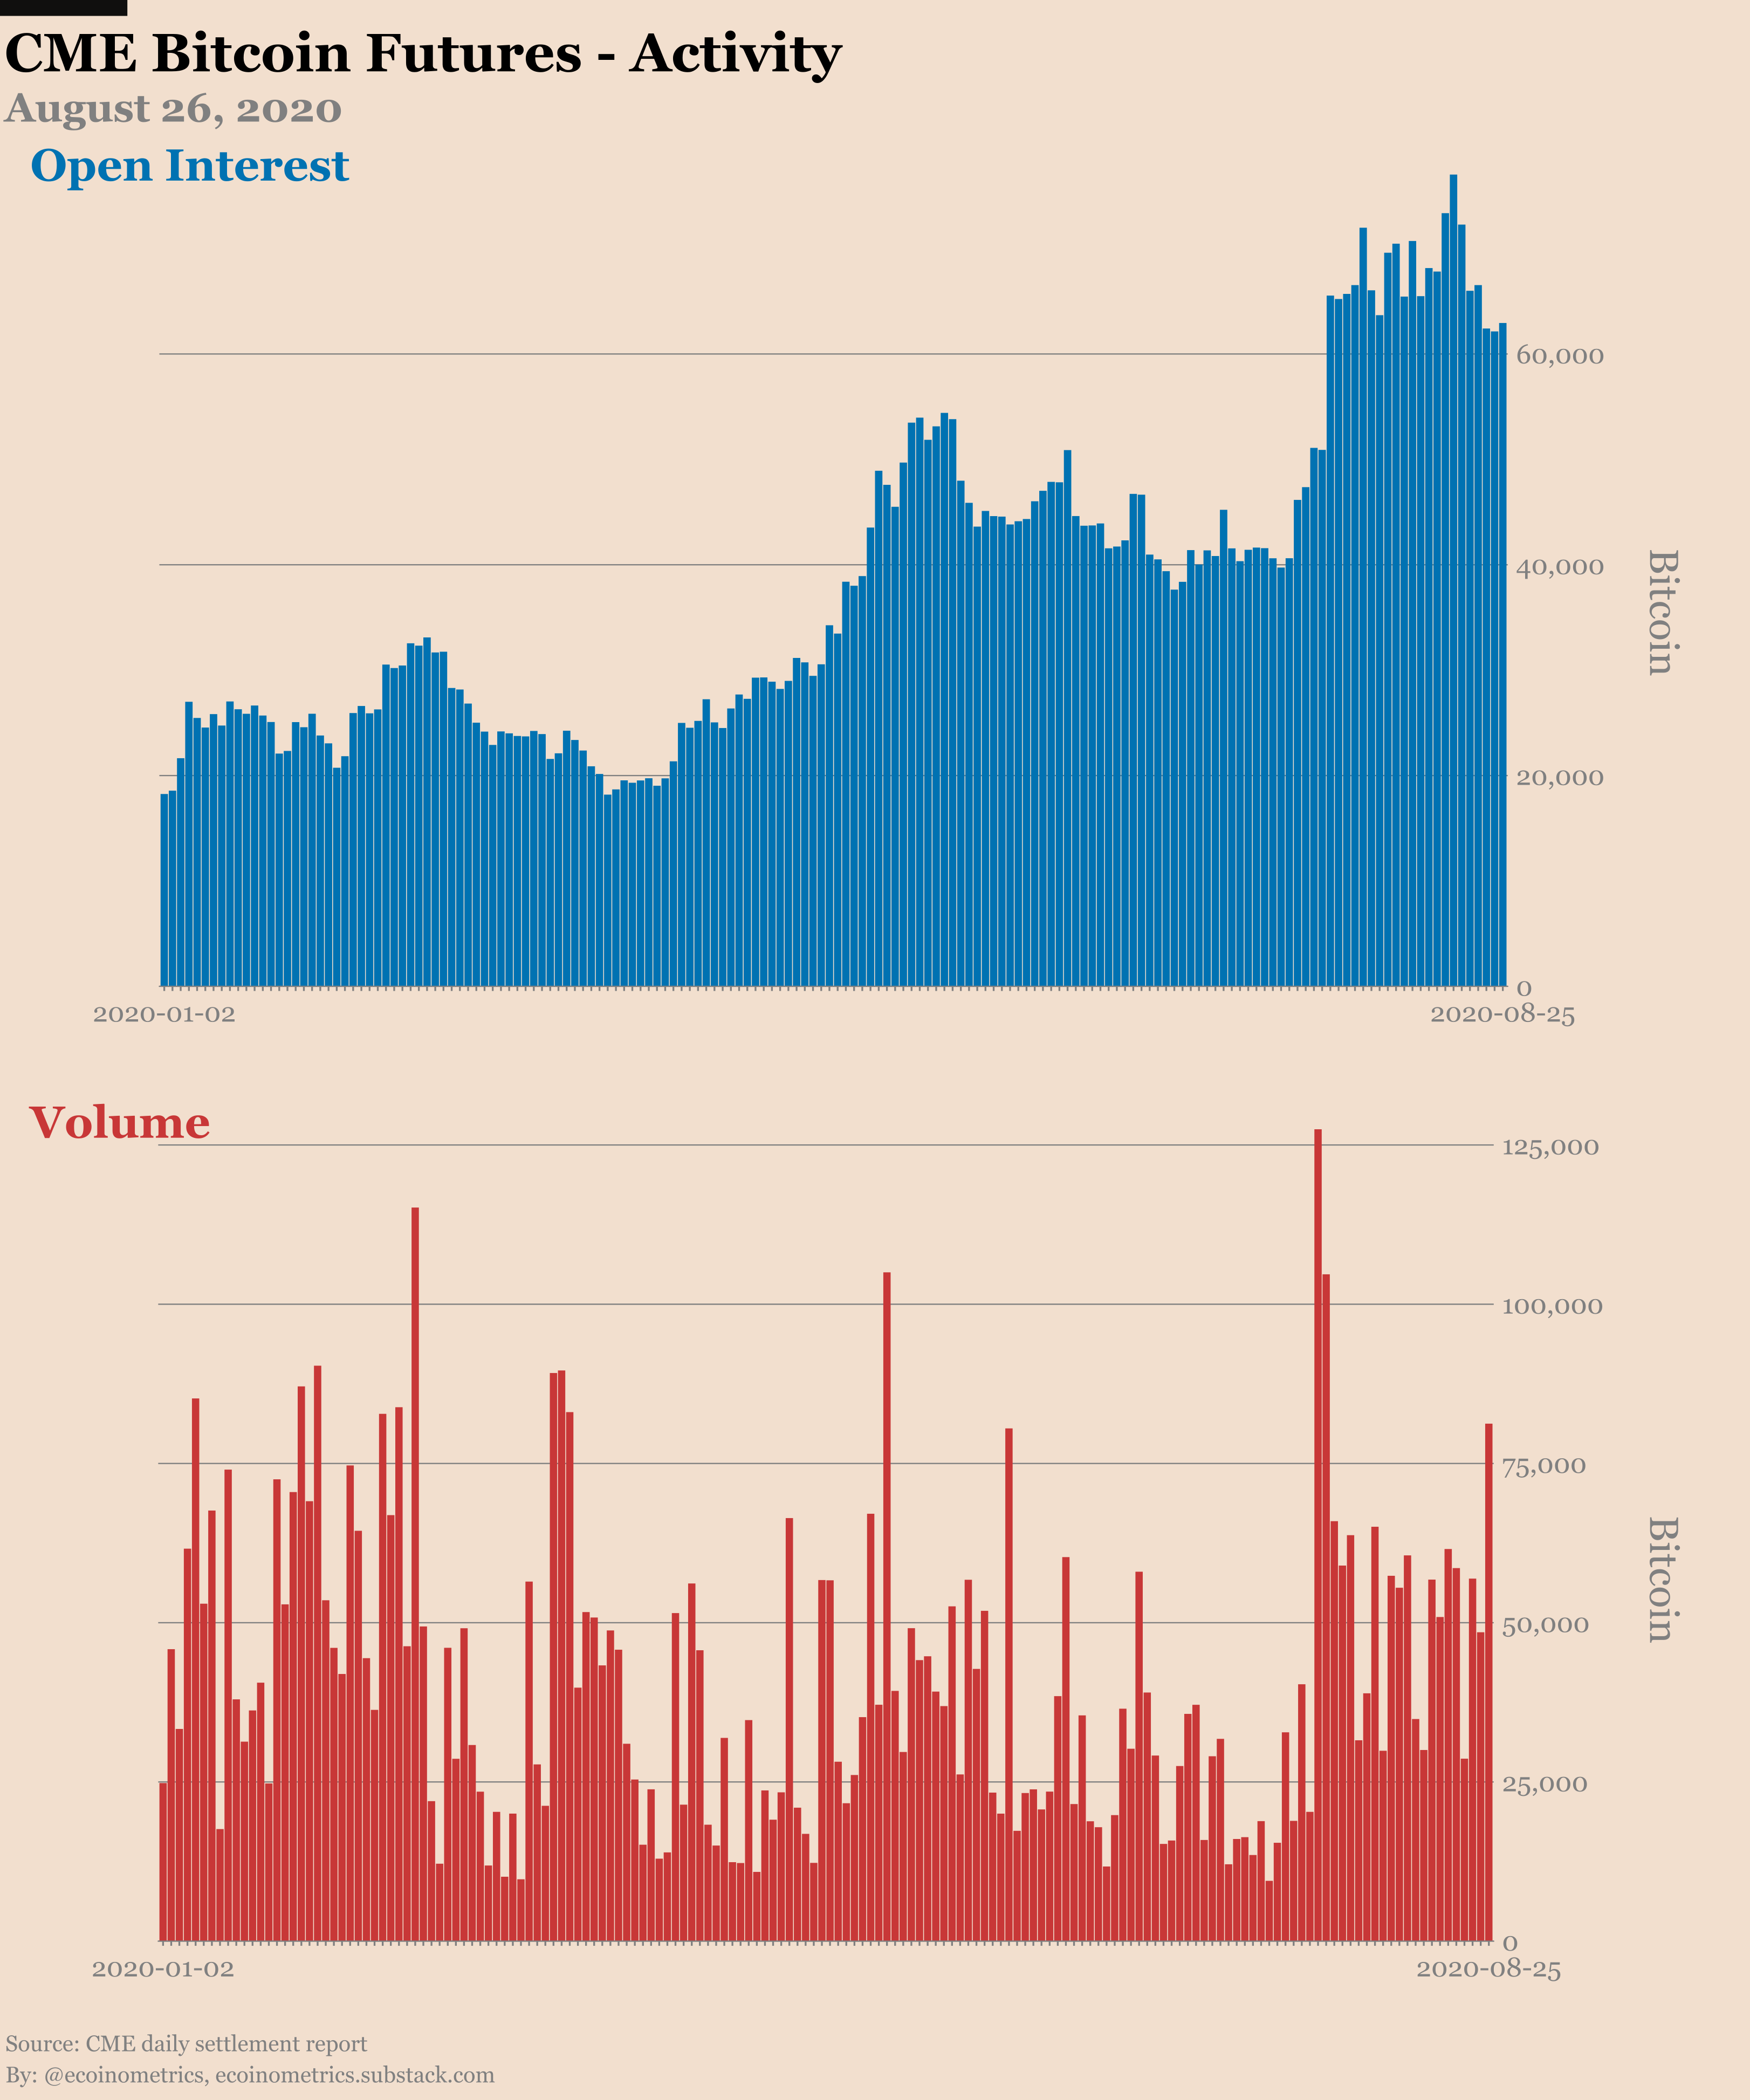
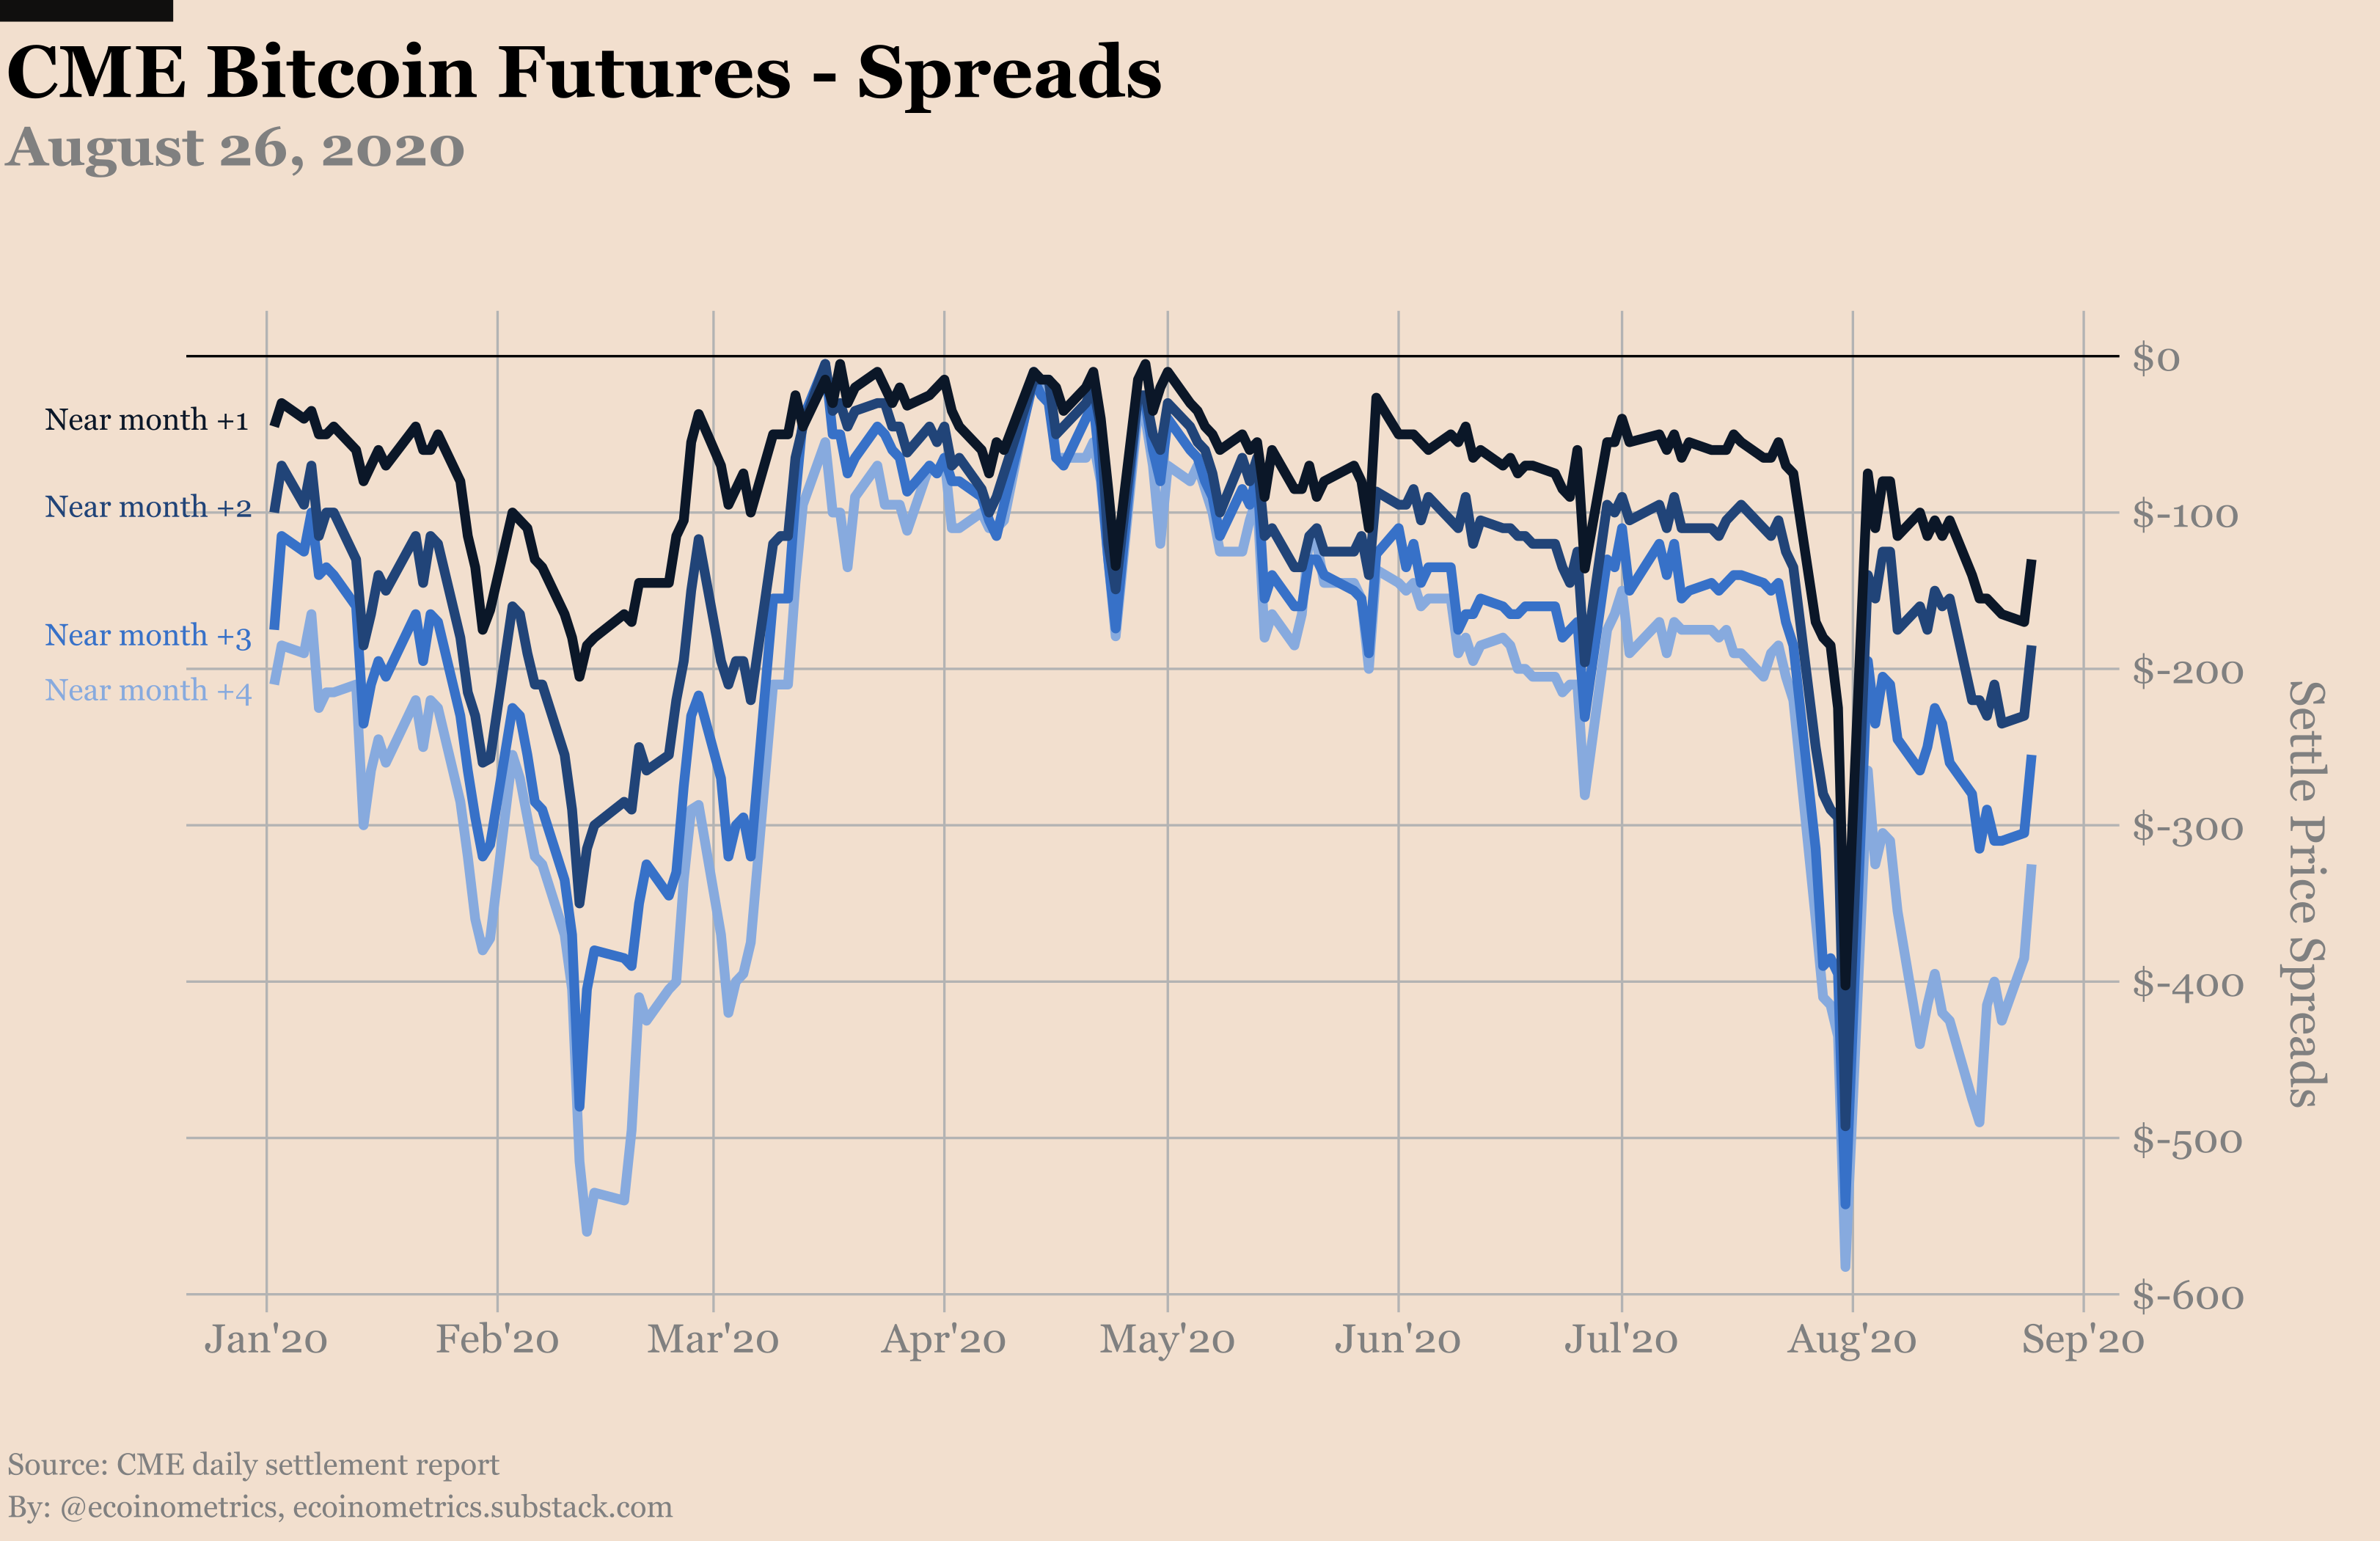
Moving on to the CME futures, Friday is the last trading day for the August contract. As you can see on the heat map, the rollover action is in full force.
The open interest remains high and I don’t really see any sign that the sentiment has turned bearish.
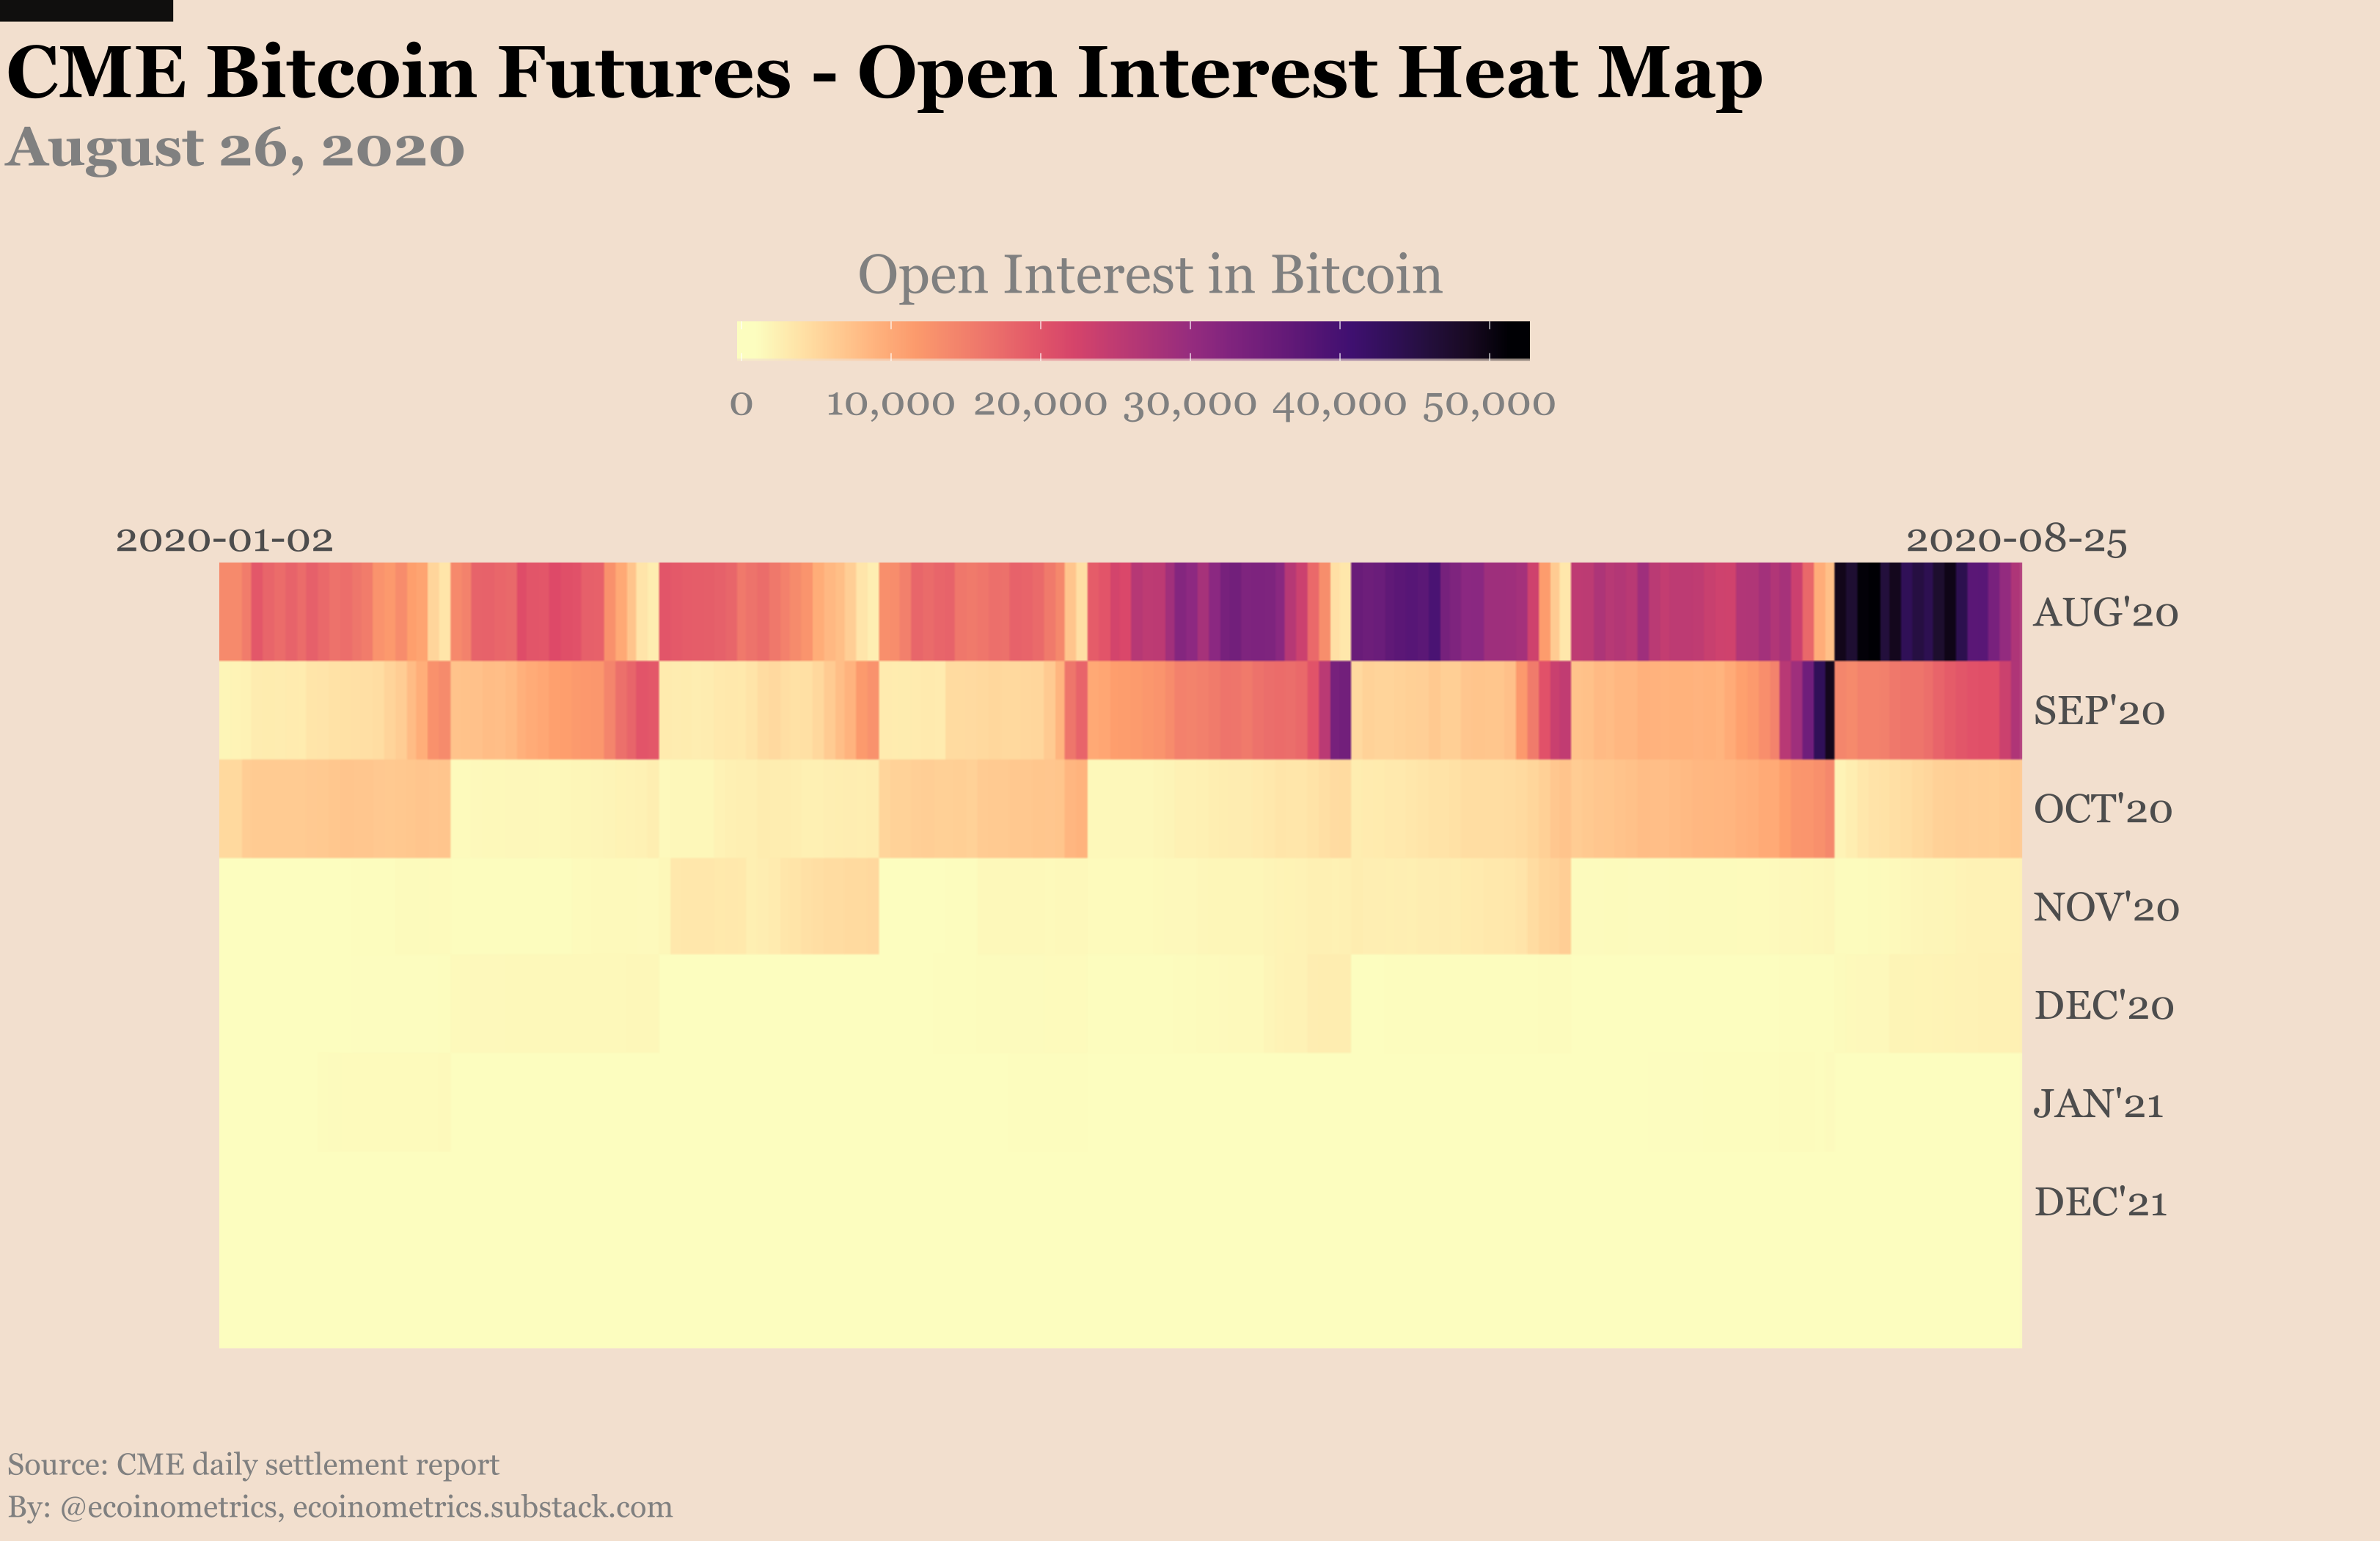
Actually the 4% price drop on Tuesday pushed the spreads lower which makes rolling over the long positions cheaper than traders might have expected.

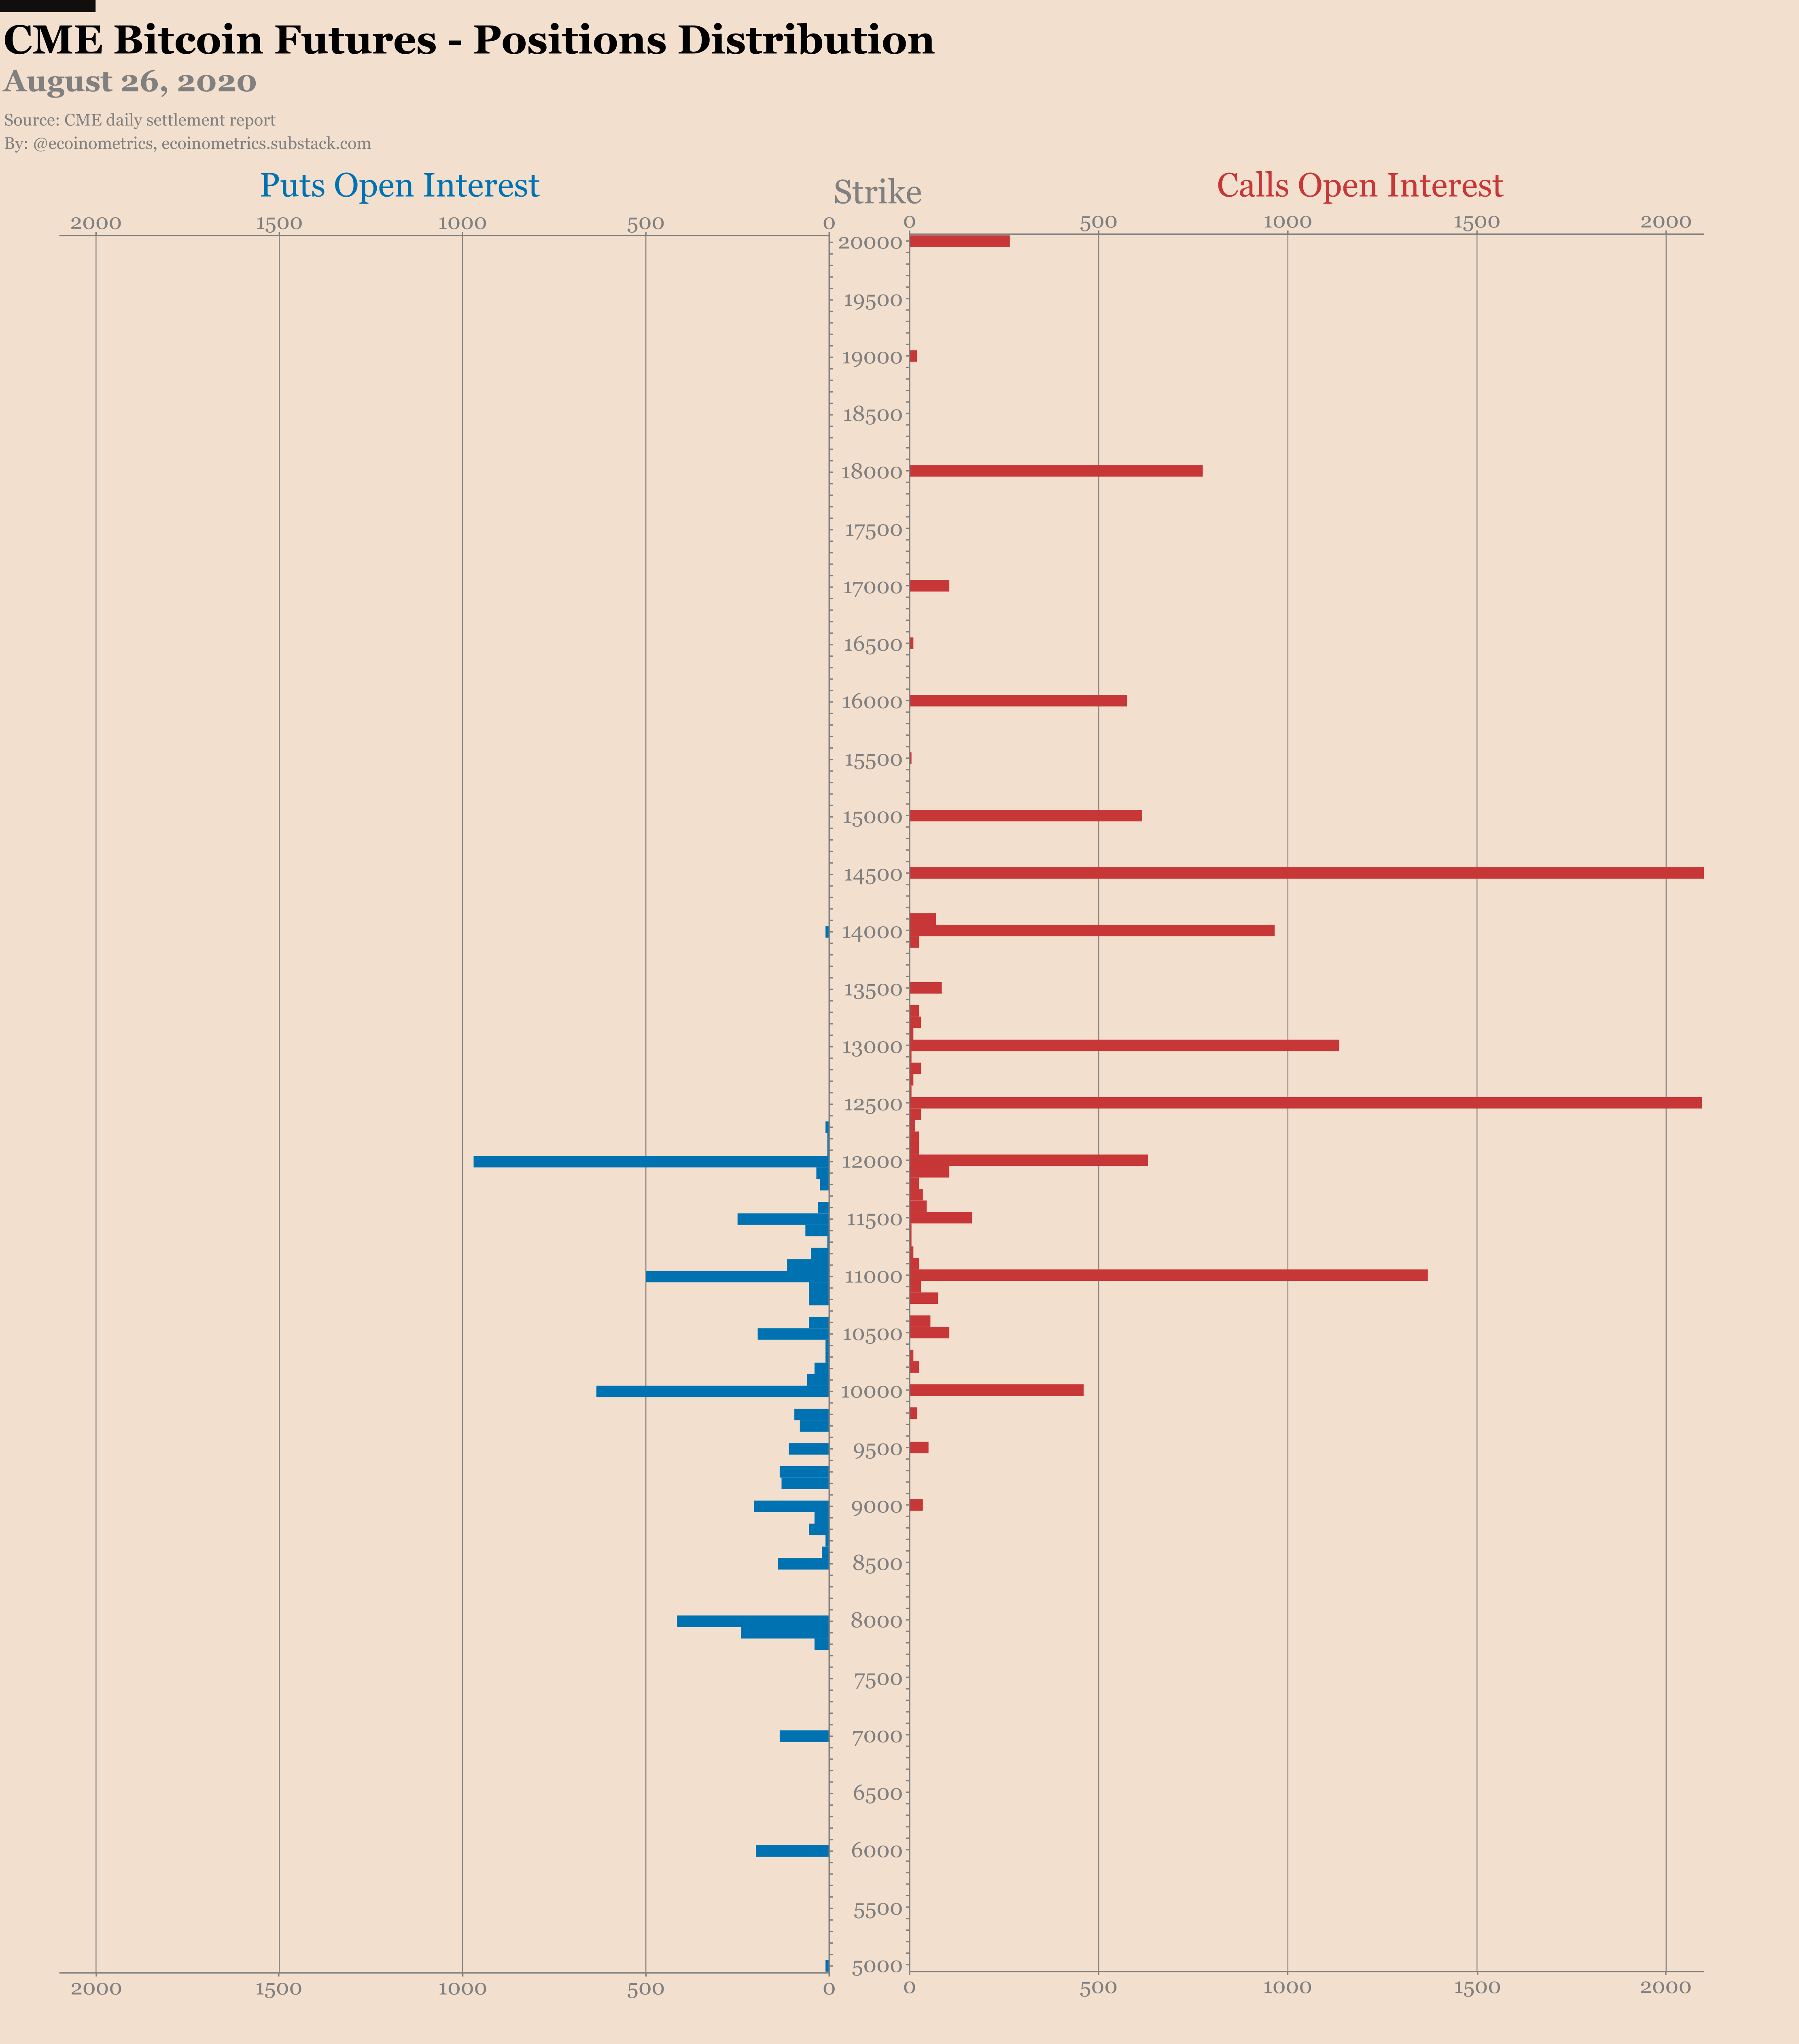
On the options side of things there has been very little trading action recently. But notably the puts continue to rise. The puts to calls ratio is now at 7 calls for every 3 puts.

At the time of this writing (after the close on Tuesday) it looks like on Friday:
87% of the puts will expire out of the money.
79% of the calls will expire out of the money.
Most notably, those 2000 BTC worth of bull call spreads at $12.5k / $14.5k will expire worthless.
Looking at the Commitment of Traders report, the striking move this week is how much more net short the smart money is.
Just check this out. That’s a record amount of net short positions for the leveraged funds.

Now you might be thinking: “OMG the smart money thinks Bitcoin is going to crash!!!”
Not so fast…
The main game in town for the leverage funds is to play the cash and carry trade. You get long spot Bitcoin and sell the same amount with futures contracts. The futures are trading at a premium over spot so you pocket the difference.
When you apply leverage this can get you juicy returns.
But in terms of positioning this is a neutral trade since you are both long and short BTC at the same time. This does not indicate a bearish sentiment.
Actually if you look at the smart money long positions you can see that they haven’t been liquidated. The trend following crowd didn’t turn bearish.

Meanwhile retail is being retail: record net long positions!

That’s it for today.
If you have learned something please subscribe and share the newsletter.
And don’t forget to stack sats!
Nick
The Ecoinometrics newsletter decrypts Bitcoin’s place in the global financial system. If you want to get an edge in understanding the future of finance you only have to do two things:
Click on the subscribe button right below.
Follow Ecoinometrics on Twitter at https://twitter.com/ecoinometrics.
Done? That’s great! Thank you and enjoy.