Ecoinometrics - Bitcoin and tech stocks. It's all about correlations.
April 20, 2022
Everyone is worried about Bitcoin’s correlation to the stock market.
Well not everyone I guess. But maybe they should be.
Or maybe the existence of this correlation opens up the opportunity to trade around it. Maybe.
The Ecoinometrics newsletter helps you understand Bitcoin and digital assets through the macro lens. If you want to get an edge in understanding the future of finance you only have to do one thing, click on the subscribe button right below:
Done? Thanks! That’s great! Now let’s dive in.
It’s all about correlations
If you are a regular reader you know that something happened after the COVID crash of March 2020.
Before that Bitcoin’s correlation to the stock market was pretty much null. Since then it is averaging on the positive side.
That’s not exactly what you want when building a diversified portfolio.
Ideally you’d just mix up uncorrelated assets to improve your risk adjusted return. This is the argument I used to pitch old school investors when trying to sell them on adding BTC to their portfolio.
For the past couple of years this has been a tougher sell.
And the picture above is for the SP500. Because if you look at the NASDAQ instead things are worse. The one month correlation between BTC and the NASDAQ has reached 80%... This is too damn high!
If we zoom out to look at the six months rolling correlation instead, the regime change is even more obvious. There is a clear before and after COVID crash.
Why is that? I don’t know if we can have a definitive answer to that question.
My guess is that it has to do with the unprecedented stimulus that came after the COVID crash. Trillions of dollars have flooded the market and went straight to financial assets. Suddenly investors had to decide where to deploy all that cash.
Naturally that money went on to chase high growth assets: tech stocks, Bitcoin and the crypto market in general.
The result is that a lot of investors hold both Bitcoin and tech stocks in the same portfolio. Not only that but they categorize both as risk assets. That would explain why they end up moving in tandem at a higher rate than before.
Bar picking at the portfolio composition of a large sample of investors I can’t really check if this idea is correct or not.
But if I’m right there is basically two ways we can return to the uncorrelated regime:
A major market crash would trigger some reshuffling of most portfolios. That could flush out the hands holding Bitcoin and tech stocks in the same category.
A return of the “Bitcoin as a store of value” narrative would naturally lead to some decoupling. You don’t trade your store of value like a risk asset.
Those two solutions are not exclusive but given the backdrop of the Federal Reserve fighting inflation I’d say a market crash and a reset is likely to come first.
Regardless there isn’t much you can do about it.
Unless…
Maybe we can use this high degree of correlation to put on some short term trades.
I mean the correlation score suggests that Bitcoin and the NASDAQ tend to move in the same direction during a trading day. If you plot Bitcoin’s daily returns against those of the NASDAQ starting in March 2020 the relationship looks juicy enough.
So you could be on the watch for what the NASDAQ is doing and place a bet that Bitcoin is going to follow on the same day. If you are the day trader type there is some signal buried in there.
Personally I don’t day trade and I don’t recommend it for most people. But maybe we can extend our time horizon a little bit.
There is a clear correlation between the daily moves of Bitcoin and the NASDAQ. But is it the case that we can use the NASDAQ as a leading indicator to BTC one day in advance. Or two days. Or even three days.
Well, that’s easy enough to check.
We can plot the relationship between Bitcoin’s return on day zero and the NASDAQ returns one day before, two days before and three days before then see if the correlation is still there.
Drumroll.
Sad music.
Well no, we can’t do that. At least not in the obvious way.
As you can see when we move away from the same day returns the linear regression line becomes more and more flat. Already a one day shift doesn’t show any significant correlation.
For those curious about what happens if we try to remove the weekend effect (since the NASDAQ doesn’t trade 24/7 like Bitcoin does) the pattern is the same. Nothing to see here.
Now we could run some more involved analysis of the relationship between Bitcoin and the NASDAQ such as the one we’ve used to look at the lead/lag effect between BTC and ETH.
But I feel like this is straying away too far from the big picture.
In my opinion the tl;dr is that the stock market is massive when compared to the market cap of Bitcoin: $15 trillion for the NASDAQ, $40 trillion for the SP500 vs about $1 trillion for Bitcoin.
So you should think about this high correlation as a gravitational field pulling on Bitcoin’s price. If the Fed nukes the stock market into a blackhole don’t expect Bitcoin to escape a major crash.
Just make sure that you are positioned to be able to survive it. The asymmetric return potential is there on the other side.
CME Bitcoin Derivatives
In the eyes of the traditional / institutional investors Bitcoin isn’t looking too hot at the moment.
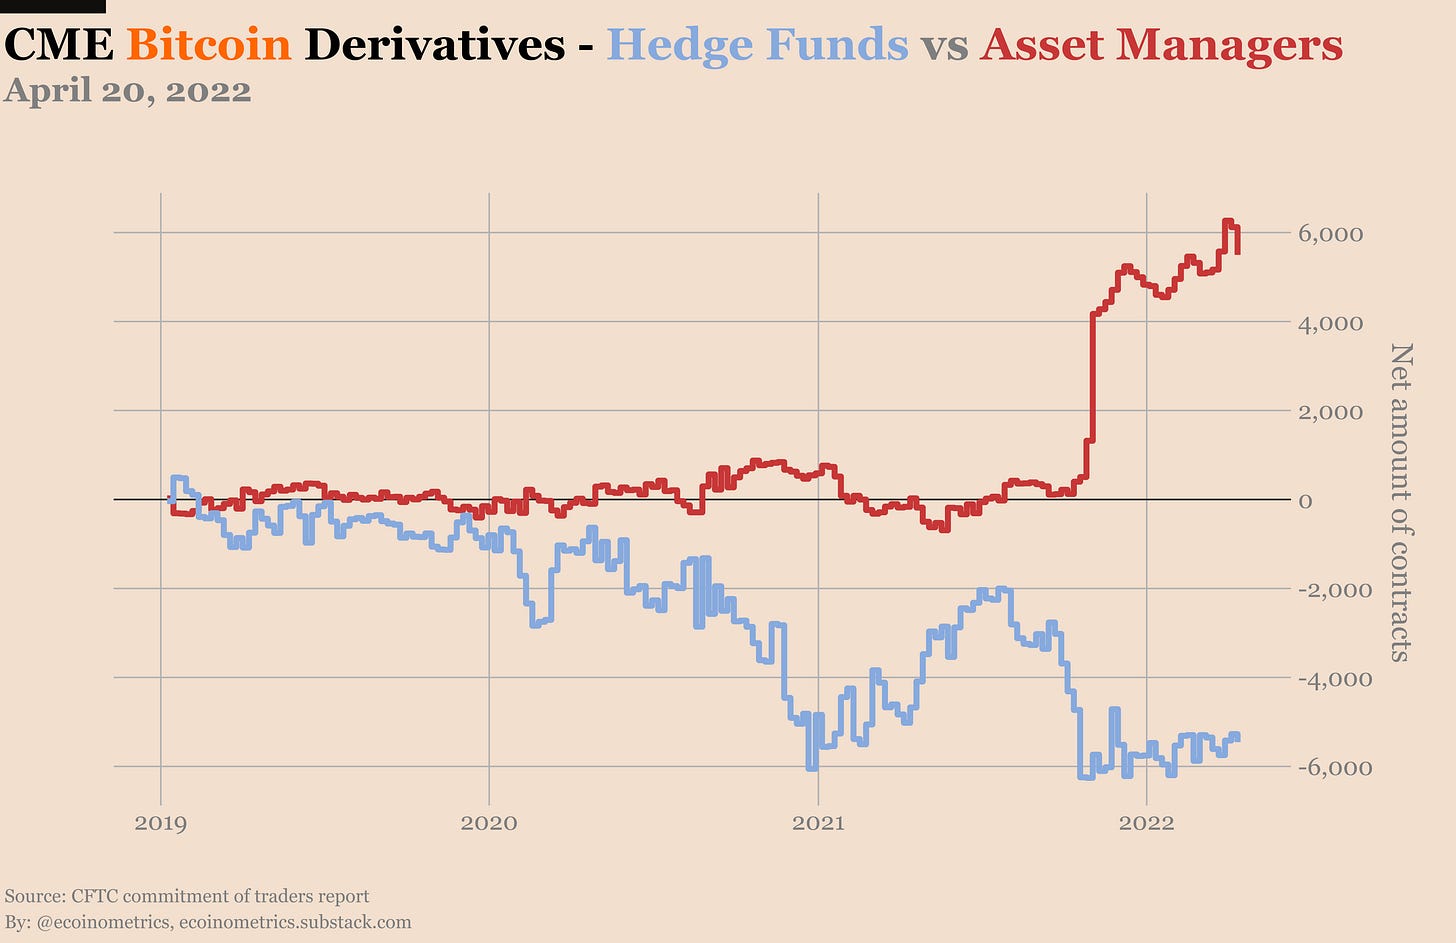
As you can see below, asset managers have dropped a material amount of long positions last week. Of course that makes sense. This category of investors seem to be mainly focused on following the price action. Buy high, sell low, pay the fees. There is a good investment strategy…
No new insight from the hedge funds. Despite those future premiums staying pretty low the amount of shorts keeps stable.
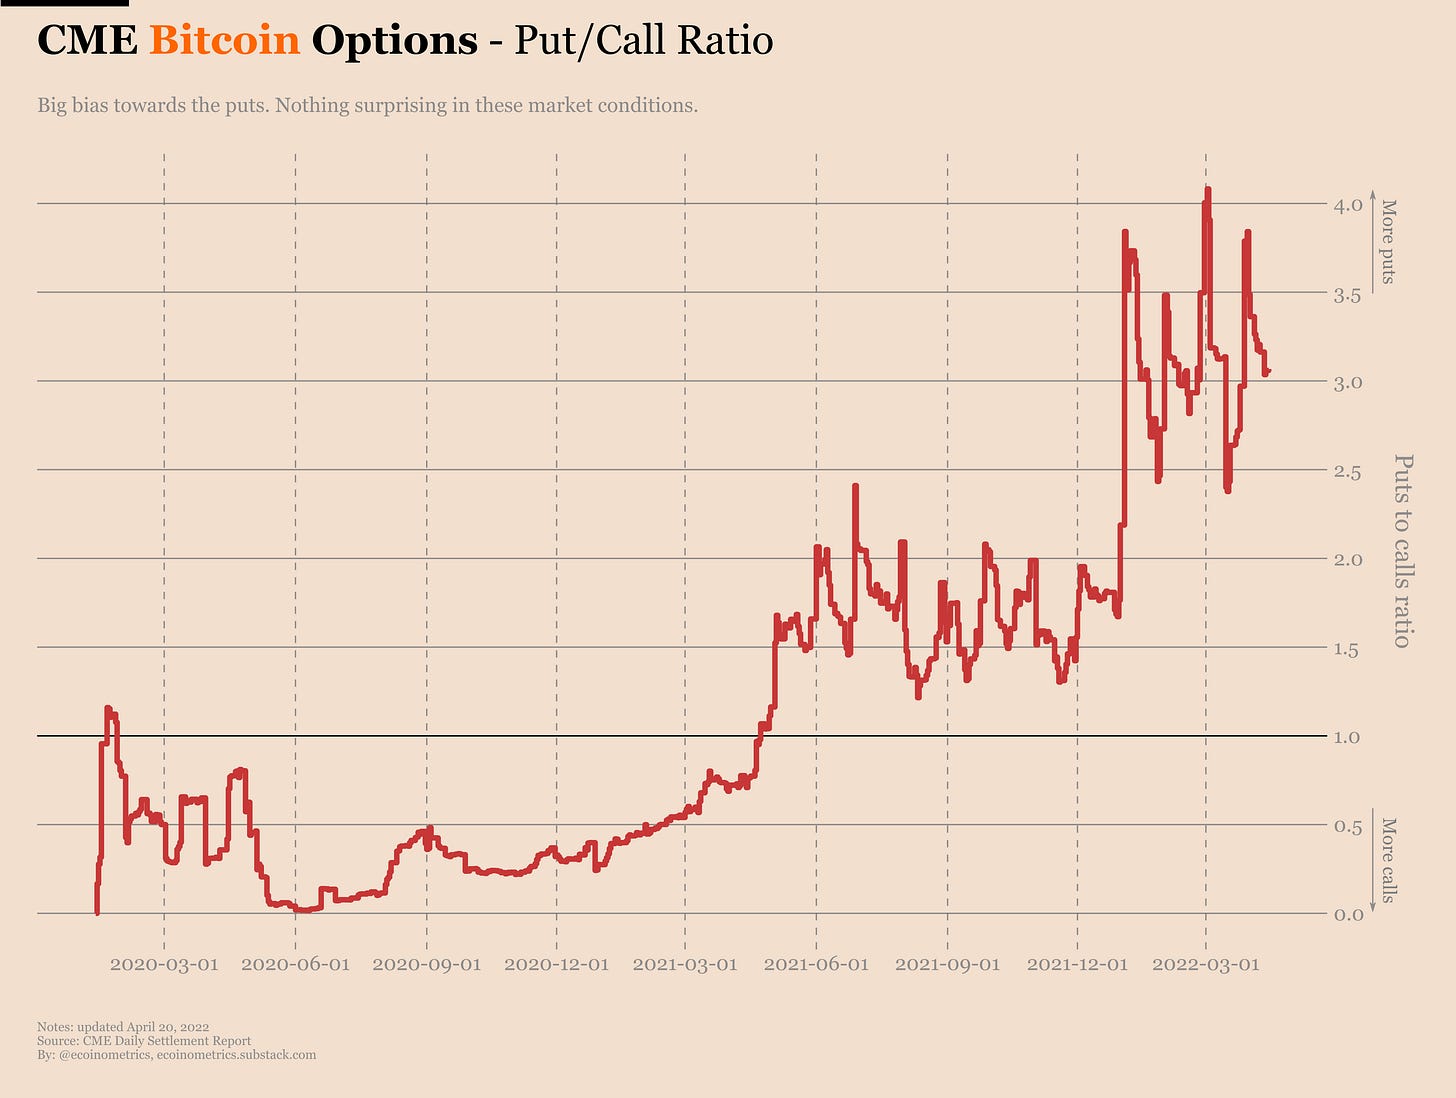
Same thing on the options market. With the Easter weekend there has been very little volume. Puts to calls is where we left it last week.
The distribution of positions is littered with blue…
A subscriber requested that I do an analysis of the max pain price based on this option data and I’ll definitely do that (most likely next week).
If you aren’t familiar with the concept, the idea is to look fort he strike price where most of the options contracts concentrate. That would be the price where the largest amount of money is on the line depending on where Bitcoin closes on expiration of the contracts.
In the stock market this max pain price tends to be an attractor. So tracking it can give you some information for where an asset might tend to land close to the expiration date.
Does this apply to Bitcoin? Is it enough to look at the CME derivatives or should we take into account the whole Bitcoin derivatives market? Can you trade around this?
We’ll try to explore those questions.
That’s it for today. If you have learned something please like and share to help the newsletter grow.
If you are already a free subscriber please consider upgrading to a paid tier to get the full access including:
Two newsletters every week.
Suggest research topics and request charts.
Cheers,
Nick


Great analysis. Lyn Alden said, during times of greatest uncertainty investors like cash and bitcoin is one of the most liquid assets that trades 24/7 and can be converted to cash. Hence Bitcoin easily sells off in times of stress. It’s a bummer that the SOV narrative for Bitcoin is now gone or you have to have a multi year horizon.