


Ecoinometrics - Bitcoin: from macro driven to uncorrelated
Bitcoin correlations report, July 2023

Last month it looked like macro was in the driver’s seat. But thirty days later that’s not really the case anymore. As a matter of fact it seems that Bitcoin is running on its own narrative.
Without data you are just another investor with an opinion.
The Ecoinometrics newsletter gives you insights from crypto and macro data to help you make better investment decisions.
Each issue of the newsletter tells you what you need to know in 5 minutes or less, direct to the point, with lots of charts to allow you to quickly visualize what’s important.
Join more than 20,000 investors here:
Done? Thanks! That’s great! Now let’s dive in.
P.S. Checkout our latest tracker of MicroStrategy Bitcoin holdings at https://www.ecoinometrics.com/microstrategy-bitcoin-holdings-with-charts/.
Bitcoin’s correlations report
Every month in the Bitcoin’s correlation report we examine a set of correlations and trend similarity metrics to understand what is driving Bitcoin’s price action and what you need to pay attention to. This is our report for July 2023.
The takeaway
If you don’t have time to read the whole report here is what you should know:
Bitcoin’s correlation score has decreased over the past 90 days for almost all assets.
In particular Bitcoin isn’t benefitting from the same tailwind effect as the stock market.
And the link between gold and BTC is getting lost on both the short and long time frames.
Overall Bitcoin is looking less correlated to the macro drivers.
The only thing that persists is the US$ trend similarly when looking at the big picture.
All this is likely related to the Bitcoin ETF narrative. And that has some tactical applications we’ll discuss below.
The table below summarizes the state of the correlations over the past three months as of today.
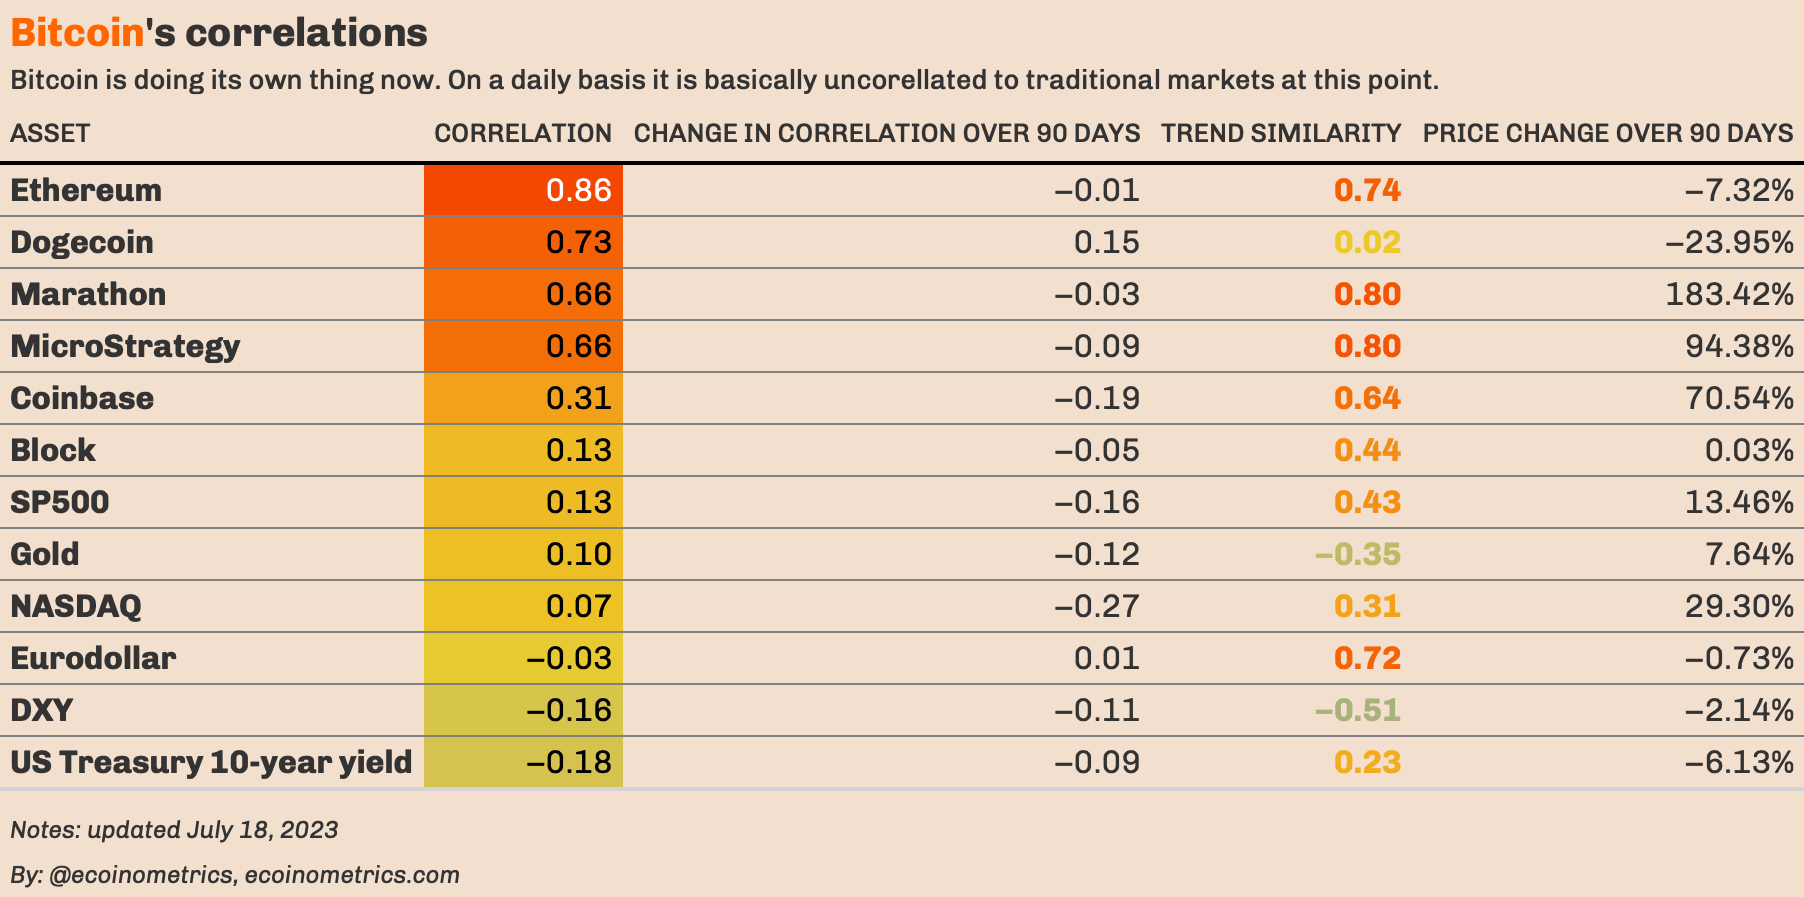
The correlation score is the tendency of those assets to move (or not) like Bitcoin on a daily basis. The trend similarity score is the tendency of the price action of an asset to follow the same overall pattern as Bitcoin over a given time window. Those two scores give you a picture of the correlations over the small and big timeframes.
Now let’s dig into the data.
Keep reading with a 7-day free trial
Subscribe to Ecoinometrics to keep reading this post and get 7 days of free access to the full post archives.