Don’t invest in Bitcoin, it is too volatile! Is what people who put all their money in the stock market tell you.
Obviously if you actually look at the data things are more nuanced.
And in those times where the stock market is on the verge of a major correction, maybe it is worth taking a look at what really matters.
The Ecoinometrics newsletter decrypts the place of Bitcoin and digital assets in the global financial system. If you want to get an edge in understanding the future of finance you only have to do one thing, click on the subscribe button right below:
Done? Thanks! That’s great! Now let’s dive in.
Bitcoin is too volatile
When people complain that Bitcoin is too volatile they usually mean that you can put $10k on BTC today and chances are that this will transform into either $5k or $20k in a matter of days.
Good for you if you’ve caught the upside. Too bad if your timing sucked.
Now I’m exaggerating a little bit. Bitcoin dropping -50% or doubling within a few days isn’t really common anymore (if it ever was). But recently we have seen stocks like Netflix or Shopify drop -40% in like a day. And with the Fed on a path to quantitative tightening many tech stocks are down big time compared to their peak.
So it is legit to ask the question: is Bitcoin really much more risky than your typical tech stock?
Of course it depends on what you call risky.
I think one way of looking at it which closely reflects the actual experience of most investors is to look at the corrections. Or to be more precise the drawdowns.
By definition a drawdown is the period of correction between two consecutive all-time high.
E.g. Bitcoin made an all-time high at $20k in December 2017 and it took until December 2020 until it managed to reclaim that price. That whole period counts as one drawdown.
You can calculate a lot of things on a drawdown. But if you had to summarize each drawdown with only two properties it would probably be:
How big was it? That is how much did the price drop in percentage from peak to bottom.
How long did it last? That is how many days did you need to wait to see a new all-time high.
That’s basically all you need to get a worst case scenario picture of those corrections.
The size of the drawdown tells you how far underwater you went if you bought at the peak. The duration of the drawdown tells you how long you had to wait to be in profit again if you bought at the peak.
Those are kind of easy metrics to relate to.
So if you are asking me “is it more risky to invest in Bitcoin or Netflix?”, something I can do is compare the drawdowns of these two to see who has it worse?
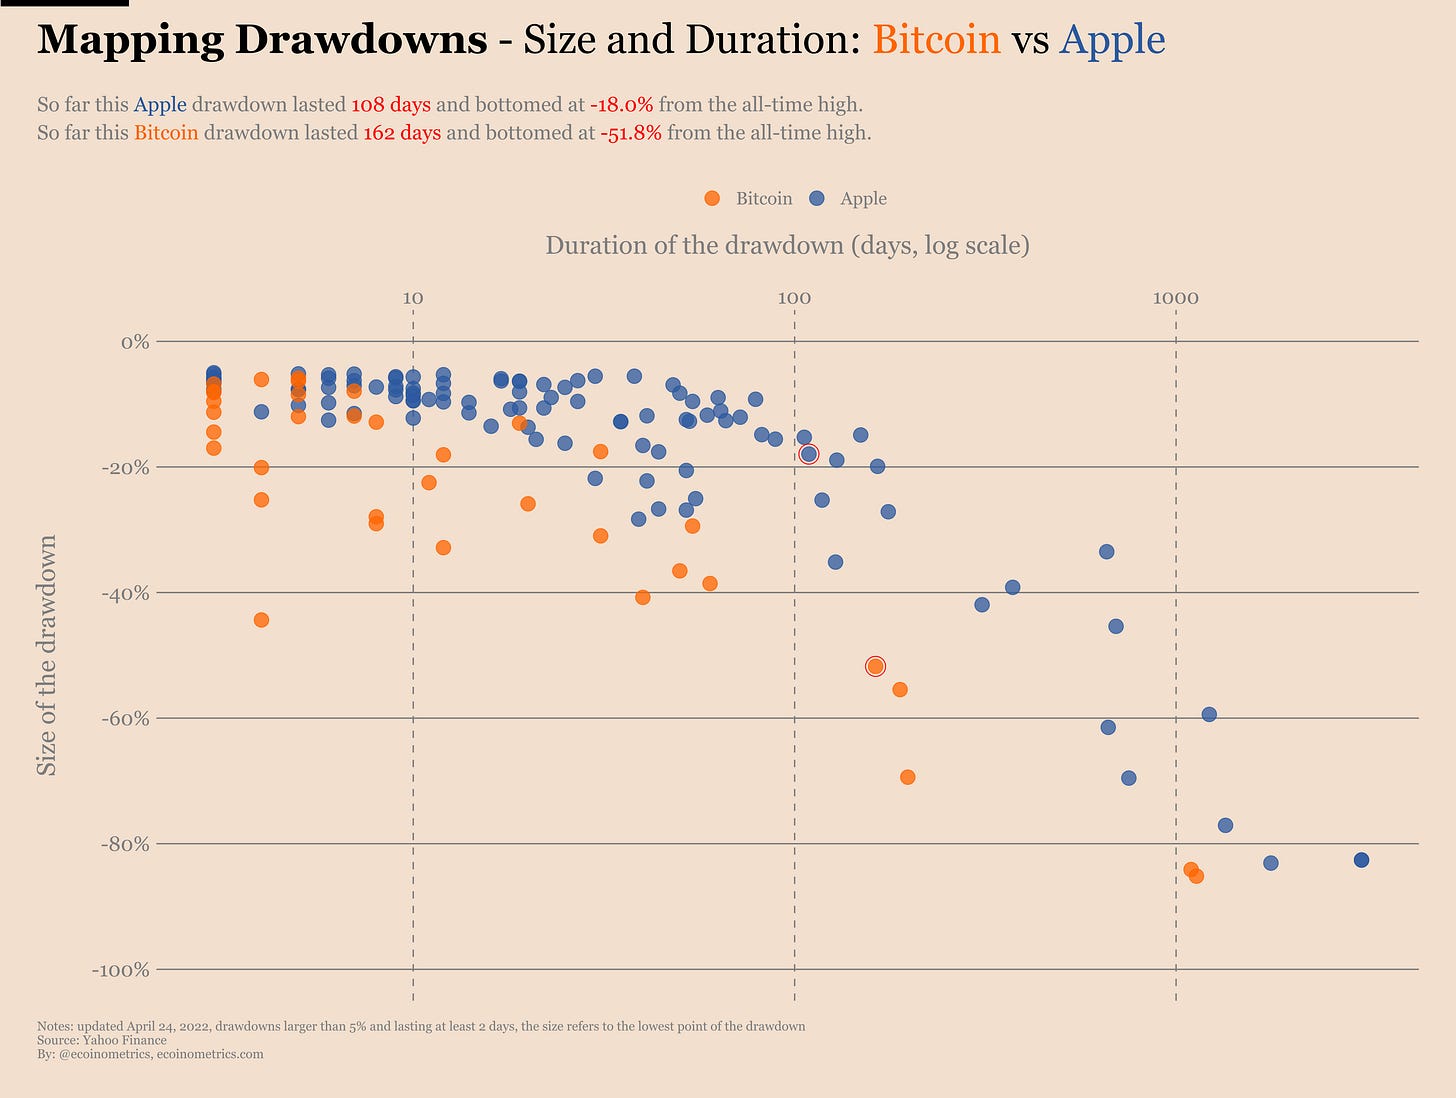
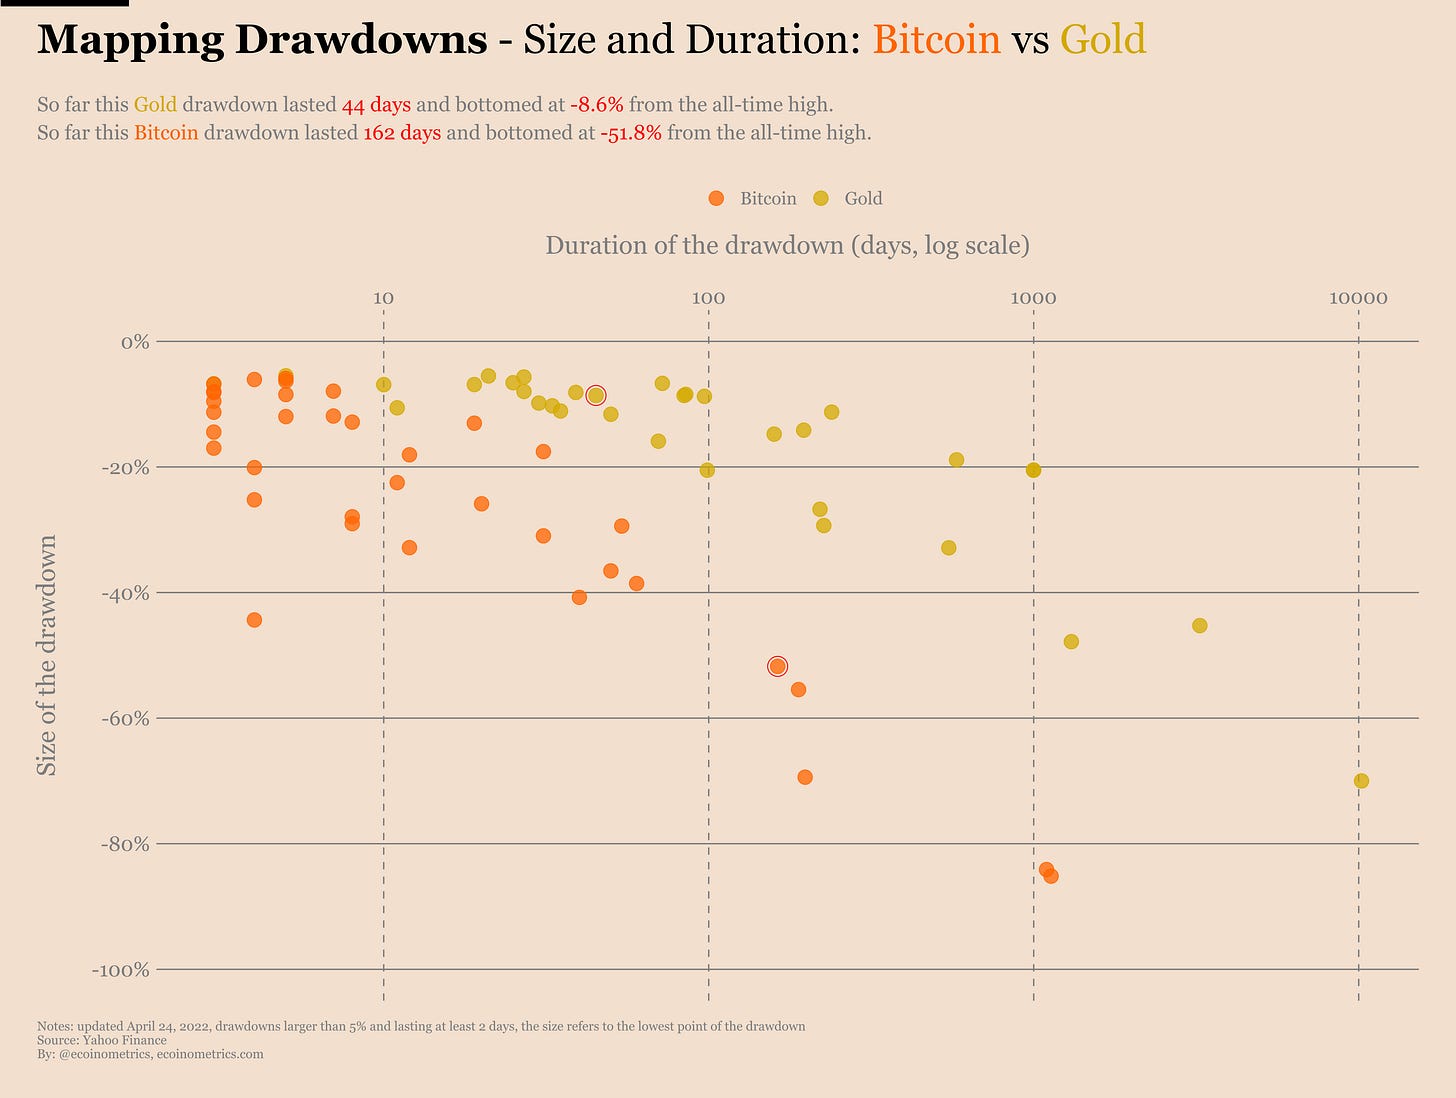
And that’s what we did below. Each point on the chart is a drawdown. On the vertical axis you can read the size of the drawdown, the lower you go on the chart the larger the drop. On the horizontal axis you can read the duration of the drawdown. Those durations are expressed in days and we are using a log scale due to the wide range that needs to be displayed.
We are only displaying drawdowns whose size is greater than -5%. The points circled in red are the current drawdowns of these two assets.
Take a look.
Honestly the patterns aren’t so different. Yes, for shorter durations Bitcoin tends to see larger dips (the orange points tend to be below the blue points). But that’s not necessarily a bad thing. Basically that tells us that Bitcoin can recover faster from those kind of drops.
And how many times have commentators declared Bitcoin dead after a -70% correction? Well a stock like Netflix has a bunch of these too. Still they survived until now (that’s 20 years).
My point is, if you are a long term investor you wouldn’t have felt more pain holding on to Bitcoin compared to holding on to Netflix.
Now I can hear some of you say “ok this is true for Netflix, but that’s just cherry picking”.
To which I answer “fair enough”. Let’s look at other big stocks then.
Talking about cherries, how about comparing Bitcoin to Apple?
Damn! In its long history Apple has had a bunch of very significant drawdowns often taking longer than Bitcoin to recover from dips of similar size. Yet that didn’t prevent Apple from becoming the largest company in the world by market capitalization.
But let’s continue. Bitcoin vs Nvidia. Same pattern.
Bitcoin vs Shopify. Not too different.
Bitcoin vs Paypal. Here we go again.
Bitcoin vs Tesla. Same story.
Bitcoin vs Facebook. The parallel continues.
You have to compare Bitcoin to gold or a stock index like the NASDAQ to see a more significant divergence. But again you could read those charts as Bitcoin recovering faster from those larger dips. So not necessarily a bad thing.
My point is, there is some universal law of drawdowns when it comes to the relationship between size and duration. Whether you invest in Bitcoin, gold or the stock market you will have to put up with those.
In that regard Bitcoin isn’t worse than any other traditional asset.
Now that’s not to say that on a day to day basis Bitcoin won’t have larger price fluctuations. But even that is starting to change as Bitcoin matures.
On the chart below I’ve plotted the distribution of the one-month realized volatility for a bunch of assets. This is the closest you can get for a fair comparison of day to day volatility. On this chart Bitcoin is divided by halving cycles.
Take a look and tell me what you are seeing.
That’s right! The more Bitcoin matures the more compact its volatility distribution becomes.
Especially looking at the right tail of the distribution you can see that as of this third halving cycle Bitcoin doesn’t see more extreme events than your typical tech stocks. And even on average it isn’t much more volatile than Nvidia, Tesla or Shopify.
What’s the tl;dr?
Whether you look at day to day volatility or long term downside volatility as represented by the drawdowns, Bitcoin doesn’t look much different than your typical stock investment. So don’t worry too much about volatility and focus instead about long term growth potential. Those betting on asymmetric returns shall be rewarded in time.
Market conditions
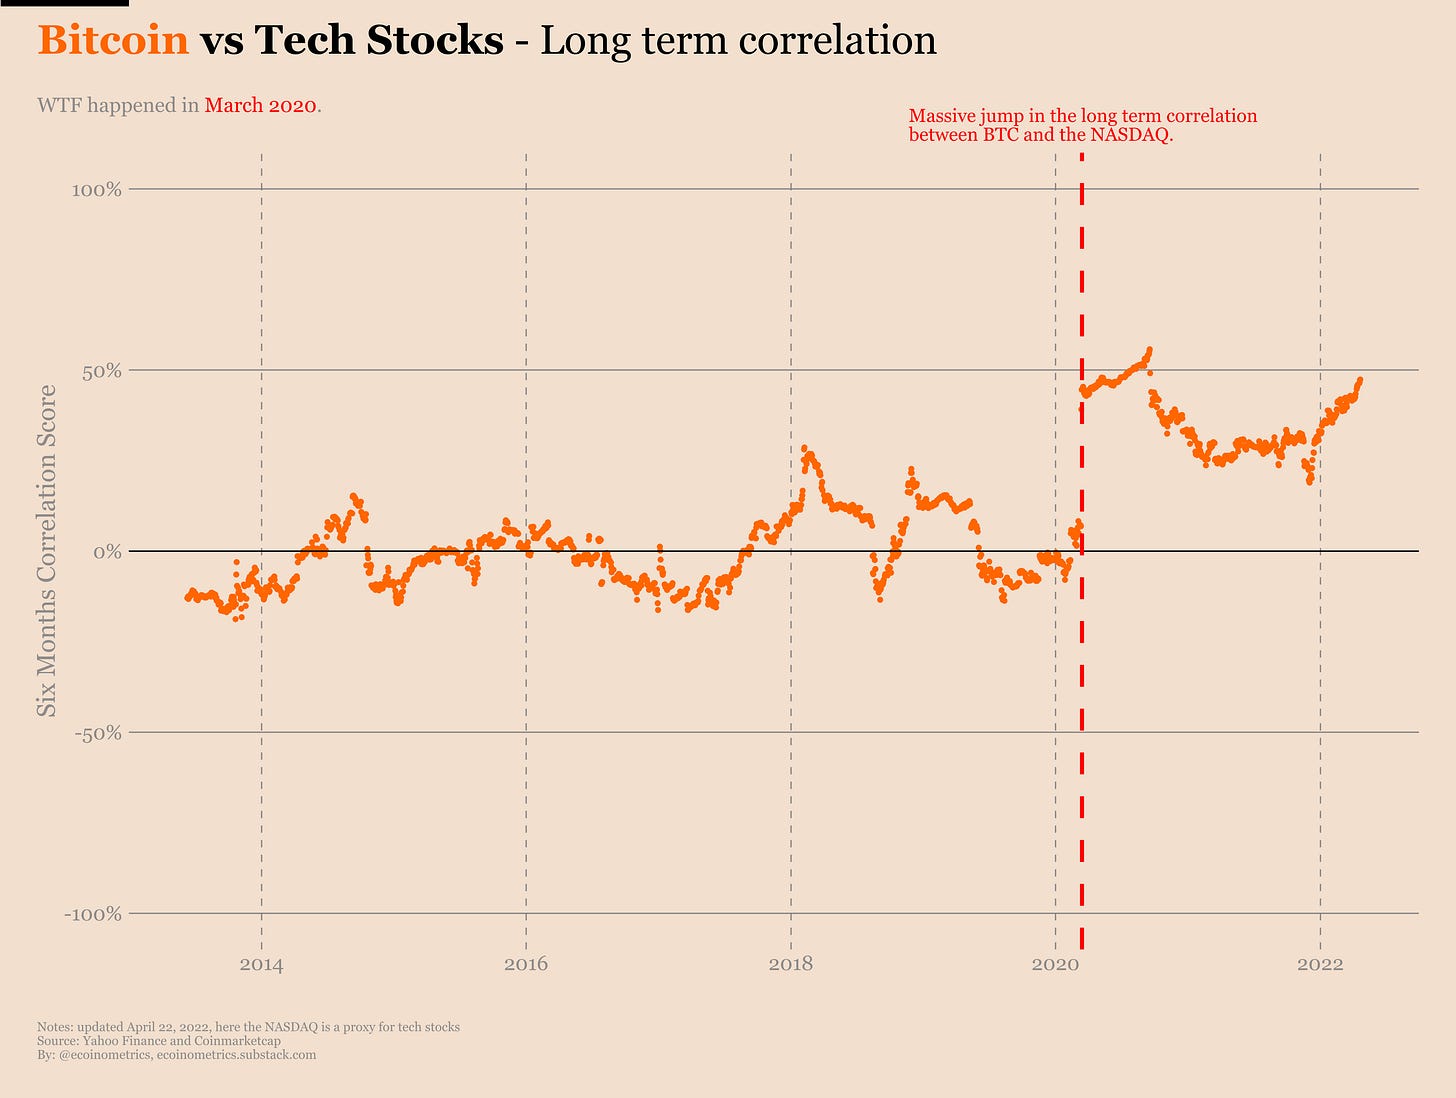
The market conditions could be summarized with just two charts telling the same story:
Bitcoin’s correlation to the SP500.
Bitcoin’s correlation to the NASDAQ.
Just take a look.
We’ve been warning about the same thing for weeks but I’m going to repeat it one more time.
The number one risk for Bitcoin is that it is trading like a risk asset (highly coupled to the stock market) at a time where the Federal Reserve is starting a quantitative tightening cycle.
You can pretty much ignore everything else until we get a crash or the Fed restarts the money printer. Whichever comes first.
And it isn’t like on-chain data contradicts any of this.
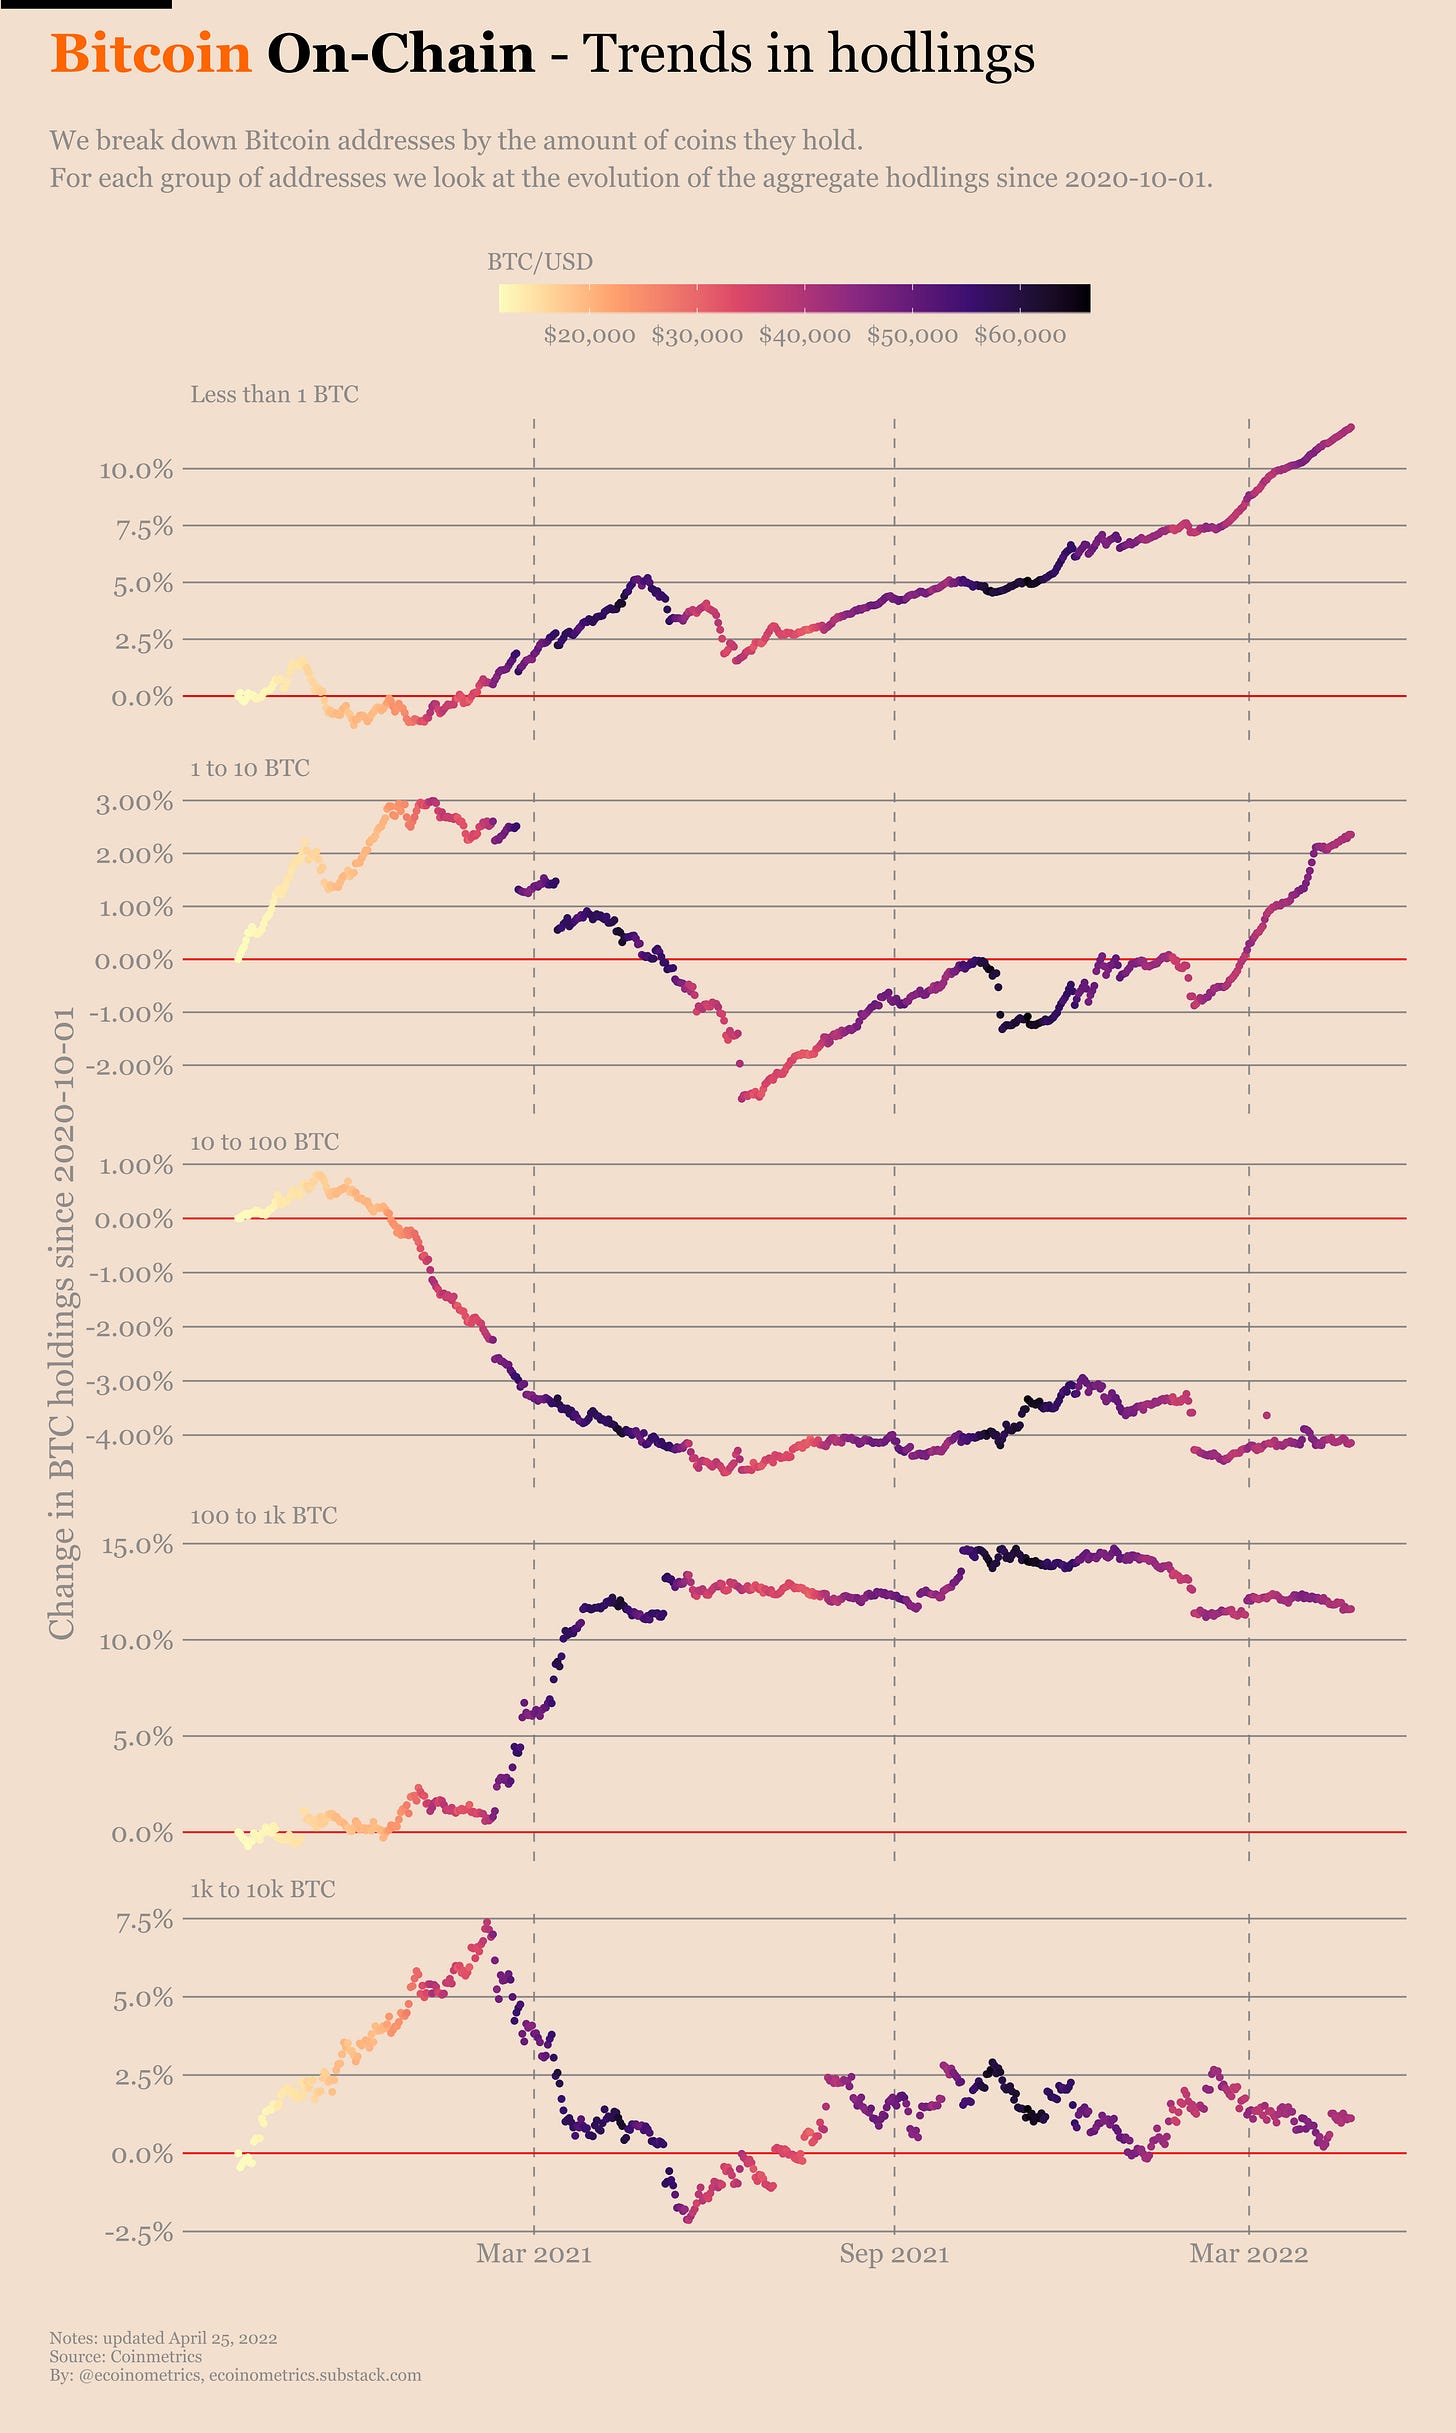
The evolution of Bitcoin’s on-chain activity suggests that we are going into sleep mode. This is normally a great time to build a position before the next bull run. But it also means that now is the time to be patient. Not every +10% move is the start of a bull market…
What else is there to say?
Not much.
The accumulation trend is getting weaker.
The whales addresses aren’t participating and even the small fish are showing signs of slowing down.
The result is I guess a typical bear market configuration with:
The smaller addresses stacking sats while waiting for the next bull run.
The whales trading in and out of the smaller moves to try harvesting some returns out of the choppy action.
So again not much to see here. Now is the time to focus on the broader market: stocks, bonds and the Federal Reserve’s fight against inflation. This will have a greater impact on Bitcoin than anything else.
Vote
If you are a paid subscriber you can now vote for the next data visualization topic that will be implemented on https://www.ecoinometrics.com/.
The candidates are:
All the drawdowns. A dashboard that compares all the drawdowns and gives insights on when is the best time to buy the dip.
Follow the trend. A trend following dashboard for all the info relative to trend following strategies.
Signals among the noise. A collection of all the metrics giving actual signals on Bitcoin, what they predict at their current value and whether or not they agree with each other.
Macro risk factors. A dashboard of all the macro risk factors likely to affect digital assets.
Tracking the models. Take the most popular Bitcoin valuation models and use the deviation from the models as a way to track the strength of different narratives.
More description of each topic in this previous issue of the newsletter.
Follow the link below to vote (you’ll need to login to access the page), results at the end of the week:
https://www.ecoinometrics.com/vote-for-next/
That’s it for today. If you have learned something please like and share to help the newsletter grow.
If you are already a free subscriber please consider upgrading to a paid tier to get the full access including:
Two newsletters every week.
Suggest research topics and request charts.
Cheers,
Nick


Love your analyses, there is so much to learn! When i can im going for paid subscription for sure! Thank you and keep up!
Great article!
I think the comparison is not completely fair because for example Apple's stock is there since 43 years and has gone through major financial crisis such as the dot com bubble and the 2008 crisis where bitcoin was still not around.