Ecoinometrics - Buy the rumour, sell the inflation release?
What is the typical price action around inflation data releases?
When you are looking for statistical arbitrage opportunities the first place to start is regular events that affect an asset.
As an example for crude oil it could be the weekly EIA inventory report. Or it could be the OPEC meetings.
There is one such regular event that is talked about a lot. It is the monthly US inflation release.
These days this one affect pretty much everything. But is it doing so in a systematic way?
Let's have a look at the data.
The Ecoinometrics newsletter helps you navigate the landscape of digital assets and macroeconomics with investment strategies backed by data. Subscribe to get an edge on the future of finance.
Done? Thanks! That’s great! Now let’s dive in.
Buy the rumour, sell the inflation release?
Is it more volatile that other days? Is there a bias towards positive or negative returns?
Our conclusion was that while there are clear effects from time to time, nothing is systematic enough that you could trade around it.
But that was looking only at what happens on the release day itself.
As one of you suggested there could be some patterns that only appear when you zoom out a few days around the release date.
That's a very good point and we are going to try to see what we can say about that today.
Some background first.
The US inflation release typically happens in the middle of the month and gives the data regarding the previous month. The next print will be about the month of September and will be released on October 13.
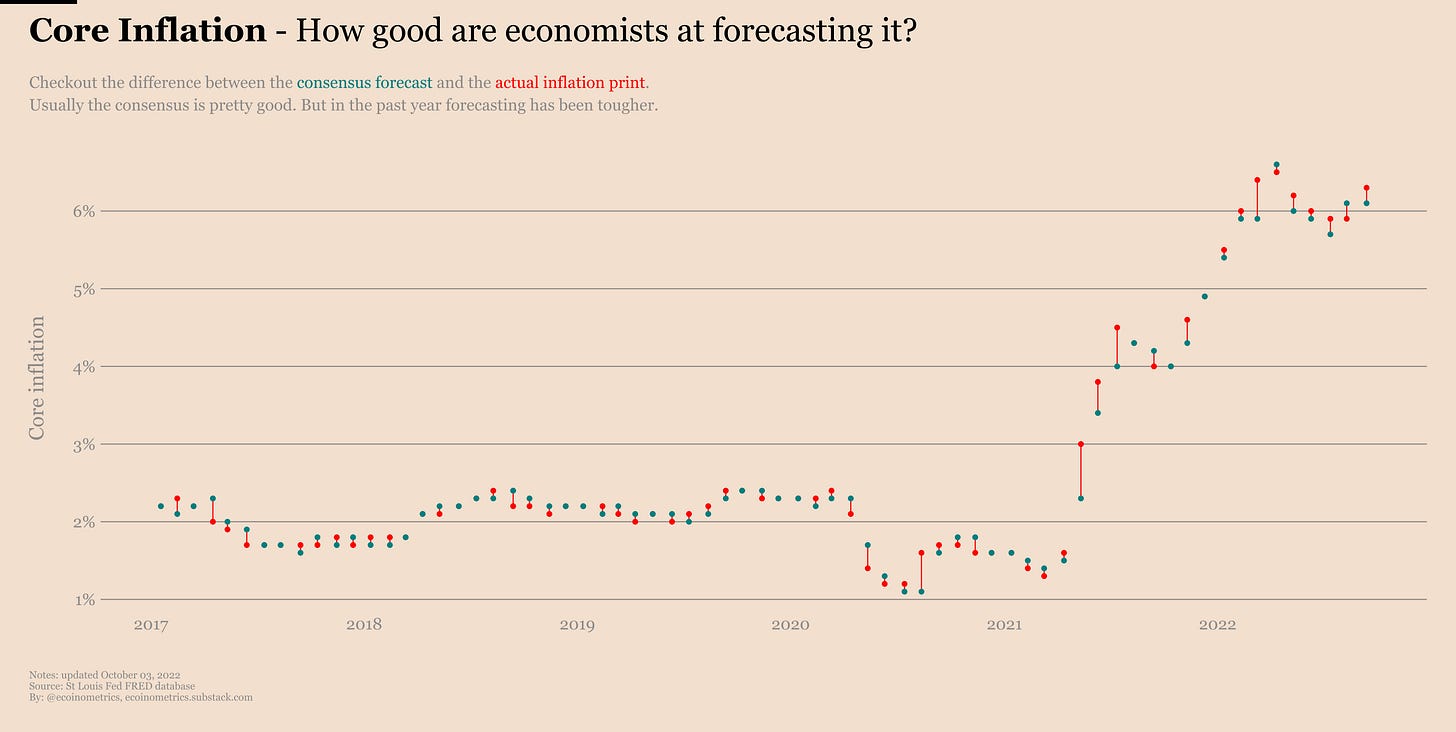
Investors don't go blind into each inflation report. Economists in various institutions make forecasts of where inflation should be and a consensus value is extracted as a reference point of where experts expect inflation to be.
Keep reading with a 7-day free trial
Subscribe to Ecoinometrics to keep reading this post and get 7 days of free access to the full post archives.


