


Ecoinometrics - Comparing corrections
June 02, 2021

Bitcoin is not the only investable asset in the world. And all assets have to deal with periods of corrections. But is Bitcoin out of the ordinary?
The Ecoinometrics newsletter decrypts Bitcoin’s place in the global financial system. If you want to get an edge in understanding the future of finance you only have to do two things:
Click on the subscribe button right below.
Done? That’s great! Now let’s dive in.
Comparing corrections
Some people seem to complain that Bitcoin can’t be a good investment because it has relatively frequent large corrections.
To that I say “hold on!” Have you compared Bitcoin’s drawdowns to those of similar assets?
I mean Bitcoin’s detractors often talk about volatility, big corrections and so on... like Bitcoin lives in a vacuum. But what are the alternatives? Do large corrections only affect Bitcoin? Is it an anomaly in the investment world?
Well, let's find out.
For comparison I’ve taken:
Gold starting in 1951. We are using the London Gold Fixing price as our daily price reference for all calculations.
The top 10 largest stocks by market cap that are traded in the US. These are at the time I did this analysis (in no particular order) Apple, Amazon, Taiwan Semiconductor, Microsoft, JPMorgan, Google, Tesla, Alibaba, Facebook and Berkshire-Hathaway.
For Bitcoin my reference date is the time of the 1st halving.
For sure this isn’t an exhaustive list. But that should be enough for what we are trying to do. After all, the market cap of Bitcoin is in the same ballpark as this selection of stocks. And Bitcoin is digital gold so I guess it is a relevant point of comparison too.
First stop, let’s take a look at all the drawdowns larger than 10%. We’ll call them significant drawdowns.
Are Bitcoin’s corrections much larger than other assets?
The answer is no.
Take a look.
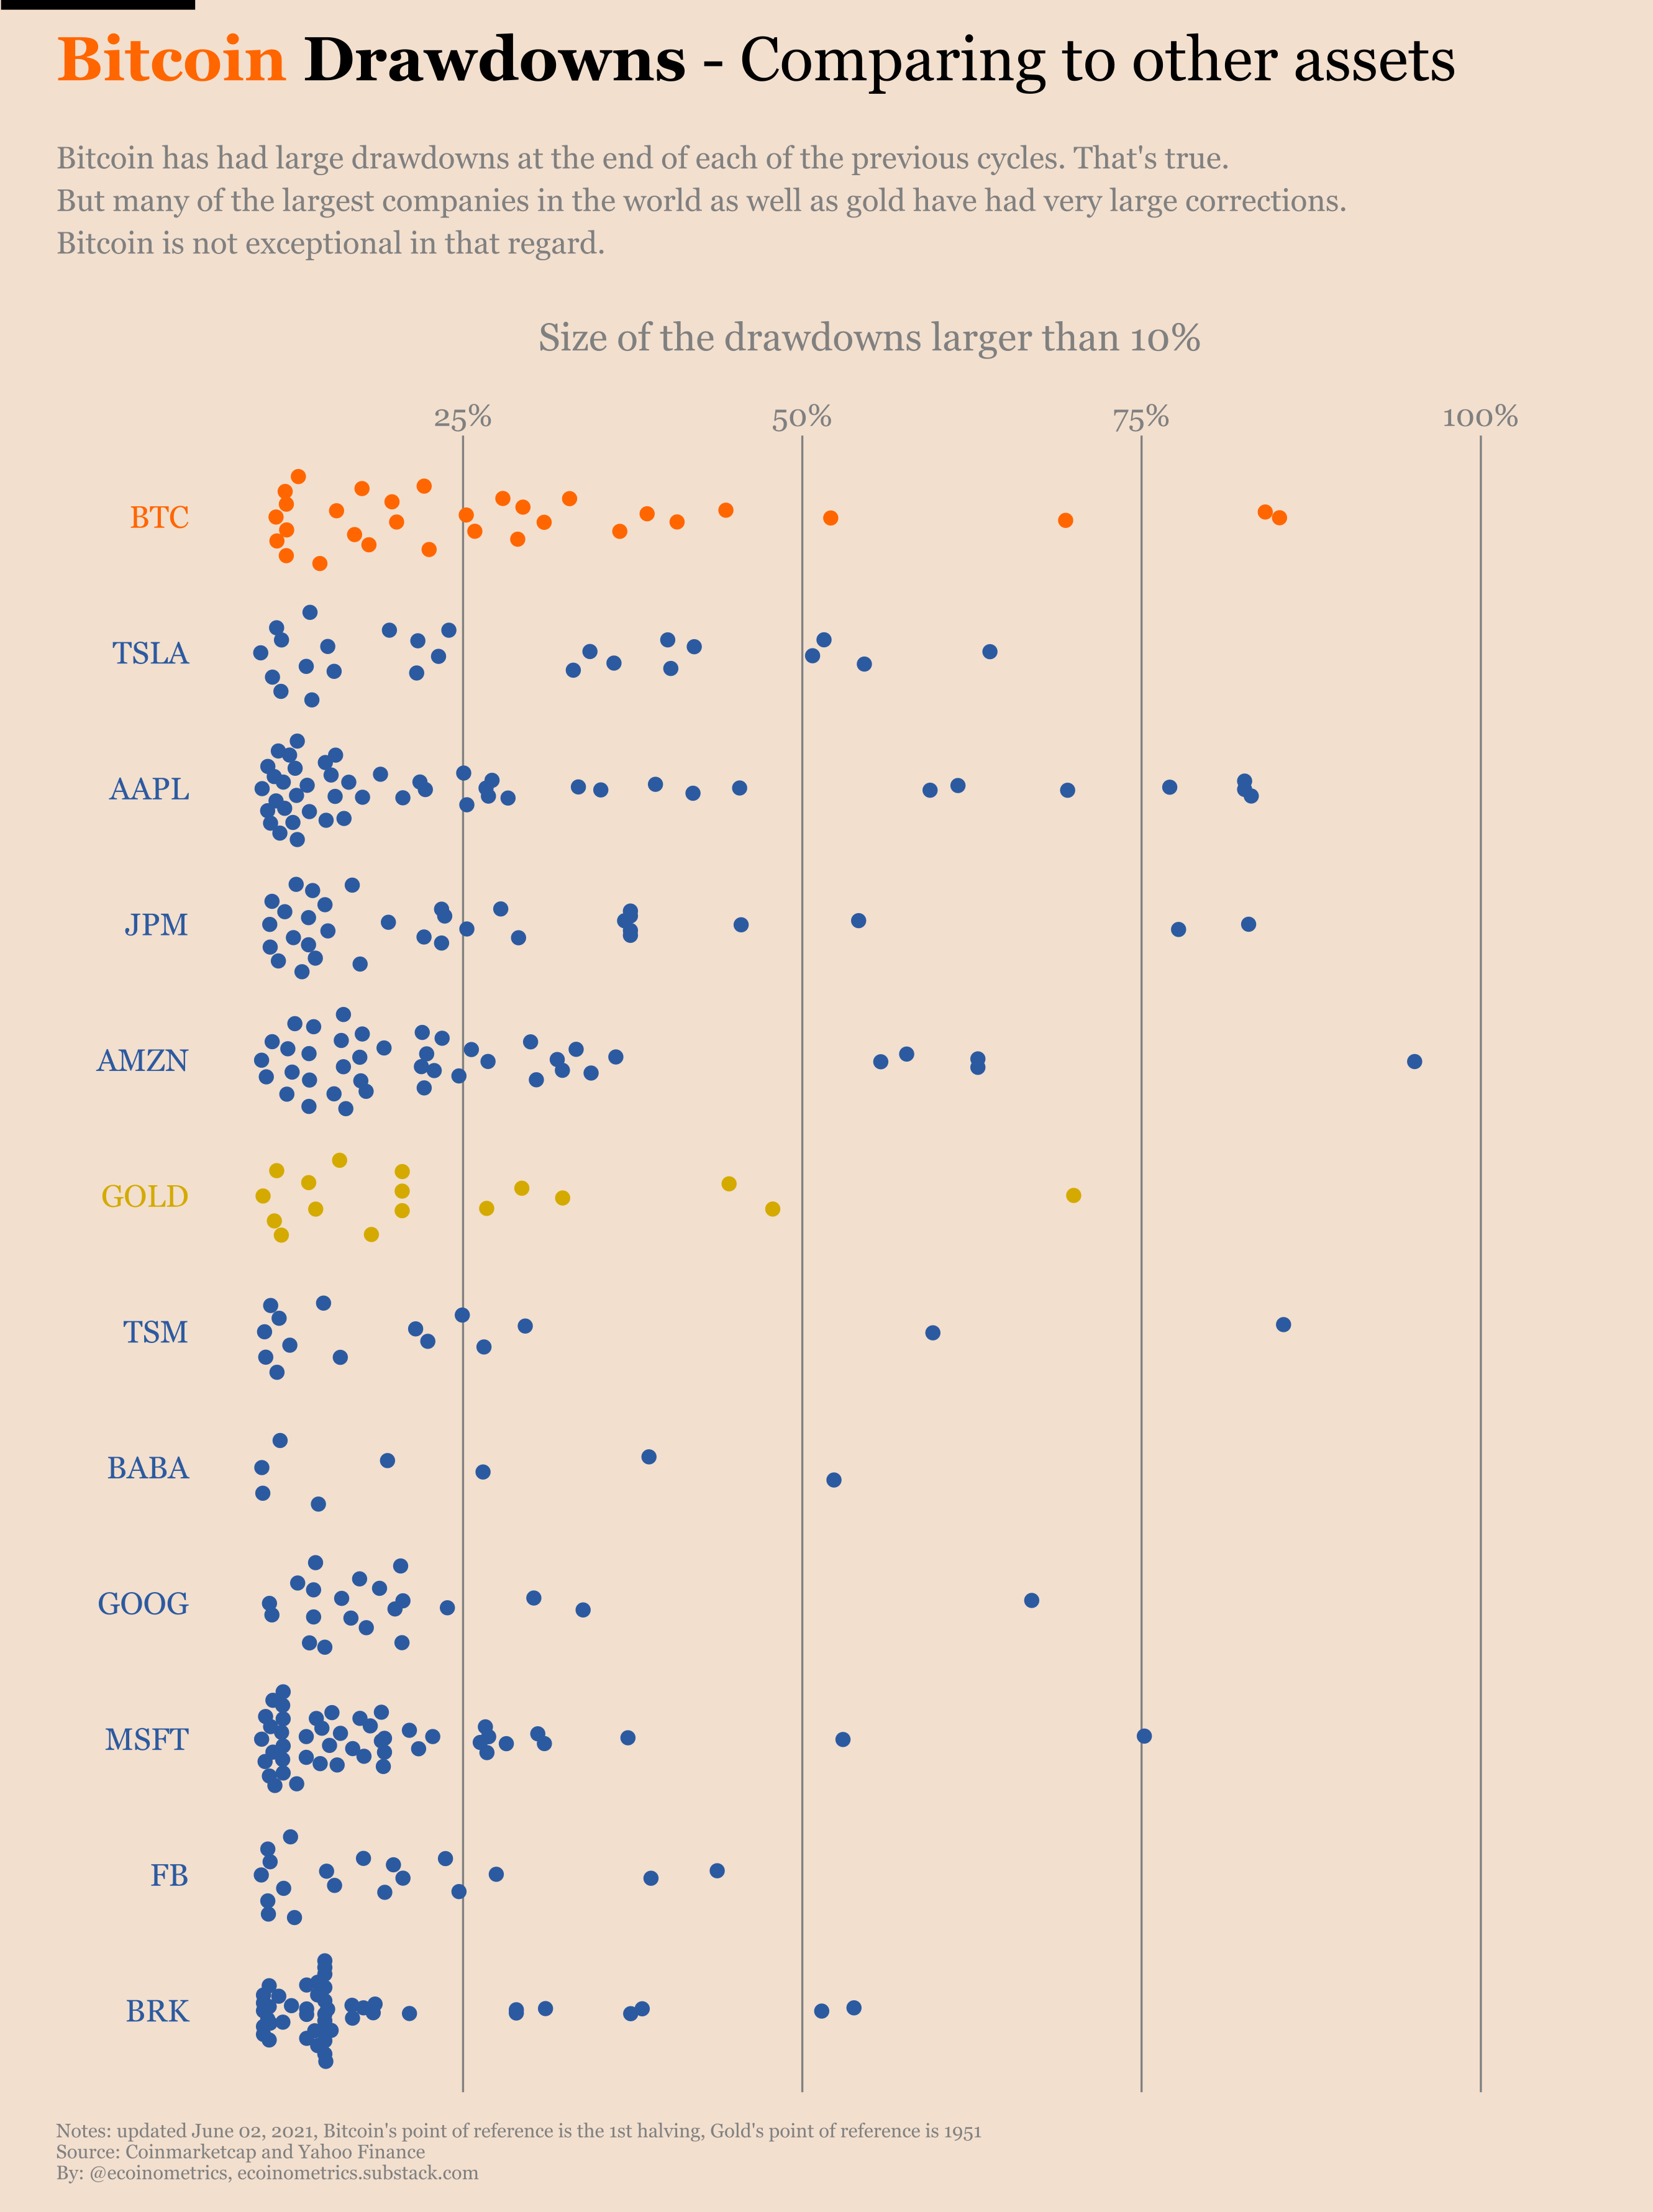
Apple, JPMorgan, Amazon and others have had to weather drawdowns larger than -75%... and you see that along the way all those assets have had to deal with a number of significant drawdowns over the years.
So yes, Bitcoin is volatile. But it does not really stand out when it comes to the size of those corrections.
Actually we can look at this data in a slightly different light. For each of those assets take the largest drawdown in their history. At the same time calculate their total return (from IPO for stocks, from Jan. 1951 for gold and from the 1st halving for BTC) until now.
The chart below shows those largest drawdowns (horizontal axis) and the relative size of the total returns as the area of each point.
Check it out.

Only Berkshire-Hathaway really stands out. Its largest drawdown is relatively mild in comparison to its total return. Good job Warren Buffet.
But Bitcoin does not stand out in a bad way. It has had drawdowns as large as Apple or JPMorgan but still smaller than Amazon. At the same time its total return is impressive by comparison.
So again here Bitcoin does not seem special.
Hmm… how about we look at the duration of those drawdowns?
In the chart below you can see the duration of all the significant drawdowns on the horizontal axis (in log scale). The vertical axis represents the size of the corrections.
To keep it readable I’ve merged all the stocks into a single class coloured in blue.
Now we see something interesting...

First checkout gold. I mean Peter Schiff sometimes talks about Bitcoin being in a bear market for a couple of years and how bad it is… but gold. Gold made an all time high in the early 80s before the US managed to control inflation. You then had to wait 27 years to see a new ATH…
At least Bitcoin has the four year halving cycles that provide a natural catalyst for bull markets so you won’t have to wait a quarter of a century for some action.
Second observation: plenty of stocks have spent years stuck into significant drawdowns.
What is true about BTC is that over short periods of time it looks more volatile than the rest. You can spot that by noticing that the orange points tend to be on the lower band formed by all the drawdowns.
All in all that isn’t so surprising. BTC is growing very fast which means it is more likely to have those counter movements on the way up.
But what’s interesting is that Bitcoin still does not stray far away from the pack.
Conclusion, Bitcoin is not exceptional. Many of the largest assets today have had to endure large and prolonged drawdowns. So no need to sweat it. Focus on the long term.
CME Bitcoin Derivatives
That’s it. After 3 weeks of getting the Commitment of Traders data piece by piece, we finally have a complete picture of how traders were positioned around the crash that brought BTC to where we are now.
Maybe you thought that the smart money massively deleveraged their positions. Wrong!
Maybe you thought that retail traders are now completely bearish. Wrong!
So what happened then? Well the story goes like that:
After the first drop, retail traders literally puked their long positions. But now they are getting back in the game. The mood seems to be that we’ve probably found a bottom in this correction.
For the smart money it is as if nothing happened. If you looked at the state of long and short positions without being aware of Bitcoin’s price action over the same period you wouldn’t have guessed BTC dropped like -35%.
See for yourself.


One notable fact is clear when you split the smart money in sub-categories. The asset managers, which are typically making directional bets, have started buying the dip (or at least closing their shorts).
So although it isn’t obvious if you spend your day on Twitter, it looks like the sentiment might slowly be turning.

When it comes to the trading activity, the CME Bitcoin futures have been very quiet around the long weekend. The open interest as measured in number of contracts is still on a downtrend. No new record in traded volume.


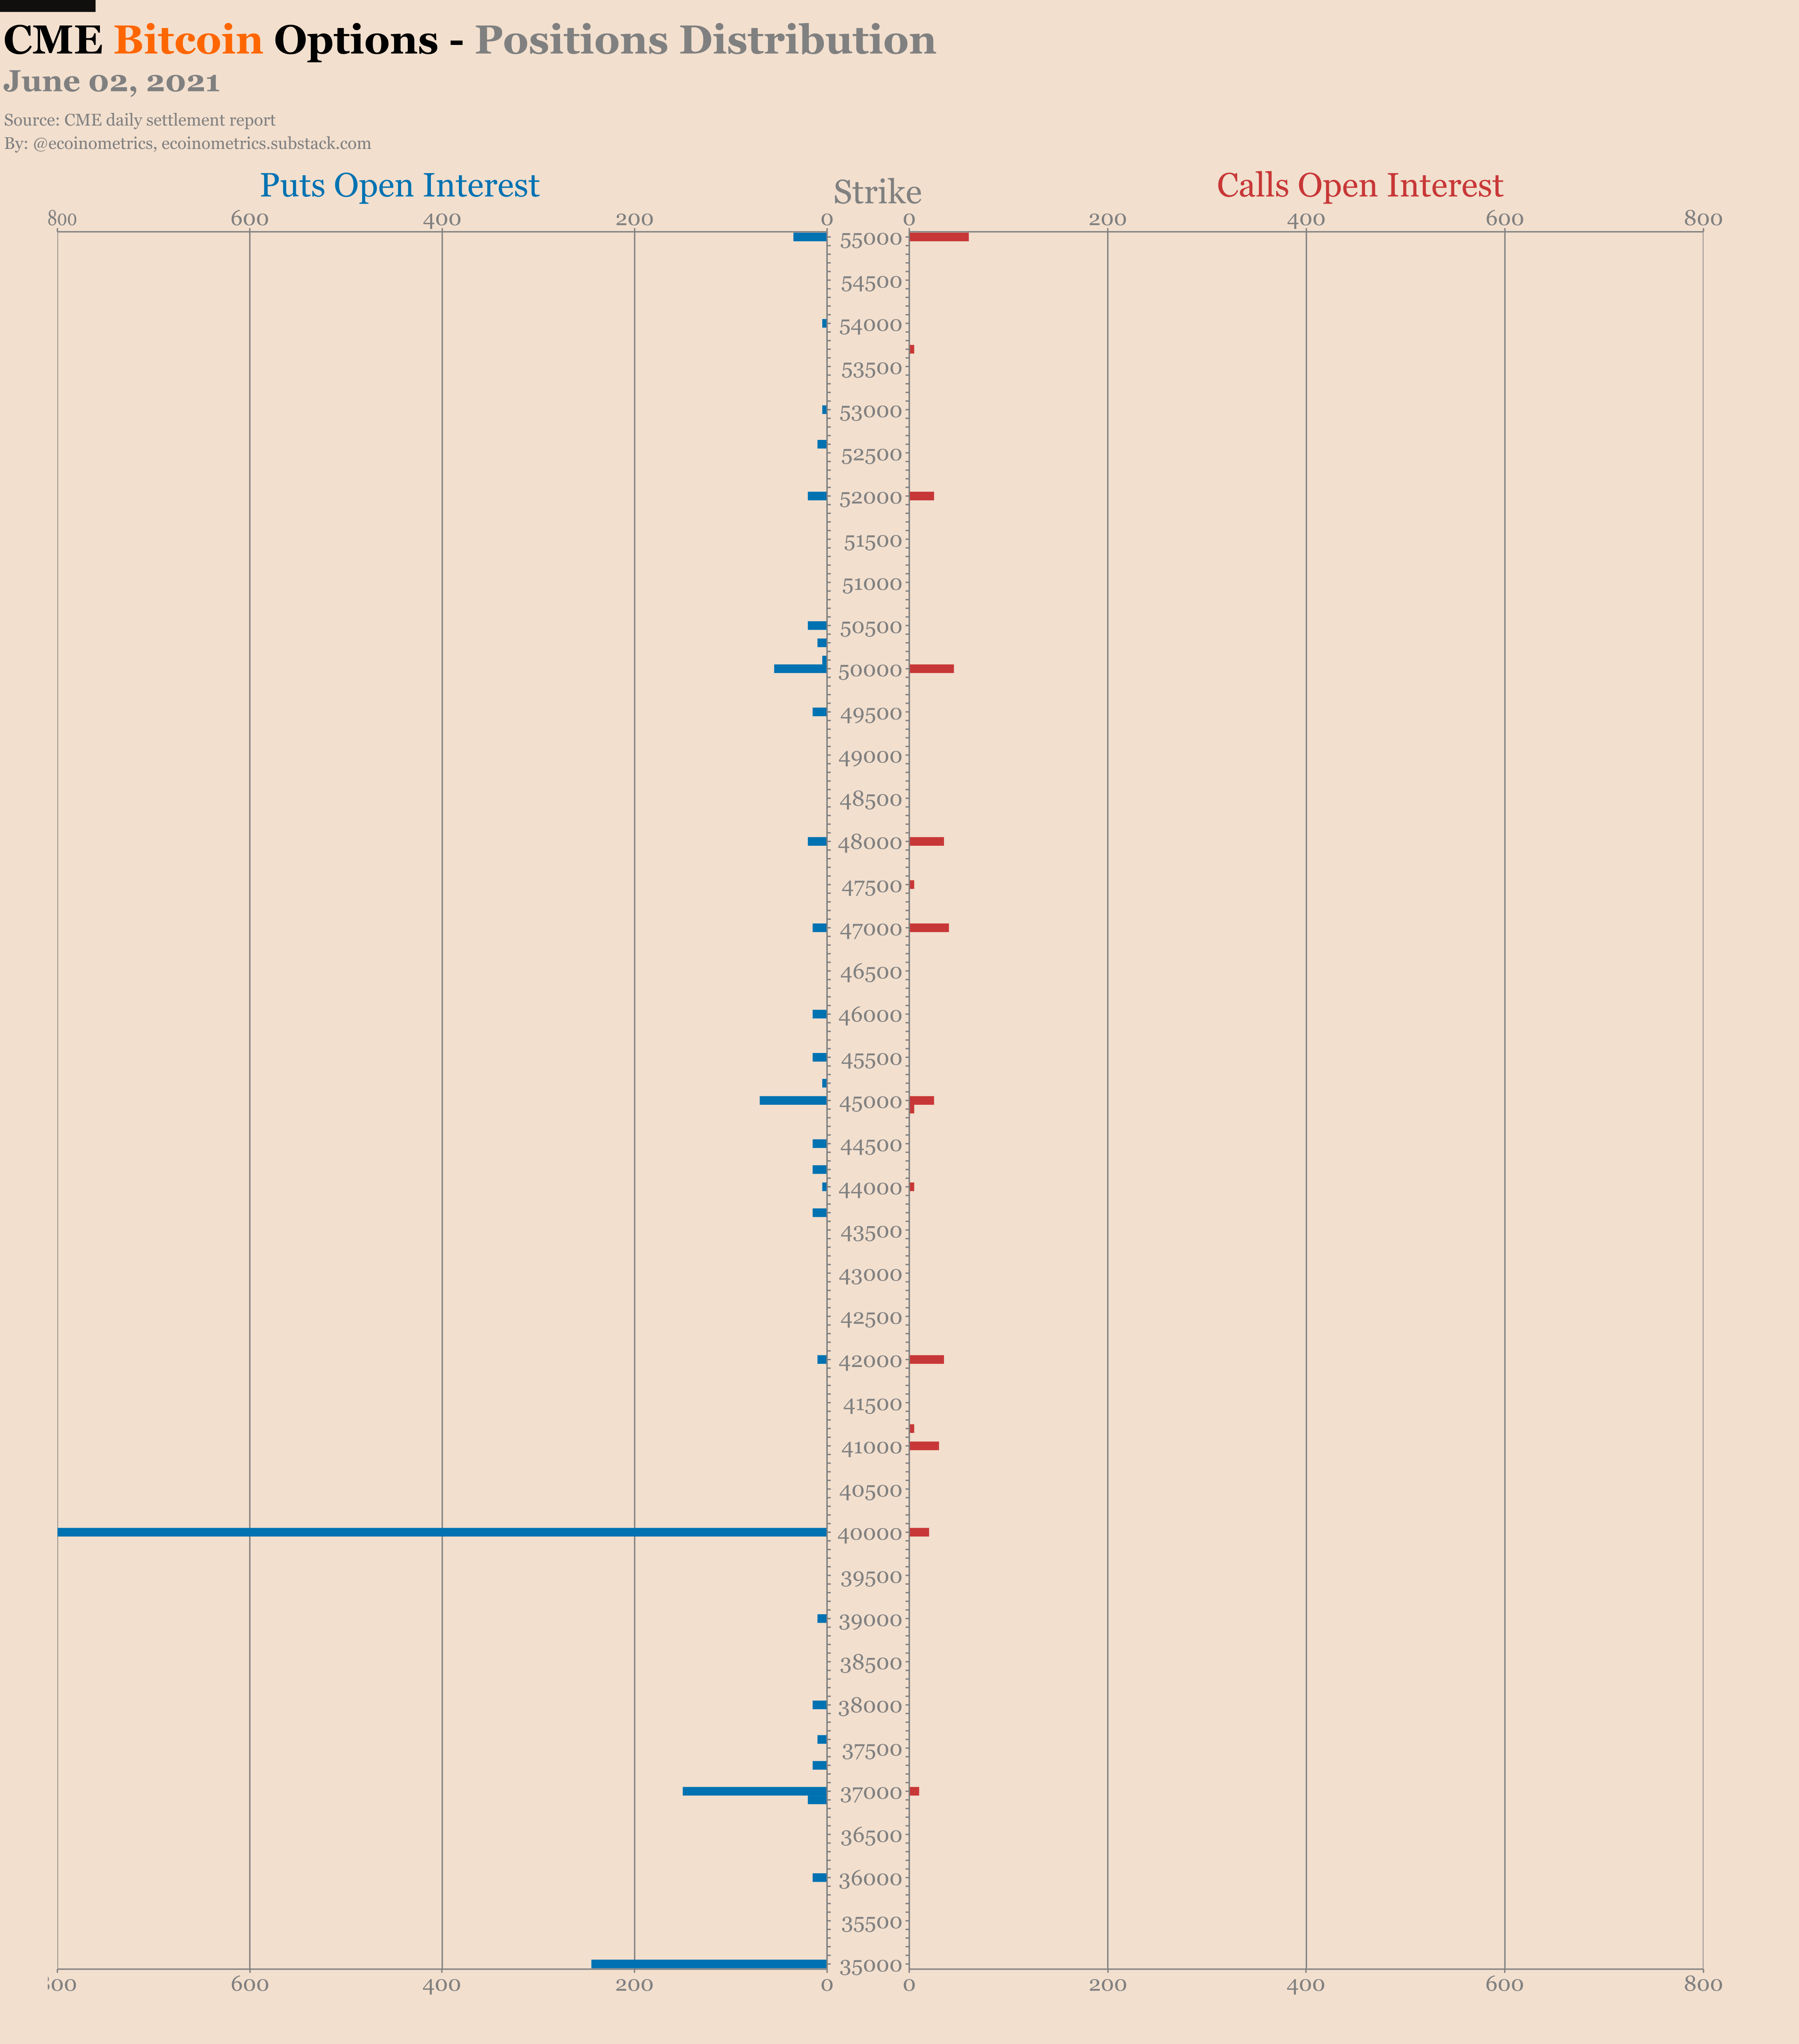
The May’21 contract expired at the end of last week. As a result we are now left with an ever shrinking options market and a record high 2-to-1 puts to calls ratio.
In other words, options traders are not rushing to buy calls. The sentiment is bearish or at least very cautious.
Let’s see how that plays out.

That’s it for today. If you have learned something please subscribe and share to help the newsletter grow.
Cheers,
Nick
The Ecoinometrics newsletter decrypts Bitcoin’s place in the global financial system. If you want to get an edge in understanding the future of finance you only have to do two things:
Click on the subscribe button right below.
Done? That’s great!
Great job, Nick.
The trick you used here in the article is how you twisted the definition of 'volatile'.
You are simply using drawdowns which differ to what we actually call volatile - the price swings where it surges (pump) and plunges (dump) within a short period of time with parabolic intensity.
You also exploit the old Amazon -90% crash (during the irrational dot com bubble era where Amazon was hardly much of a book seller) to compare with bitcoin. Even though it's the same name, the business profile now has changed completely.
Indeed Bitcoin and cryptos has the most volatile price movement ever in human history.
Especially the alt coins.