Bitcoin is too risky... Bitcoin is too volatile... Bitcoin is a scam... Bitcoin is a bubble…
No.
Bitcoin is off the charts...
The Ecoinometrics newsletter decrypts Bitcoin’s place in the global financial system. If you want to get an edge in understanding the future of finance you only have to do two things:
Click on the subscribe button right below.
Follow Ecoinometrics on Twitter.
Done? That’s great!
Now let’s dig in.
Off the charts
When you have to manage a portfolio there are two things you don’t look at in isolation: returns and volatility.
The game is all about risk adjusted rewards:
If the investment looks volatile, is the reward worth putting up with this volatility?
If the investment has low returns, is the volatility low enough that I can apply a lot of leverage?
That and correlations between your other investments are the only things you should really care about when it comes to performance.
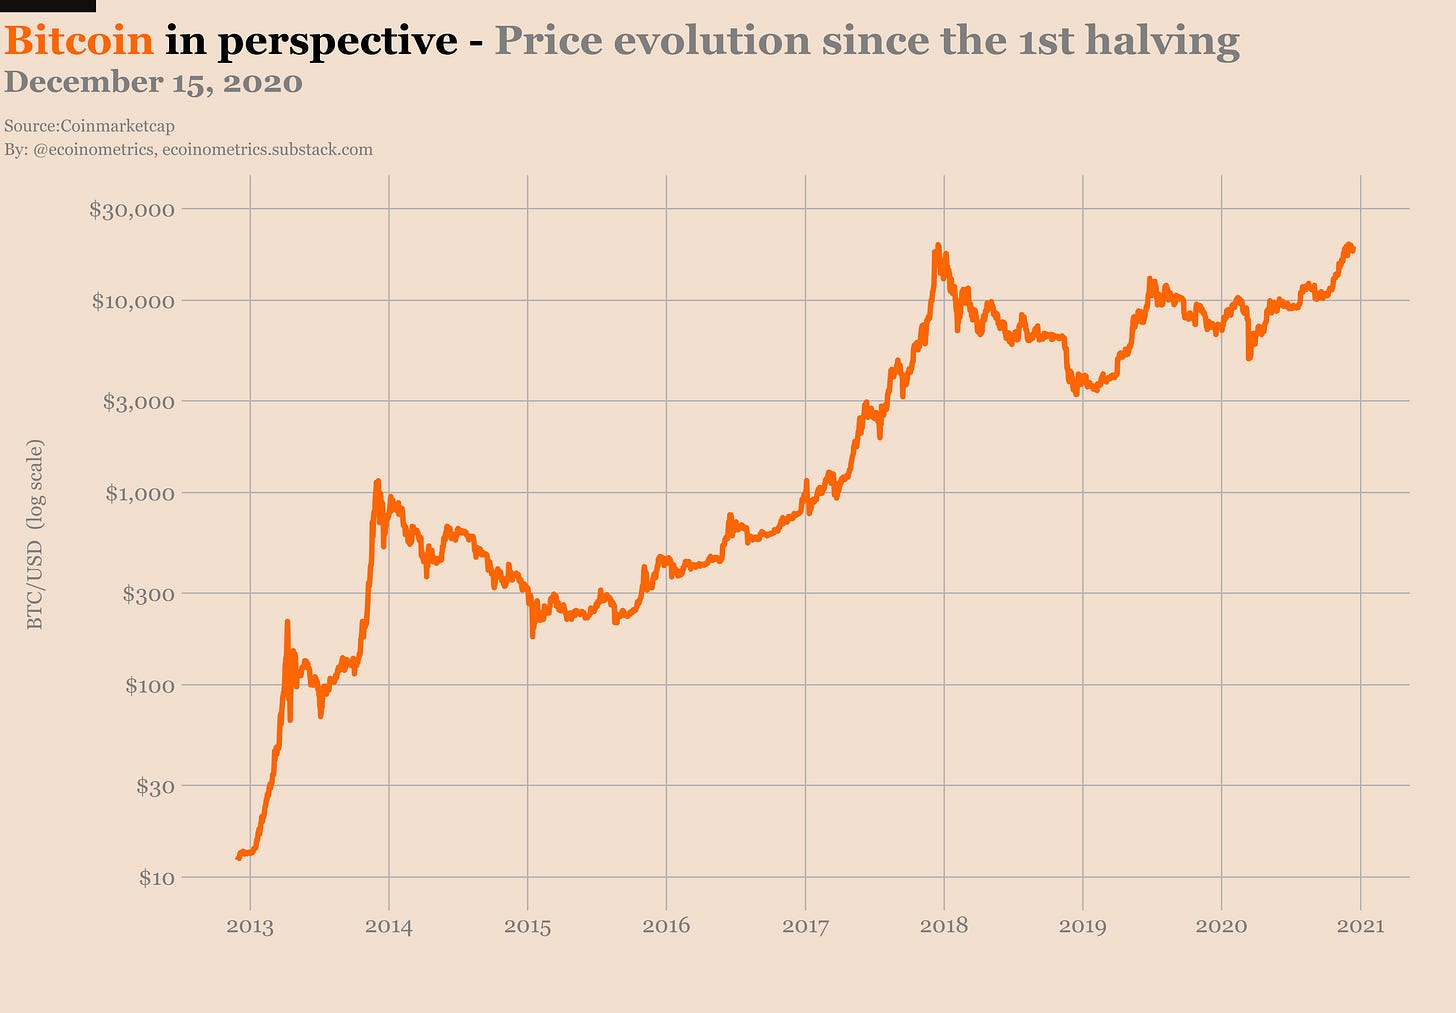
Obviously nobody is complaining about the total Bitcoin returns. From $10 at the time of the 1st halving to $20,000 only 8 years later. That’s pretty solid.
But what about the volatility?
It all depends what your point of comparison is. Let’s pick a few stocks / ETFs and see how Bitcoin looks like in comparison.
In case you aren’t familiar with the tickers, take that as a reference:
For “tech stocks” AAPL is Apple, AMZN is Amazon, GOOG is Google/Alphabet, NFLX is Netflix and TSLA is Tesla.
AGG is the ETF tracking the US investment-grade bond market.
QQQ is the ETF tracking the NASDAQ.
SPY is the ETF tracking the SP500.
VTI is the ETF tracking the total US stock market.
Gold is added to be more or less complete.
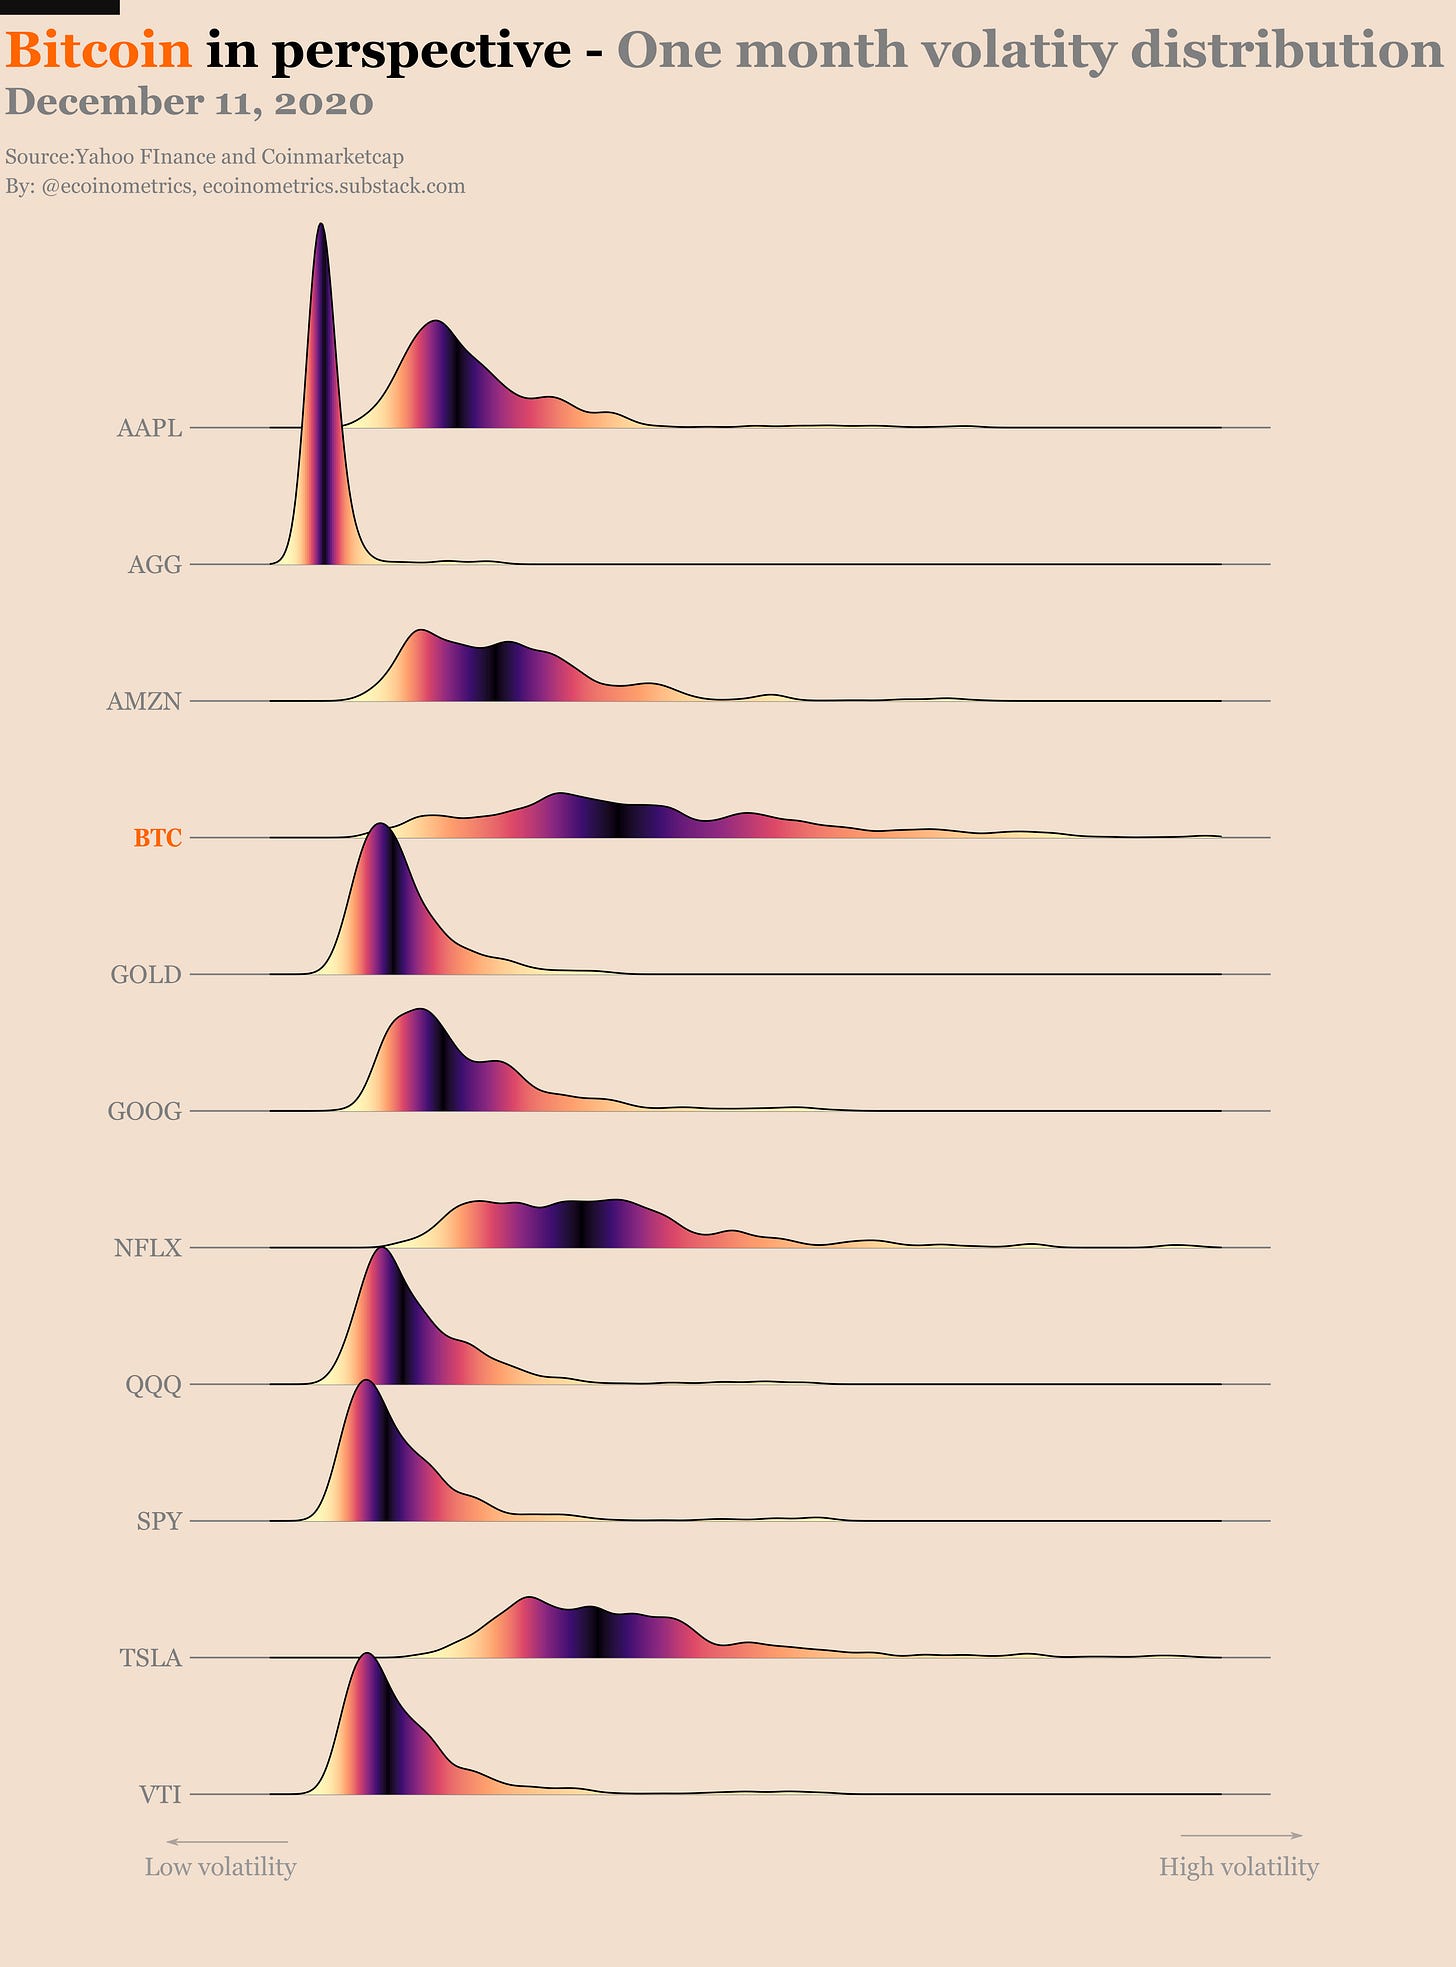
Now checkout the distribution of the one month volatility for those assets.
The further the distribution is shifted to the right the more volatile it is. The darker the colour the closer you are to the mean of the distribution.
For sure Bitcoin is volatile with a pretty long tail to the right.
But it isn’t much more volatile than Netflix or Tesla. Even Amazon has a big overlap with the volatility distribution of Bitcoin.
So at least investors in the tech sector shouldn’t be discouraged by that.
The ETFs together with gold and the older stocks like Apple and Google have a less volatile history and a more concentrated distribution.
But as I said earlier you can only really compare those in terms of risk adjusted rewards.
Most of you will have heard of the Sharpe ratio as a measure of risk adjusted returns. The Sharpe ratio compares the average return of an asset to the variation of those returns.
You don’t need to check out the formula for this discussion. Just remember that:
The larger your average return and the smaller your volatility, the bigger your Sharpe ratio.
For two assets with the same average return, the asset with the smallest volatility has the biggest Sharpe ratio.
Plot twist! I won’t be using the Sharpe ratio here.
The issue I have with this metric is that it penalizes upside volatility as much as downside volatility. But nobody I know ever complained about upside volatility…
So instead we’ll be using the Sortino ratio. The idea is very similar though. The Sortino ratio compares the average return of an asset to the variation of its negative returns.
That means the Sortino ratio only penalizes your asset for downside volatility.
I find it to be a more appropriate metric when you need to consider asymmetric bets which by definition have large upside volatility that you definitely do not want to penalize.
Except for that important detail the idea is the same:
The larger your average return and the smaller the variation of your downside volatility, the bigger your Sortino ratio.
For two assets with the same average return, the asset with the smallest downside volatility has the biggest Sortino ratio.
The smaller the Sortino ratio, the lower your risk adjusted reward.
The bigger the Sortino ratio, the larger your risk adjusted reward.
So how is Bitcoin compared to other assets using this metric?
Let’s look at different scales.
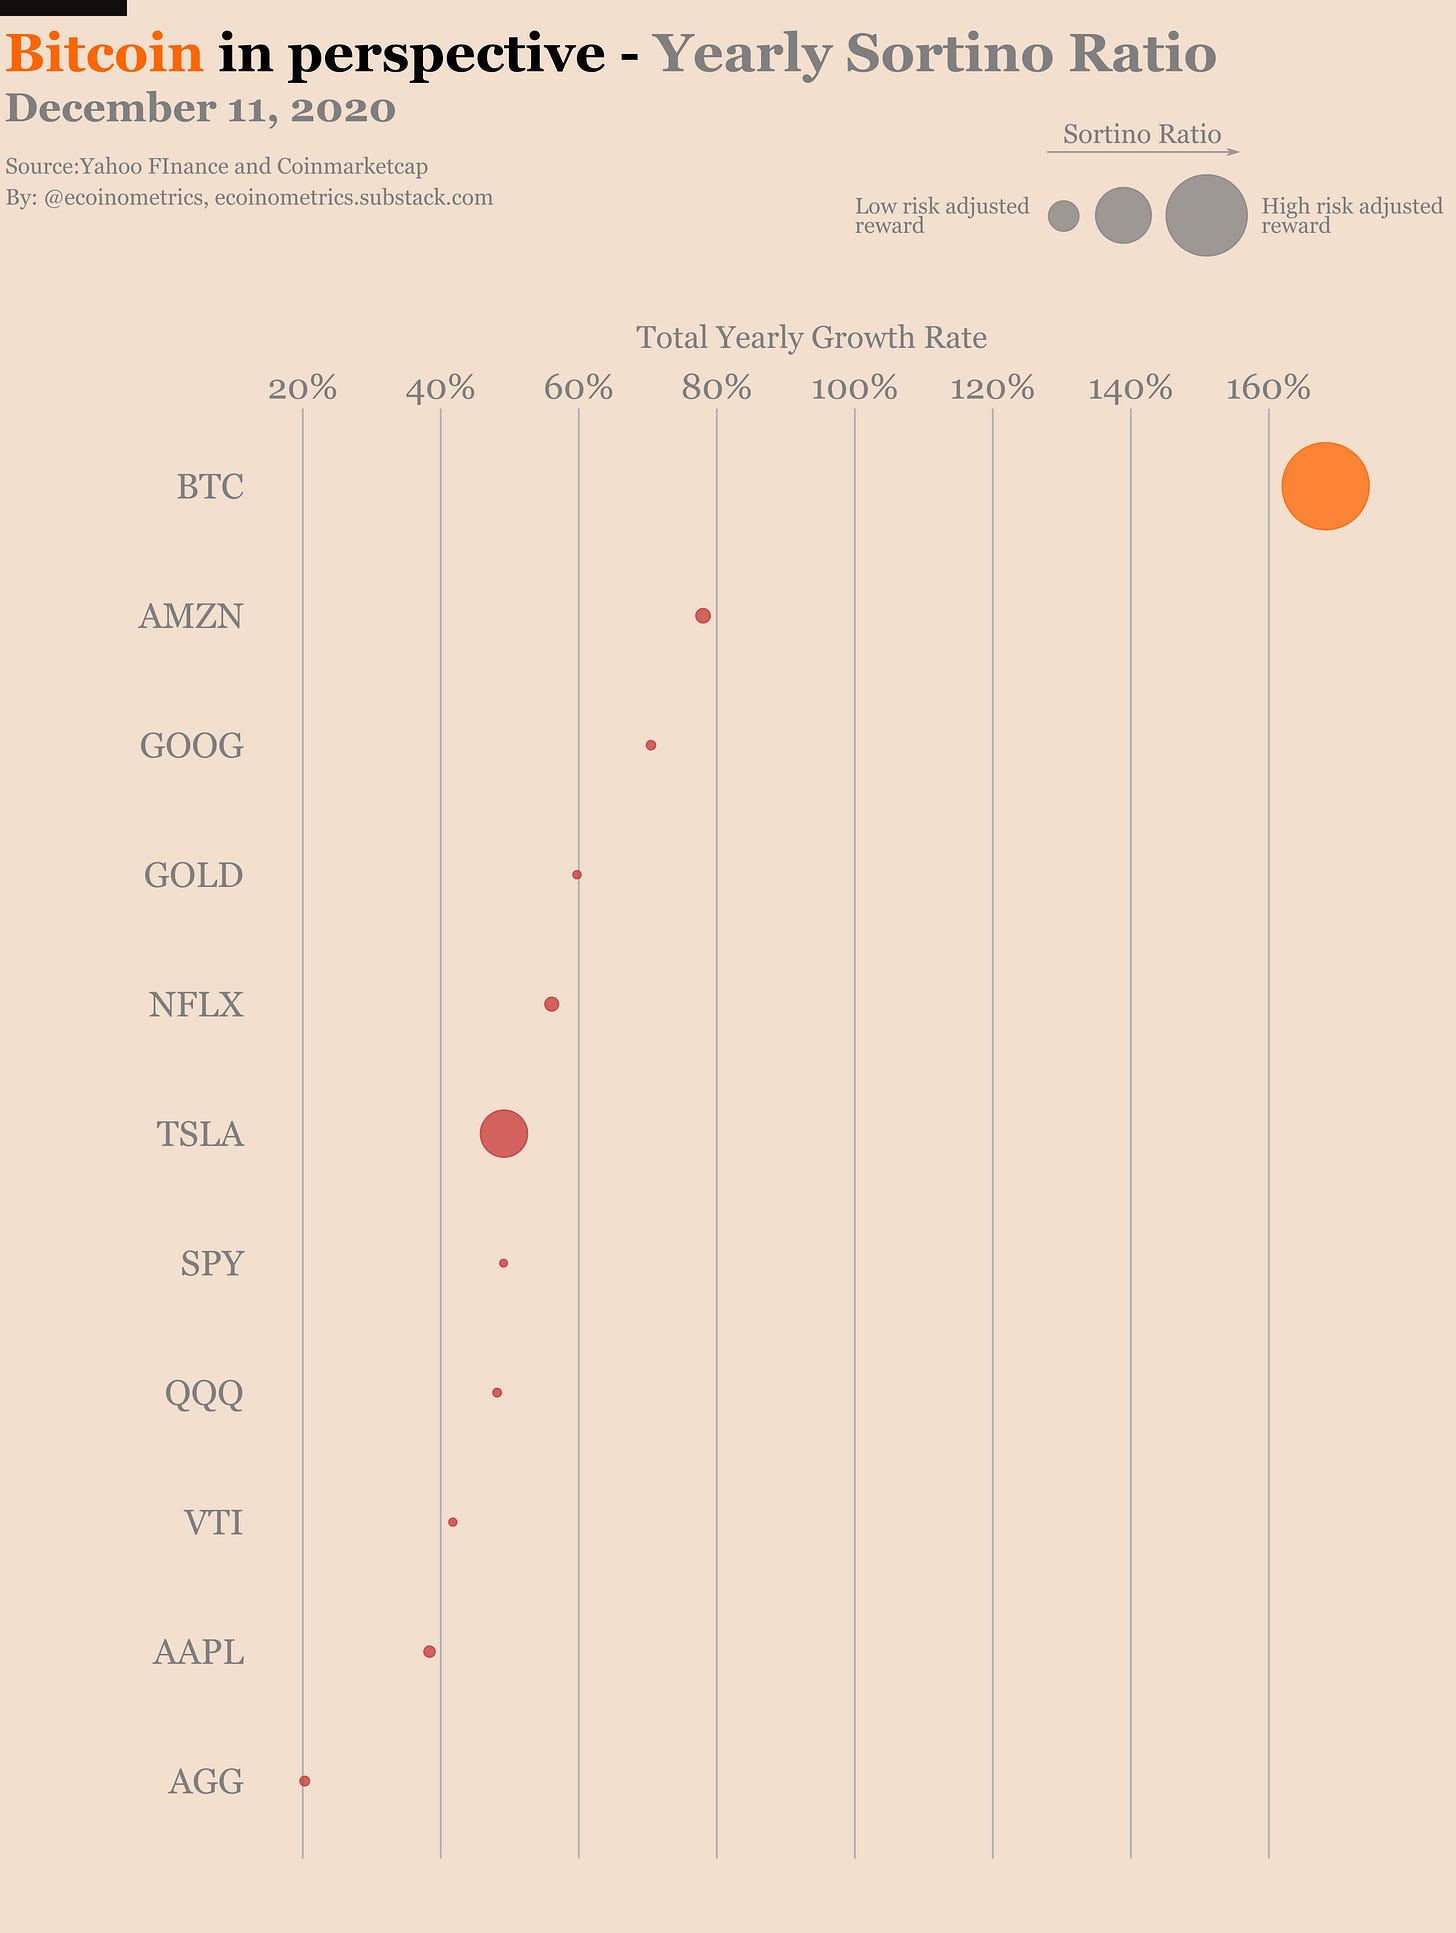
If we break down the performance of Bitcoin on a yearly basis we find that BTC has been growing at an annualized rate of more than 160%.
And it did that with the best risk adjusted reward by a massive margin.
What about a breakdown by quarters? Bitcoin has been growing at a rate of more than 30% per quarter.
Again at this scale it has the best risk adjusted reward in the market. Tesla has the second largest Sortino ratio but its quarterly growth is only half of that of Bitcoin.
Finally even at the monthly scale Bitcoin has the best risk adjusted reward of them all and is also the one growing the fastest.
The picture is clear. At all scales Bitcoin is growing the fastest and has the best risk adjusted returns.
There are no excuses for not including Bitcoin in your portfolio. With a properly sized position BTC is no more risky than any other investment.
CME Bitcoin Derivatives
The same scenario has been playing out for weeks on the CME Bitcoin futures. I’m starting to run out of different ways of saying the same thing.
So let’s keep it brief and to the point.
The open interest is stuck below 60,000 BTC and the daily traded volume is staying desperately low.
The December contracts expire next week and that might create some temporary upside in volume for the rollover like it did last month.
Note that the calendar spreads are getting pretty wide already. The rollover might end up being costly this time around.
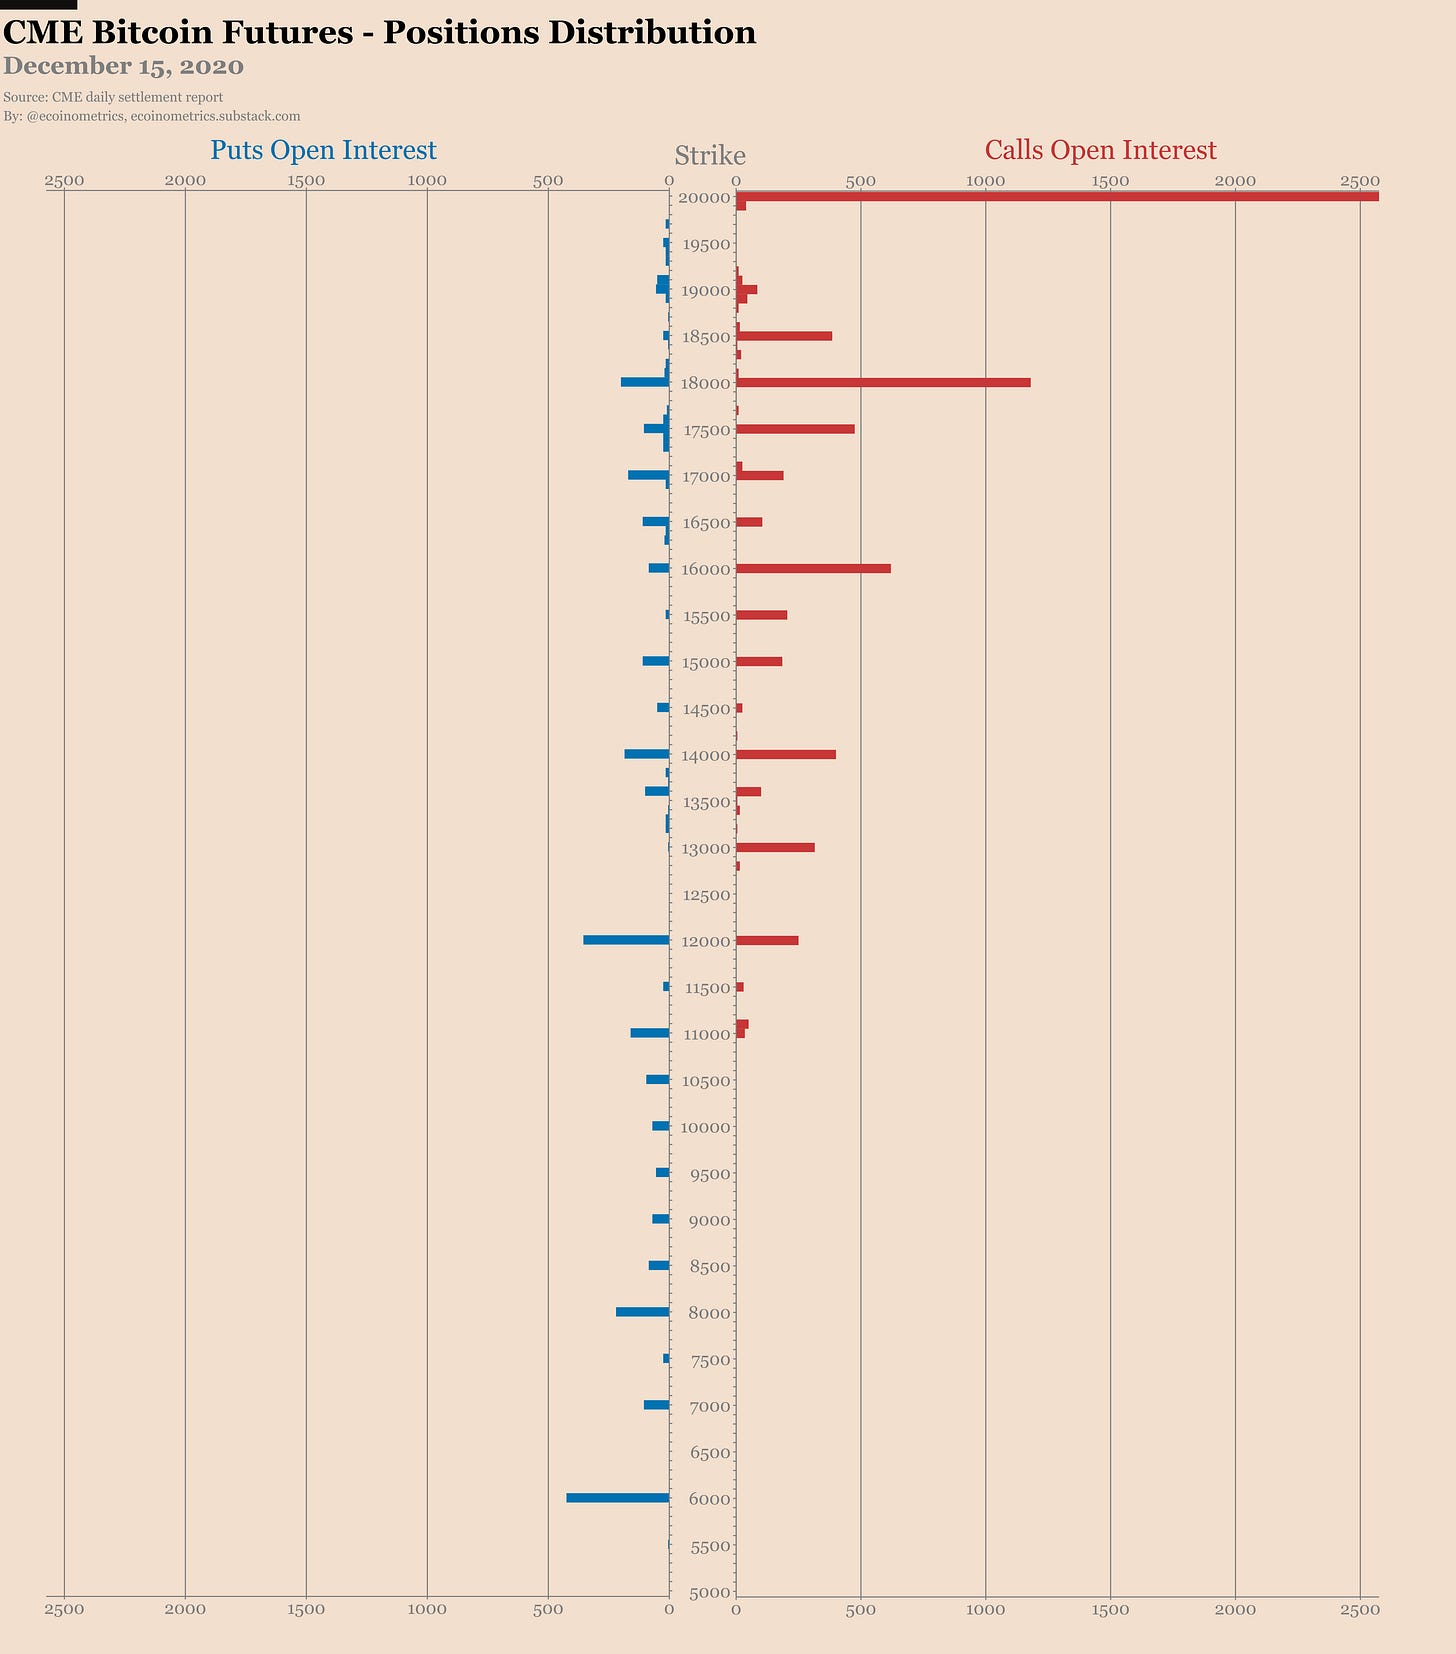
For the options more than half of the calls on the December contract are already in the money with BTC above $19,500.
But there is a big stack of calls sitting at the $20k strike that are just waiting for a small pump. That would be nice to get those in the money, you know… in the spirit of Christmas.
Otherwise the trading activity remains desperately low in the options market.
For the positions of traders:
Retail traders are of course net long but they aren’t pushing anything.
The smart money is record net short mostly due to some liquidations of long positions.
The trend of asset managers adding to their long positions is definitely dead.
Always the same story.
The basis trade completely dominates the action on the CME futures.
This is probably going to last as long as the premium over spot BTC continues to be so juicy since nobody has taken to using the futures for momentum strategies.
That’s it for today. If you have learned something please subscribe and share to help the newsletter grow.
Cheers,
Nick
The Ecoinometrics newsletter decrypts Bitcoin’s place in the global financial system. If you want to get an edge in understanding the future of finance you only have to do two things:
Click on the subscribe button right below.
Follow Ecoinometrics on Twitter.
Done? That’s great!


Hi! For your Sortino charts, can you share the actual values for each time scale? Also, am I correct in assuming the analysis covers inception-to-date?