The Federal Reserve is in charge of the monetary policy in the US. It is good to remember that they aren’t supposed to do whatever they want though.
The Fed is supposed to help the country achieve certain goals. And it turns out we might be pretty close to reaching one of those: the CPI inflation target.
The Ecoinometrics newsletter decrypts Bitcoin’s place in the global financial system. If you want to get an edge in understanding the future of finance you only have to do two things:
Click on the subscribe button right below.
Done? Thanks. That’s great! Now let’s dive in.
Federal Reserve inflation target
So what are the goals of the Federal Reserve?
Their mandate says that the guiding principle behind the monetary policy they pursue should be: achieve maximum employment, stable prices and moderate long-term interest rates.
Now of course if you try to formalize what those goals mean in practice, everything becomes a little bit fuzzy.
What is maximum employment?
An appropriate definition might be: the situation where everyone looking for a job can find one in a reasonable amount of time.
Who is actually looking for a job and what’s a reasonable amount of time vary of course. You can always modify the definition to whatever suits the narrative.
What about moderate long-term interest rates?
Well here again something reasonable might be:
Interest rates that are not too high so as not to burden the private sector with a debt they cannot service.
But interest rates that are not too low so that you aren’t fuelling a debt bubble (spoiler alert we are already there).
Again hard to pinpoint exactly what range of values that is.
And stable prices?
Ah! Actually, stable prices does not mean stable prices. It means constantly growing prices (because deflation is bad for some reason) but not too fast to avoid people complaining about it all the time.
For this particular goal the Fed has given us some number. As of last year, the goal of the Federal Reserve is to generate an average inflation rate of 2%, key words emphasized.
Alright… I guess it is a bit better than the other goals in terms of precision but actually not by much.
Average over what period? Are we talking CPI inflation, Core CPI inflation, both? Do you mean that the goal is accomplished as soon as the average is hitting 2%? Or is the goal to make sure that the average stays around 2%? If so for how long?
That’s a lot of questions. And keeping all this as vague as possible gives a lot of wiggle room for the Fed to do pretty much whatever they want.
But how far are we from this fuzzy 2% target?
Maybe closer than you’d think.
For the purpose of this discussion let’s focus on the two main forms of inflation:
The CPI inflation. That’s the one you get as the year over year changes in the CPI.
The Core CPI inflation. Which is the same thing as the CPI except you remove from the calculation two of the most volatile price categories which are food and energy.
The Fed likes Core CPI better than CPI because it is more smooth than the full basket of items. Never mind that consumers still need to feed themselves and put gasoline in their cars…
Below is a chart showing the history of inflation and core inflation since the 1960s.
Take a look.
During the inflation burst of the 1970s both inflation and core inflation moved high and fast. But since the mid-80s we’ve got pretty much what you would expect:
Core inflation is moving in a pretty smooth fashion.
CPI inflation is staying close to the core except during volatile times such as when oil prices rise fast or during the financial crisis.
That was until now.
For the past couple of months both inflation and core inflation are on the rise. So much so that we are starting to shoot way above the 2% inflation target.
The Fed should do something then, no?
Ah wait. I forgot, the Fed only cares about average inflation.
Alright. No worries. Let’s look at averages then.
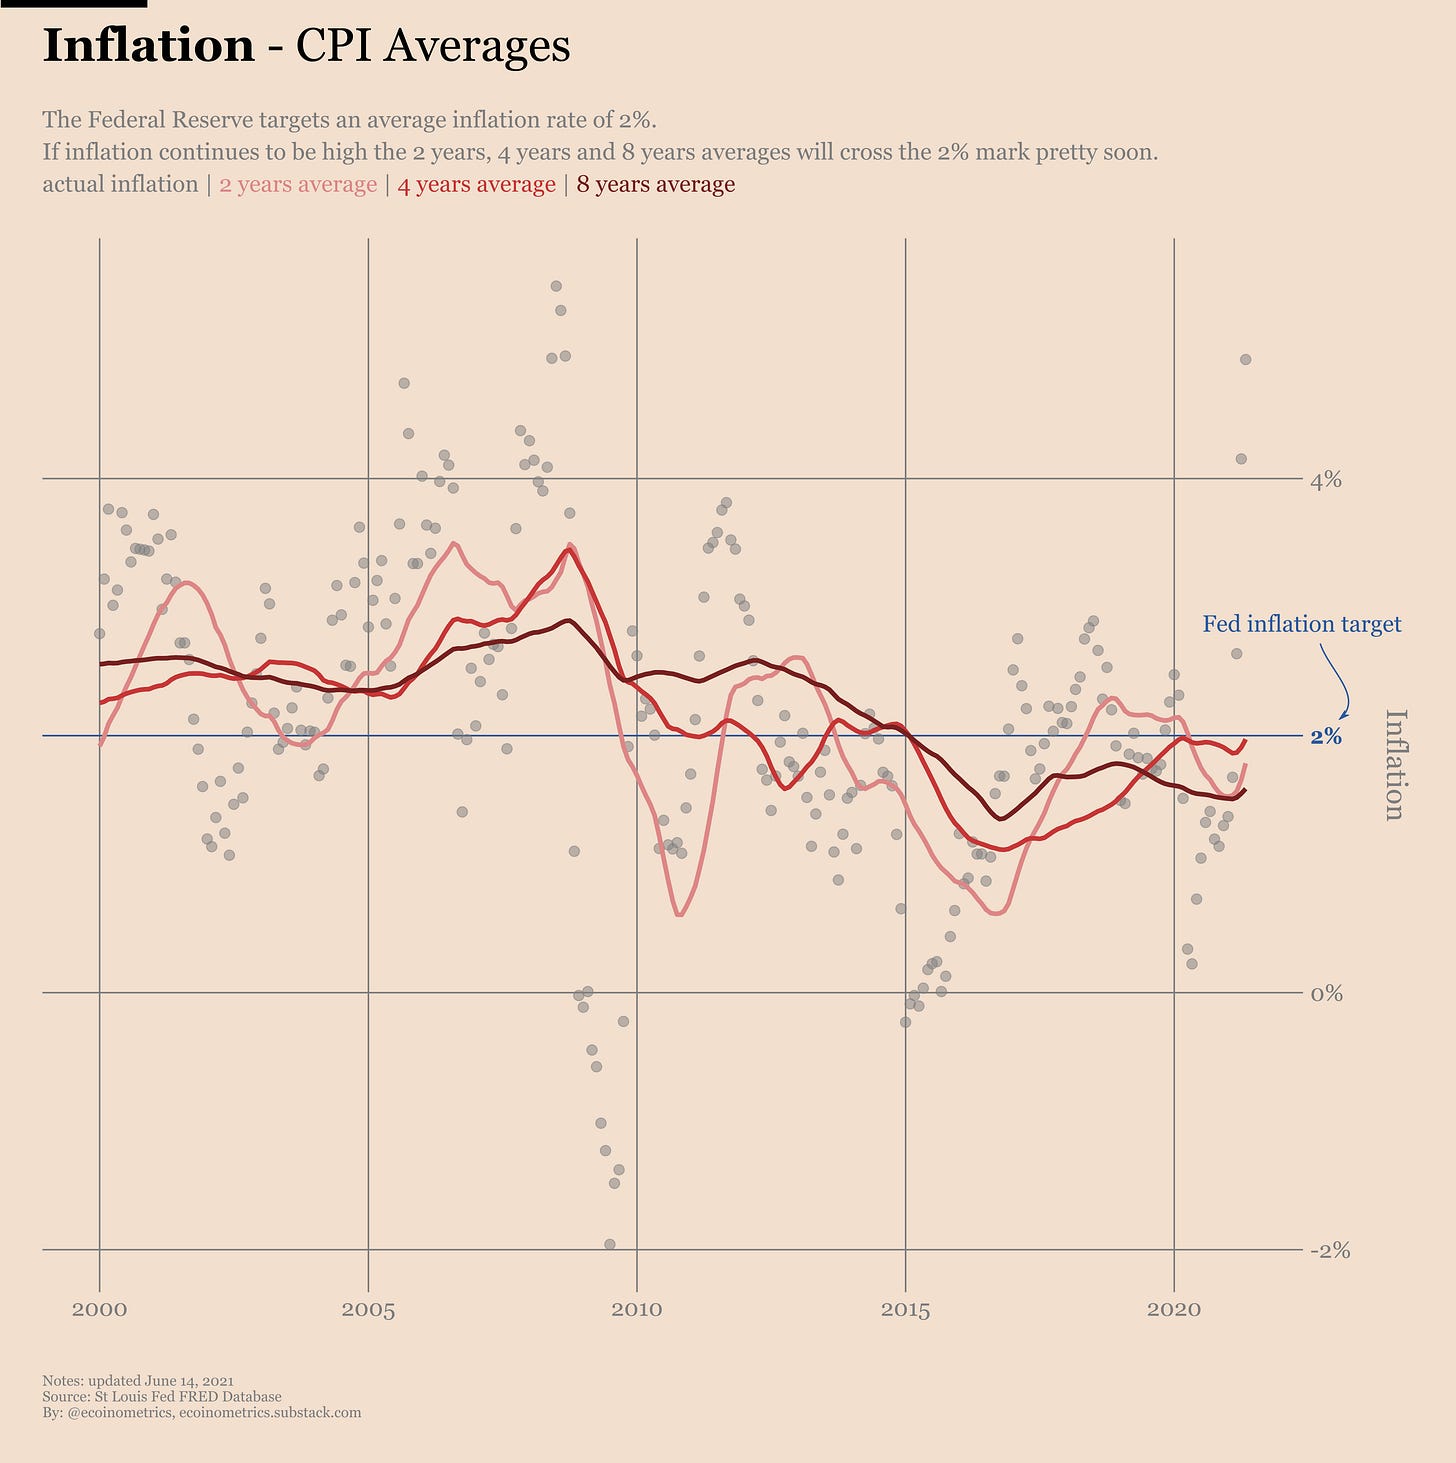
We don’t know what the averaging period used by the Fed is. So to cover some ground we’ll compute the 2 years, 4 years and 8 years averages of the inflation rate.
First stop: CPI inflation.
Check it out.
First observation: until 2010 the average inflation curves spent most of their time above 2% for at least a decade. Apparently people didn’t care so much about that back then.
Second observation: since the 2008 financial crisis those average inflation curves have touched or crossed the 2% target several times. So I guess when the Fed says they haven’t managed to get their 2% inflation target for a long time they must mean Core CPI.
Third observation: whether you look at the 2 years, 4 years or 8 years averages, it seems that we are on course to be back above the 2% target pretty soon.
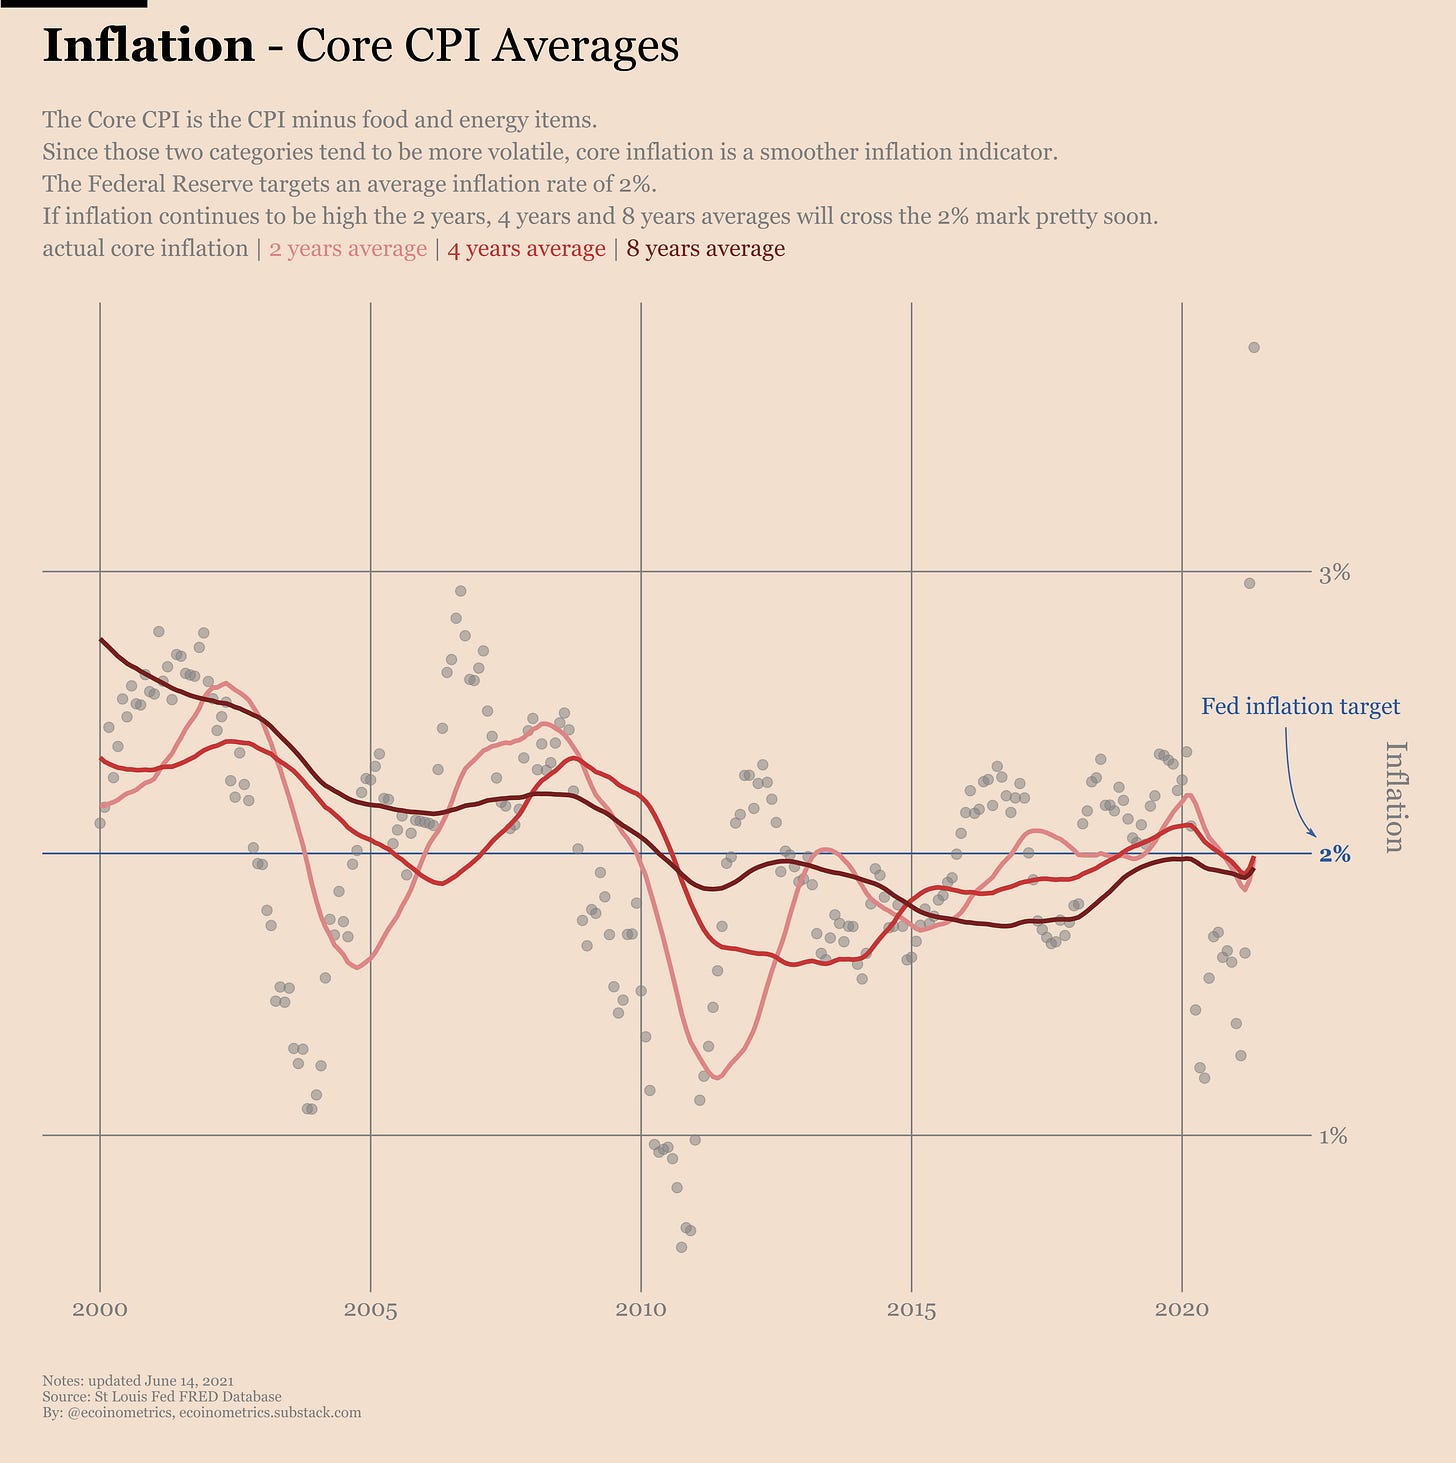
The story is the same with Core CPI. Only difference is that indeed the 8 years average core inflation has stayed below the 2% target for the past 10 years.
Take a look.
So really the only reason we wouldn’t hit the 2% inflation target in the next 6 months is if the inflation spike of the last few months is entirely transitory.
You cannot rule that out completely:
Right now the inflation rate is taking as a reference the depth of the COVID lockdown. At that time the CPI was depressed which means the year over year change looks big. That’s the base effect. How much of the current inflation spike can be attributed solely to the base effect? We’ll see as we move away from March.
A big part of the spike last month was due to a rise in the price of used cars. This could be an effect of the reopening of the US economy and as such might not be sustained.
On the other hand if you have followed the rise of commodity prices you know that raw materials are likely to be more expensive for longer periods of time. And the disruption of the global supply chain will likely have long term impacts on the global economy. That also means higher prices for longer.
So from looking at the data, anything goes.
Anything goes but the bonds market doesn’t seem to take inflation seriously.
Since mid-2020 the 10 year yield has been slowly climbing in anticipation of the reopening of the US economy.
In March of this year the 10 year reached 1.6% which is pretty much the pre-pandemic level.
But since then higher inflation prints have been met with no reaction at all from the bonds market.
Possible reasons for that:
The bonds market sees inflation as transitory.
The bonds market thinks the Fed will step in with yield curve control if the 10-year moves higher.
The Fed is already indirectly keeping the yield capped.
My favourite explanation is the first one. I think the market believes the data is inconclusive when it comes to the lasting power of inflation and they have already priced in the base effect. So there is no reason for yields to rise more at the moment.
And even if the long term rates were to rise the Fed would have no choice but to put some form of yield curve control in place. The US economy is reliant on too much debt to tolerate high rates.
That means we could have a situation with capped rates and relatively high inflation at the same time i.e. a prolonged negative real yield environment.
Historically periods where the real yield has turned negative at the same time as investors were worried about inflation led to bull markets for gold.
Bitcoin hasn’t proved sensitive to real yield over its short existence. But you can make the case that anything that will trigger a bull market for gold would also serve Bitcoin since they are competing for the same use case.
That could be a catalyst for Bitcoin’s next parabolic move. Something we are missing these days.
That’s it for today. If you have learned something please subscribe and share to help the newsletter grow.
Cheers,
Nick


