


Ecoinometrics - How big is it?
Or the importance of putting things in context.

You are busy walking to a meeting when your phone starts buzzing. You take a look at the notifications.
BREAKING: BITCOIN IS DOWN -5% TODAY AFTER JAMIE DIMON SAYS HE DOESN'T LIKE IT.
What on earth are you supposed to do with this information?
Mainstream financial media is full of those kind of reports that are characterized by:
Making things look like a big deal that probably aren't.
Presenting dubious causal relationship between a market move and something that happened on the same day.
Totally lacking context to evaluation whether or not it is even worth paying attention.
The biggest thing in there is the lack of context. Without context there is no data, only anecdotes.
The Ecoinometrics newsletter gives you insights from crypto and macro data to help you make better investment decisions.
Each issue of the newsletter tells you what you need to know in 5 minutes or less, direct to the point, with lots of charts to allow you to quickly visualize what’s important.
Join more than 19,000 subscribers here:
Done? Thanks! That’s great! Now let’s dive in.
How big is this?
What not to do with return data
Let me get back to the our breaking news:
BREAKING: BITCOIN IS DOWN -5% TODAY AFTER JAMIE DIMON SAYS HE DOESN'T LIKE IT.
The main reason this is completely useless is that from this sentence you have no way to really gauge whether or not a -5% day move is significant or not for Bitcoin.
That's because we aren't given any point of reference.
It is like this meme, the answer is it depends.
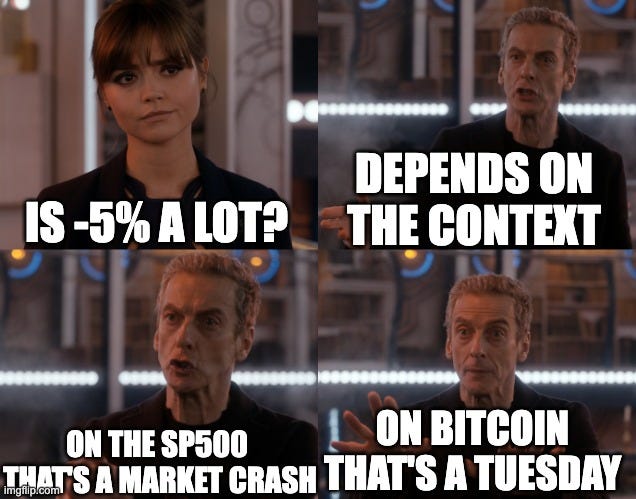
Because different assets exhibit different behaviour. Thus applying what you know about the typical daily variations of the stock market probably won't give you much of a perspective for this Bitcoin move.
In case this wasn't obvious just think about it in terms of volatility. As you can see on the distribution chart below Bitcoin and the SP500 have very different volatility profiles. What is a once in a century move for the SP500 is basically a Tuesday for Bitcoin.

So it is clear you don't want look at a number like that on its own. Instead you want a way of saying is this move typical or not. And for that you need to look at a distribution.
Where do you stand in the distribution
Keep reading with a 7-day free trial
Subscribe to Ecoinometrics to keep reading this post and get 7 days of free access to the full post archives.