


Ecoinometrics - Inflation dynamics
December 13, 2021

We got the latest inflation print for the US and it stings. How long can it continue to run hot? What can the Fed do about it? What is the long term game? Let’s have a look.
The Ecoinometrics newsletter decrypts the place of Bitcoin and digital assets in the global financial system. If you want to get an edge in understanding the future of finance you only have to do one thing, click on the subscribe button right below:
Done? Thanks! That’s great! Now let’s dive in.
Inflation dynamics
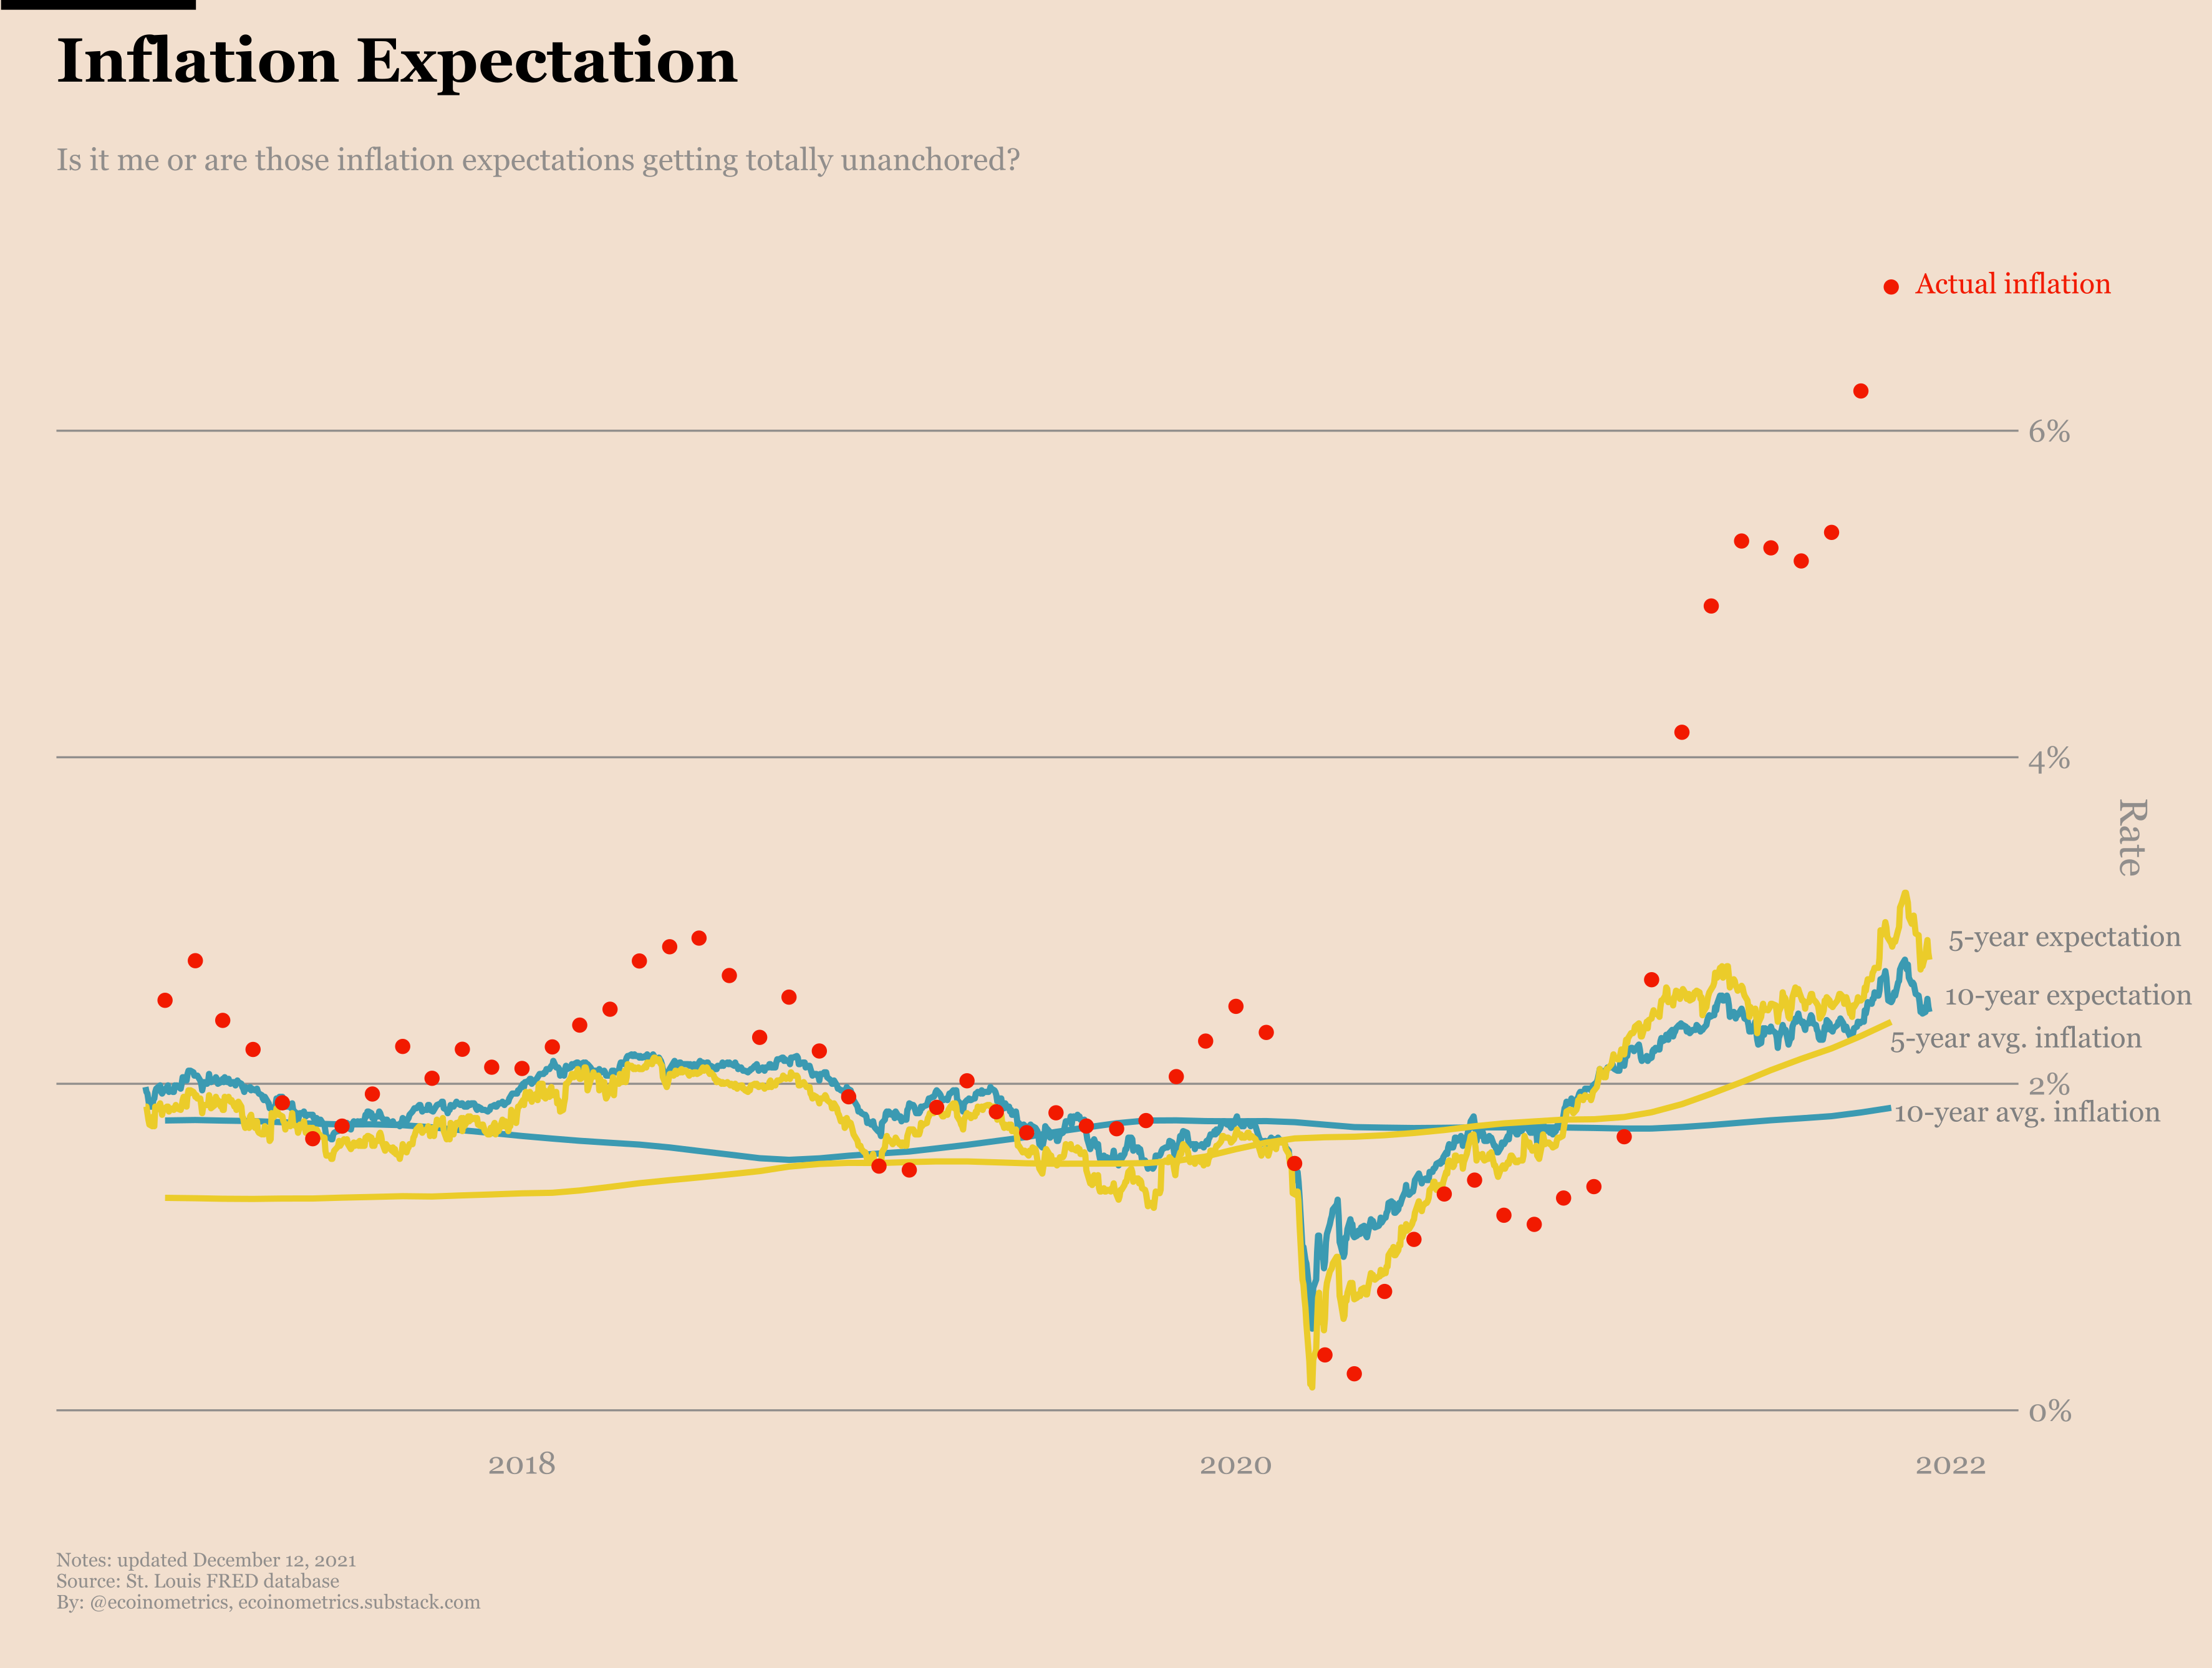
The latest CPI data shows that headline inflation is 6.8%. That’s the highest print since the mid 80s.
The economists at the Federal Reserve told you that it would be transitory, that everything was under control… but clearly that’s not the case.
Just follow the red dots on the chart below, inflation is exploding and running far ahead of the expectation priced into the bond market.
In case you aren’t sure if this is normal, let me tell you, it isn’t. Checkout the map of the real yield since the 70s. The past 6 months are all outliers.
We haven’t seen inflation so high with a treasury yield so low for as long as the data goes back…
Keep reading with a 7-day free trial
Subscribe to Ecoinometrics to keep reading this post and get 7 days of free access to the full post archives.