


Ecoinometrics - July 22, 2020
Long or short...

Last time we looked at the state of the market and decided that betting on a rise of volatility was the smartest thing to do. Ok. But what if you want to make a directional bet. Should you go long or short Bitcoin...
The Ecoinometrics newsletter decrypts Bitcoin’s place in the global financial system. If you want to get an edge in understanding the future of finance you only have to do two things:
Click on the subscribe button right below.
Follow Ecoinometrics on Twitter at https://twitter.com/ecoinometrics.
Done? That’s great! Thank you and enjoy.
By now everyone is sick of this low volatility period. But historically, how low is it?
Pretty low.
The current 30 days realized volatility for Bitcoin is 23% and still trending down. Looking at a volatility chart covering 2019 to now you can see that it hasn’t been so low since the end of March 2019.

But let’s take a big timeframe. How about 2013 until now? If you plot the distribution of the 30 days realized volatility over that period it is even more clear that the current situation is abnormal.
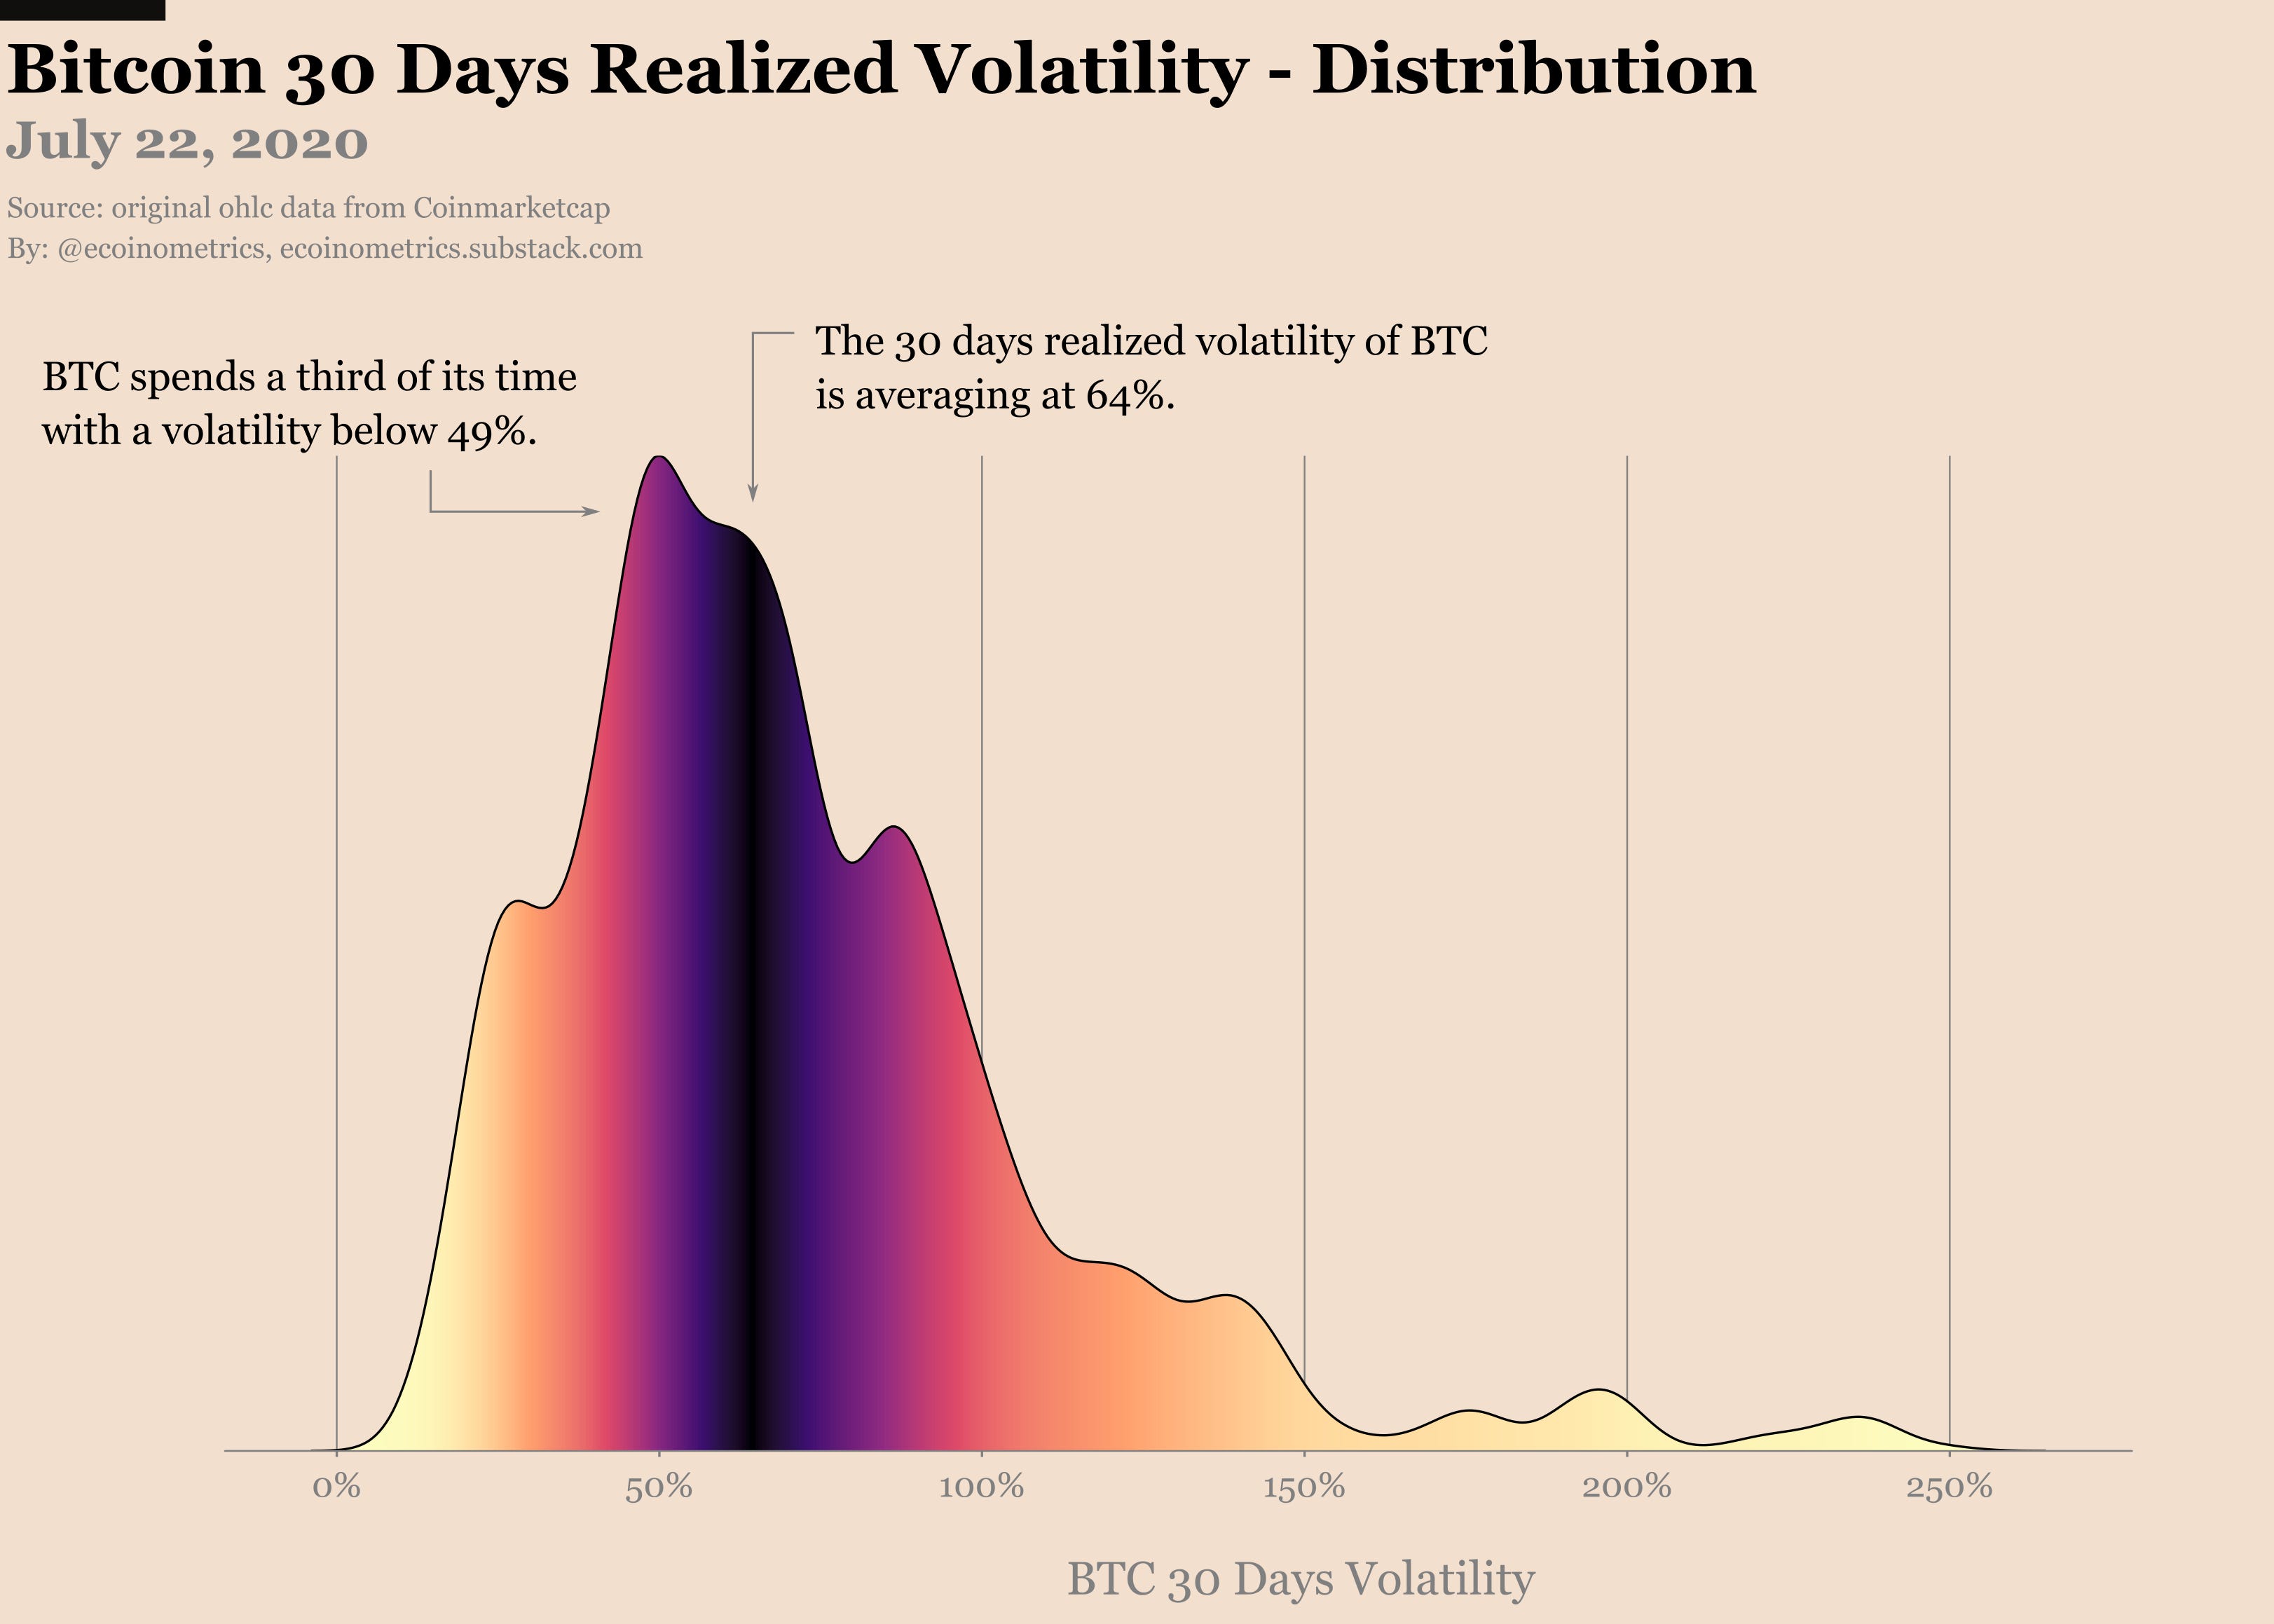
The average volatility is closer to 64%. It is below 49% only a third of the time. And since 2013 volatility stayed below 29% only 10% of the days.
So let me repeat that one more time. If you want to trade this market, the best play out there is to be long volatility. That’s your best bet. Period.
Ok.
But what if you don’t want to be neutral? What if you want to place a directional bet? What if you want to pick a side on which way the market will break out?
No worries, I got you covered…
Let’s think of it this way. You are looking at Bitcoin’s 30 days realized volatility. You see that it has been below say 49% for a number of days. You might ask the following question:
How likely is it that if I take a long BTC position now it will make money 30 days from now?
Two arbitrary numbers here: 49% volatility and 30 days outlook.
Here I’m choosing 49% as the volatility threshold because we see from the distribution that it happens only a third of the time. That’s low enough to make a bet on it. And it is also high enough that we do have some data to work with.
I’m also choosing 30 days because I think it is a good investment horizon if you are betting on some sort of trend developing.
Regardless, these are just parameters and we could rerun the same analysis with different values.
Back to our question:
How likely is it that if I take a long BTC position now it will make money 30 days from now?
To answer that we can proceed as follows:
Take each day since 2013.
Check if the volatility for that day is below 49%.
If yes, write down for how many days in a row it has been like that.
If yes, calculate the BTC return between that day and 30 days later.
Pretty simple right? Each point you calculate like that is giving the following information:
The volatility has been below 49% for D days.
If I go long BTC now here is the return I would have made by closing the position 30 days later.
If we do this calculation, here is what we see.
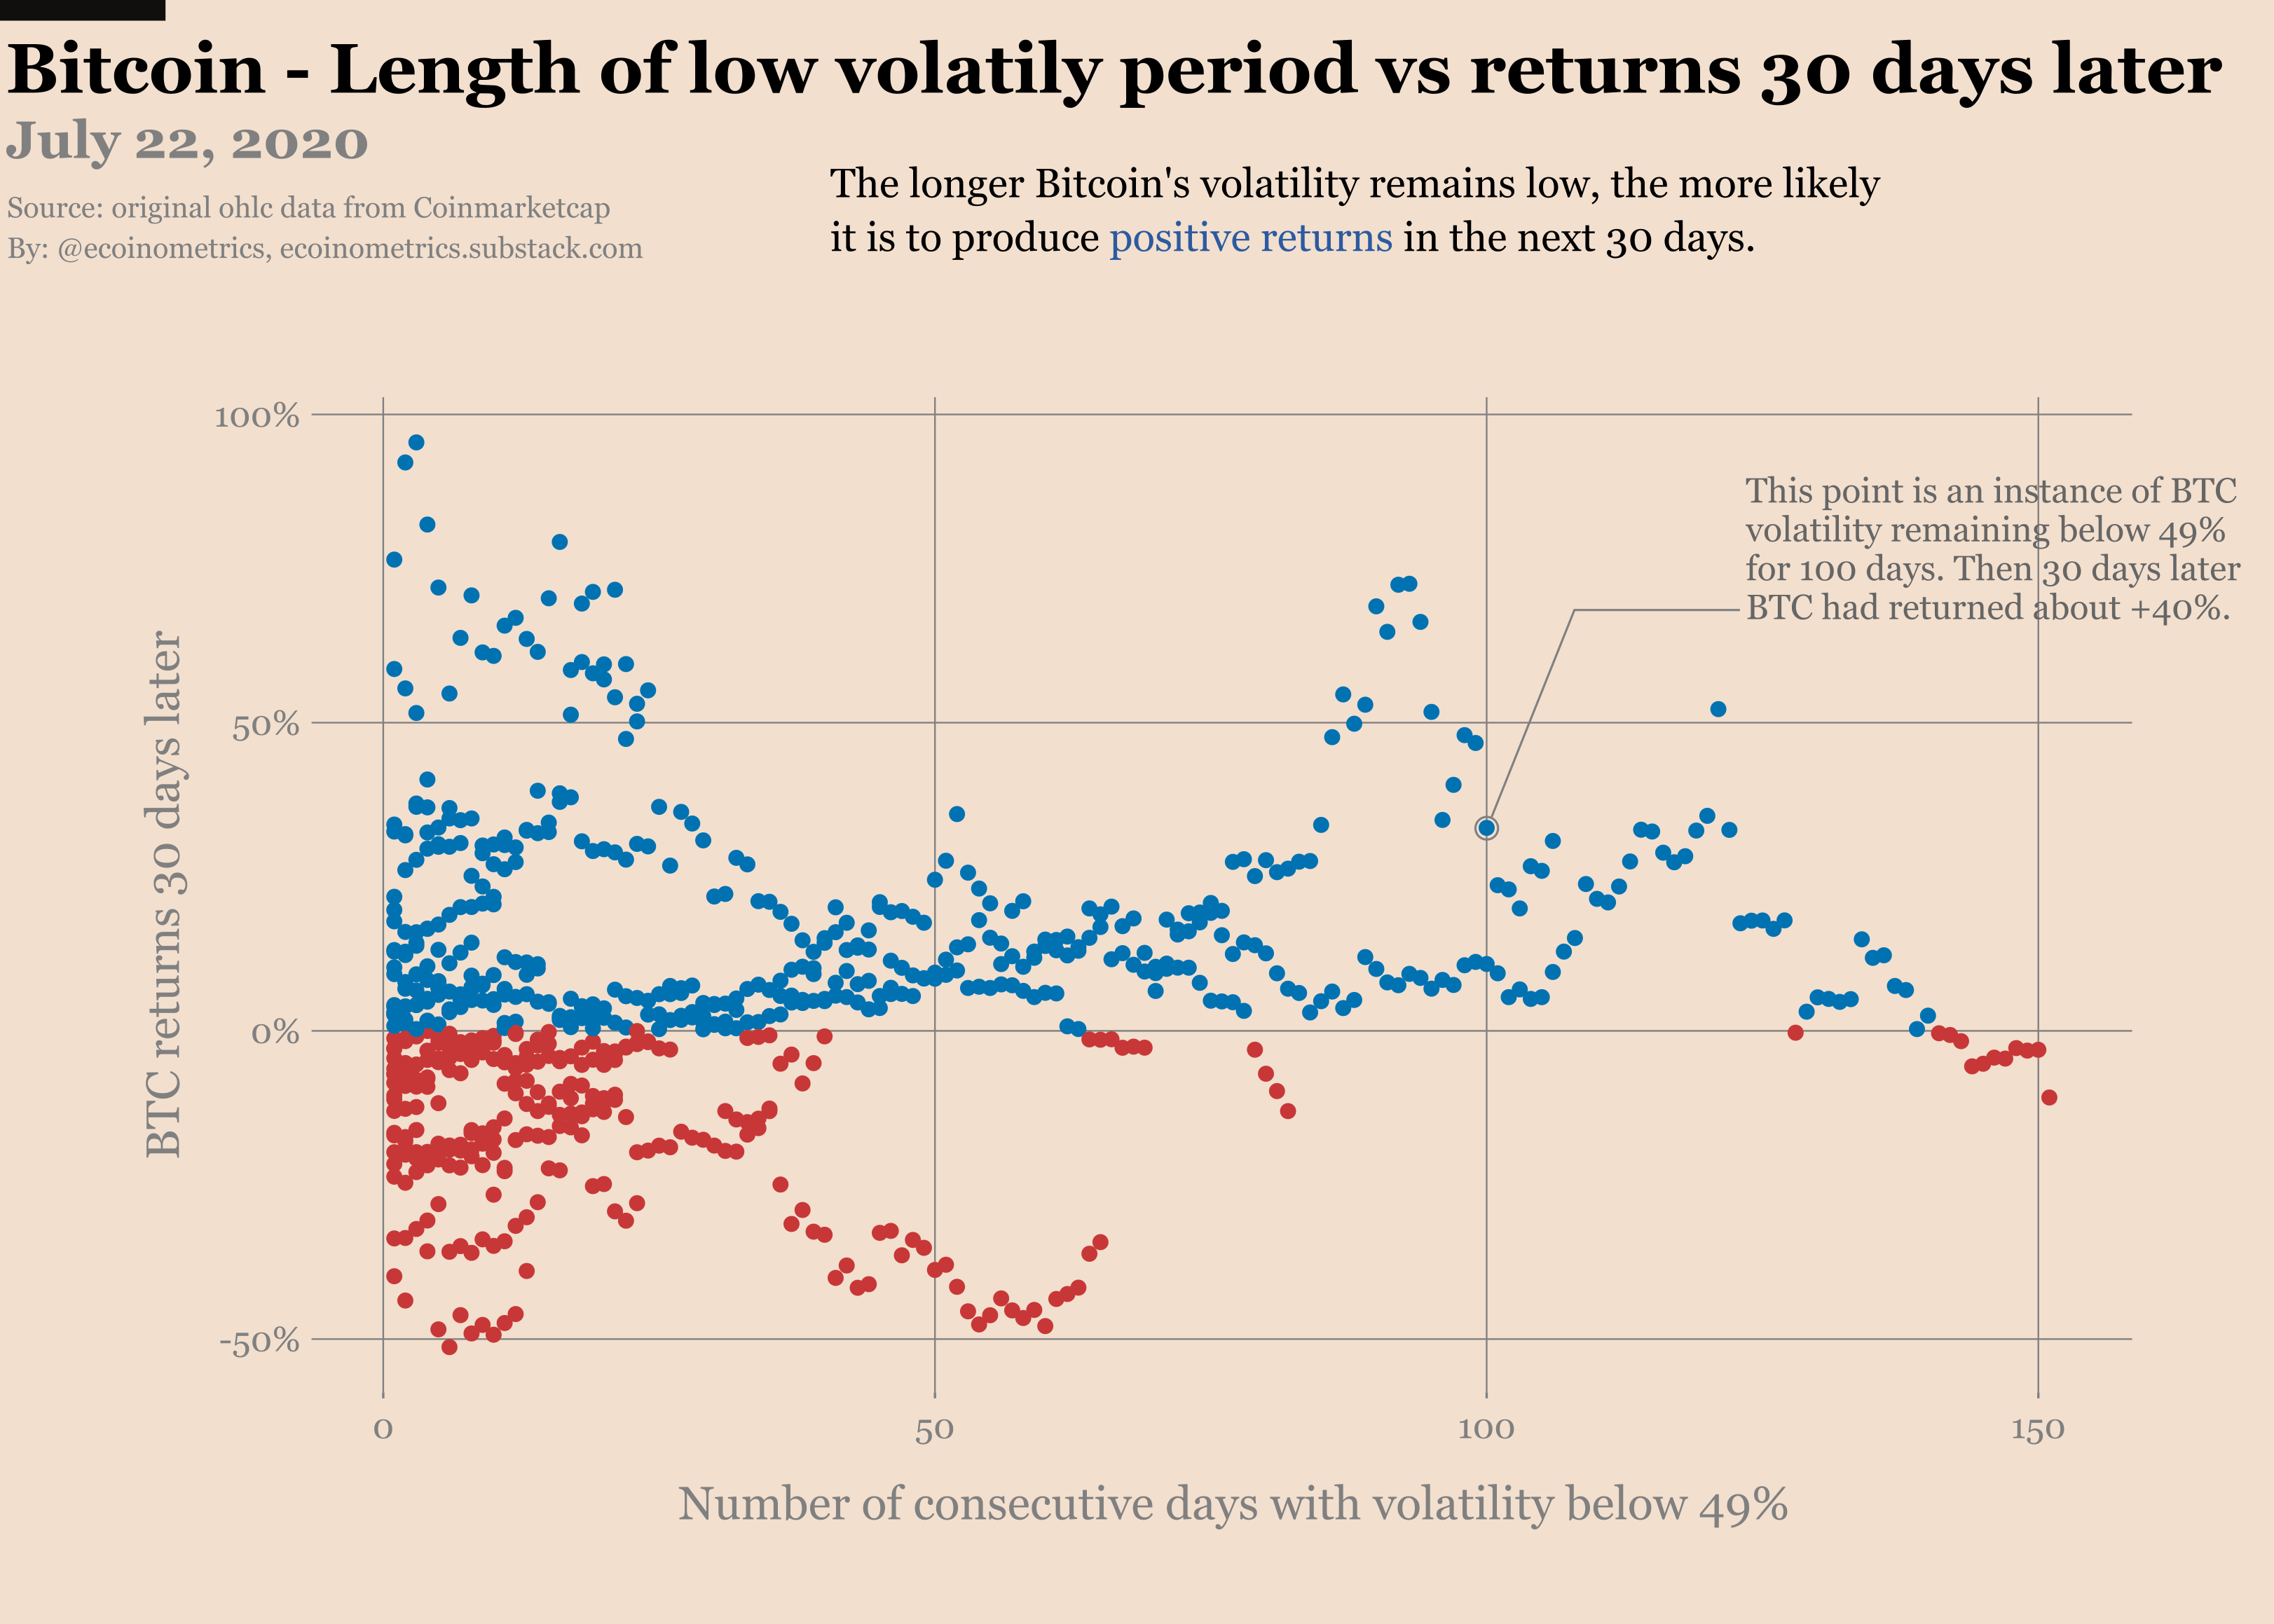
The further you go to the right on the x axis the longer BTC has been in a low volatility market. Blue points are positive returns after 30 days. Red points and negative returns after 30 days.
Clearly, up to a point, the longer Bitcoin stays below 49% of realized volatility the more likely it is to generate positive returns.

We are now closing in on a month of low volatility. At that point on the graph you can see that the points with positive returns starts outweighing the red dots.
However the red dots tend to be pretty big drops, typically -40% or more at 30 days.
So what you really want to look at is what is the expected return at 30 days as a function of how long Bitcoin has been in a low volatility market.
There you go, follow the yellow points.

Basically your expected returns are slightly positive at this point. But if you wait for 2 to 3 months of low volatility then you start seeing really big expected returns. We are talking positive returns in excess of 20%.
So what’s the conclusion should you go short or long Bitcoin? Well based on the historical data going long today is a 50/50.
Yes it is more likely that you will get a positive return by going long. But the instances of negative returns tend to be rather large. That’s why we end up with an expected value oscillating around zero.
Depending on how you implement your trade I think you can get away with taking a long position. As usual, execution and risk management are most of the work (but maybe I’ll talk about that another day).
If we get one more month of low vol though… then there is no discussion, just go long.
Alright.
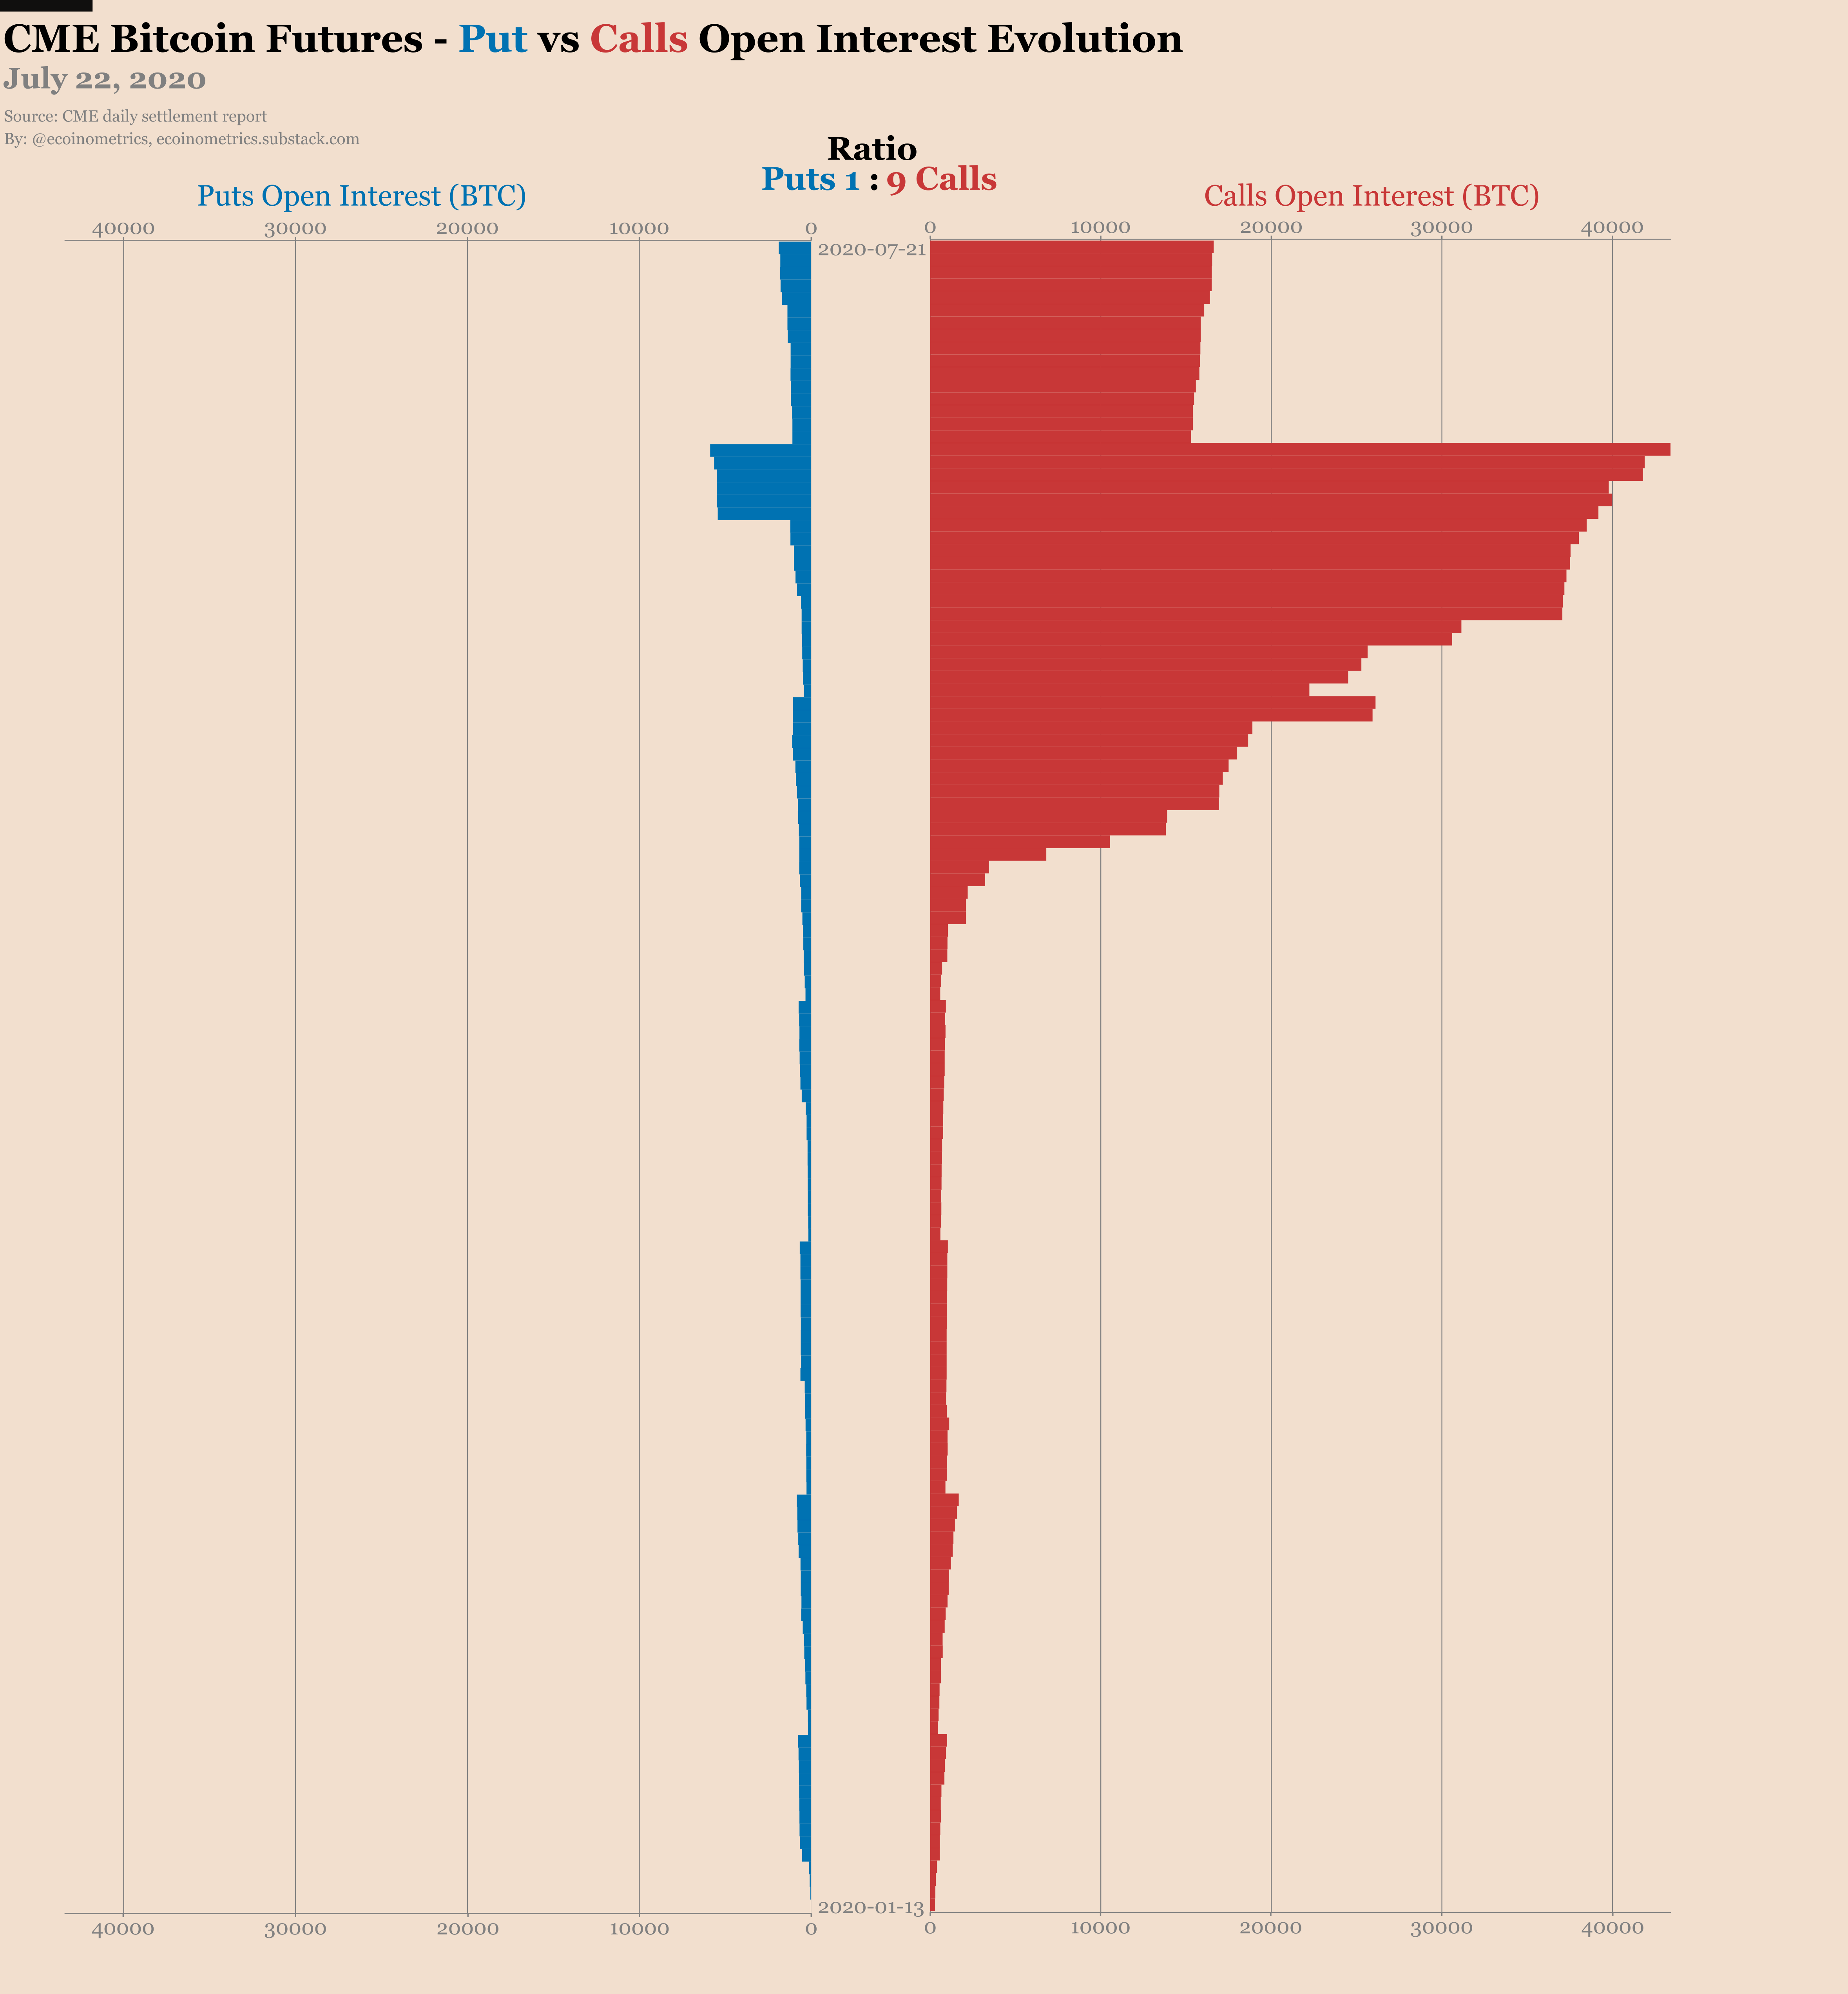
Meanwhile traders are still hopeful. The market at large is witnessing a rise in open interests on Bitcoin derivatives products. Specifically for the CME a small +2% move yesterday was enough to see open interests and traded volume jump.
Now it is possible this is only one more of these short time trades. Bitcoin looks like it is on the move, traders jump in, nothing happens, they liquidate the positions.
We have seen a handful of these trades already.


Check out the heat map. Interestingly this month the open interests have been more and more distributed over the first 3 near months. Not sure if it is because more spread trading is happening or something else so we’ll have to investigate.
In the absence of any significant price movement the options market is remaining quiet. But there are only 10 days left on the July contract.
If Bitcoin doesn’t break out of this range it is very likely that the number of open positions will come down dramatically in August.
We are talking moving from 18,000 BTC worth of positions down to 5,000 BTC…
The first big target for the bull call spreads in July is $11,000. That’s a +17% move from today’s price. So close and yet so far...

The latest Commitment of Traders data is dated July 14. I don’t see any substantial change in sentiment. As a reminder, the smart money tends to be net short (that’s still the case) and the retail traders tend to be net long (that’s still the case).
I don’t think there is anything new to learn from that but take a quick look.


That’s it for this week. Let’s see how things play out.
The Ecoinometrics newsletter decrypts Bitcoin’s place in the global financial system. If you want to get an edge in understanding the future of finance you only have to do two things:
Click on the subscribe button right below.
Follow Ecoinometrics on Twitter at https://twitter.com/ecoinometrics.
Done? That’s great! Thank you and enjoy.