


Ecoinometrics - Keeping up with M2
June 30, 2021

Last year the amount of US$ in circulation grew by 20%. That is by far the biggest jump in money supply over the past 50 years.
But where is this money going?
The Ecoinometrics newsletter decrypts Bitcoin’s place in the global financial system. If you want to get an edge in understanding the future of finance you only have to do two things:
Click on the subscribe button right below.
Done? That’s great! Now let’s dive in.
Keeping up with M2
If you fell into the Bitcoin rabbit hole, you certainly know that the concept of money isn’t as straightforward as it seems. Because of that central bankers have a range of definitions for what constitutes money.
One of those definitions is M2.
Take hard cash, the one you can put in your wallet. Add anything else that can be converted to cash easily, like say the electronic records that represent the money you have on your bank account. The result is M2.
Since 1971 the US$ M2 has been growing constantly. From the 70s to 2000 a good part of the newly printed cash was finding its way into the real economy each year.
But since the early 2000s the velocity of money is plummeting.
What that means is that despite the financial system churning out always more US$, the amount that trickles down into the real economy is getting smaller and smaller.
So where is all that money going?
Well, one possibility is that it gets trapped into the financial system which uses it to purchase financial assets.
This is the idea of the Cantillon effect.
Now, we’ll dig deeper into the Cantillon effect in the weeks to come but as a start let’s see if the theory checks out at a high level.
Let’s divide history between four epochs:
Before the end of the gold standard.
Between 1971 and the 2008 financial crisis.
Between 2008 and the 2020 pandemic.
After 2020.
This is a rough way to split history between time periods that have seen inflections in the rate at which the US$ M2 is growing.
If the freshly minted cash gets trapped inside the financial system you’d expect that financial assets will at least keep up with the growth of M2.
So let’s check this out.
Start with gold.
At the beginning of each epoch both M2 and gold are normalized to 1 so that we can track their relative growth.
We then plot the ratio of the normalized value of gold to the normalized value of M2 month by month.
If you want to skip over the maths here is the tl;dr, over each epoch:
When the points are above 1 on the vertical axis, gold is growing faster than M2.
When they are below 1, gold is growing slower than M2.
At 1 they are growing at the same rate.
Check it out.

If you skip over the explosive period that followed the end of the gold standard you can see that over each epoch gold pretty much just keeps up with M2.
Said otherwise, most of the growth of gold in US$ terms can be attributed to the debasement of the currency...
What about the stock market?
Here is what you get by applying the same technique.

Yep, once again over each epoch the ratio does not stray very far away from 1. So once again the growth in US$ of the stock market can be mostly attributed to a debasement of the currency over time.
At least from a 10,000 foot view the idea that the growth of financial assets priced in US$ is in large part tied to the debasement of the currency checks out.
Which brings the questions:
If financial assets are mostly growing in value due to a game of currency debasement, am I really getting richer?
What happens if the music stops or if the Fed decides on a radical change in monetary policy?
Are there assets that can do better than just keeping up with M2?
To answer all that we’ll need to dig deeper in upcoming issues of the newsletter.
Meanwhile here is a tip: if you want to do better than simply keeping up with M2 it’s time to stack sats!

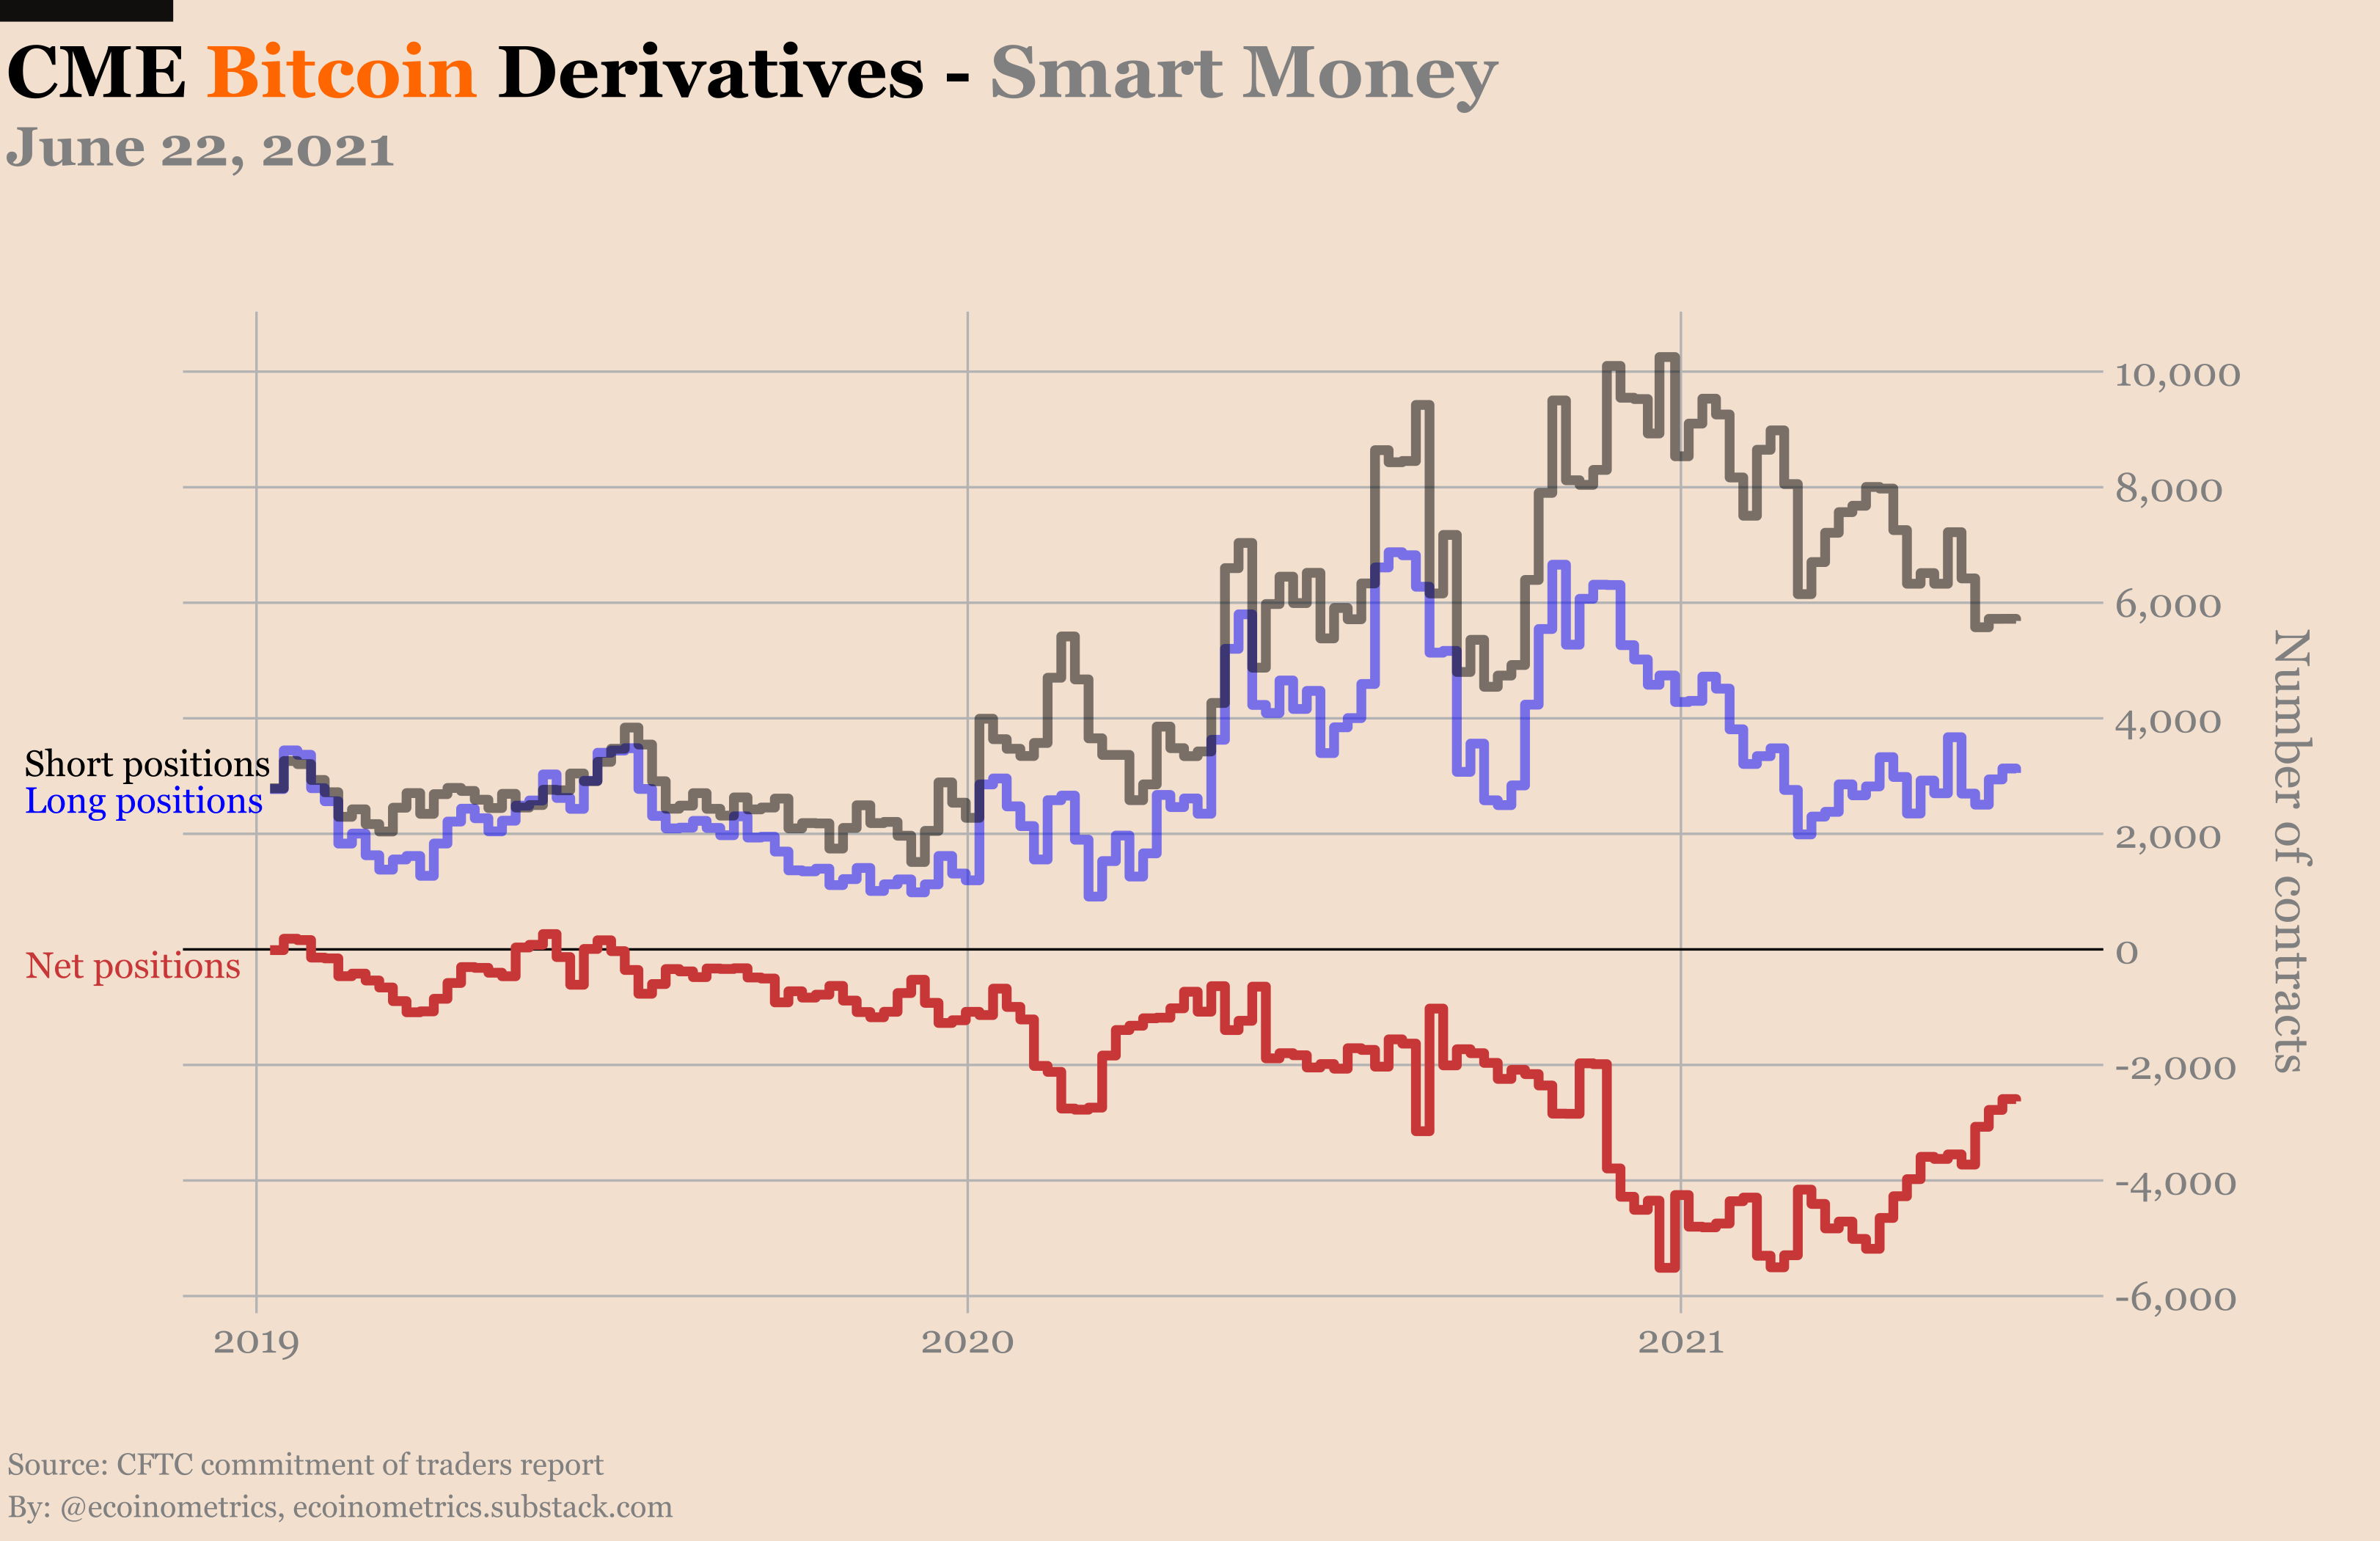
CME Bitcoin Derivatives
The June contract expired last week and since then the market has been uneventful.
Volume: low.
Open interest: stable.
I mean look at it.

And the Commitment of Traders report tells the same story. The positions are unchanged. Hedge funds or retail traders, it doesn’t matter. There is nothing going on.

This is so quiet that you’d think most traders have forgotten Bitcoin is still around…
If you ask me, that's a good thing. Between the episode with Elon Musk and the FUD surrounding miners moving out of China we are in need of a sentiment reset.
People have forgotten the main narrative and got sidetracked by debates around ESG and miners concentrations… basically things that are short term issues.
A period of low volatility albeit in the $30k range is welcomed. But who knows what will come out of the Jack Dorsey vs Elon Musk debate in a couple of weeks…
Whatever the outcome, we’ll have to deal with it.
Maybe if we see a big spike in short dated far out of the money puts just before July 12 we’ll know that Elon Musk is getting ready to piss on BTC once more.
Jokes aside, Elon Musk isn’t the only one buying puts. As it has been the case for the past couple of months the puts dominate the market with 2 puts for every call.
But to be honest there is so little trading activity on the CME options market these days that the information to extract from the positions is very limited.


So let’s see how long we’ll have to wait to get some action.
That’s it for today. If you have learned something please subscribe and share to help the newsletter grow.
Cheers,
Nick