There is one major problem when you try to wrap your head around macroeconomics ideas: it is hard to get a sense of scale.
Talking about billions, trillions, logarithmic charts... it can all get pretty confusing fast.
So maybe instead of talking in terms of an absolute dollar scale we should just compare assets to each other.
Let’s try that.
The Ecoinometrics newsletter decrypts Bitcoin’s place in the global financial system. If you want to get an edge in understanding the future of finance you only have to do two things:
Click on the subscribe button right below.
Follow Ecoinometrics on Twitter at https://twitter.com/ecoinometrics.
Done? That’s great! Thank you and enjoy.
A sense of scale
Yesterday Bitcoin hit a new record high market cap of $355 billion. New all time high is nice.
But how much is $355 billion? Is it a lot? Is it small? Compared to what?
Do you know anything else that’s worth about $355 billion?
That’s the issue here.
Unless you are spending a great amount of time looking at macroeconomics data it is unlikely that you have any sense of how big or small this number is compared to other macro scale values.
Around the time of the 3rd halving I tried to answer a ‘what if’ question: what if the 3rd Bitcoin halving goes the same way as the previous ones?
The answer to this question is pretty simple:
Take the growth trajectory of BTC after the 1st halving and apply it to the BTC value at the start of the 3rd halving.
Take the growth trajectory of BTC after the 2nd halving and apply it to the BTC value at the start of the 3rd halving.
When you do that you obtain a range of possible growth trajectories for the 3rd halving based on the previous ones. That’s the blue range below.
The top of the range is the growth trajectory of the 1st halving.
The bottom of the range is the growth trajectory of the 2nd halving.
The dark blue curve is the average line between those two (the log scale makes it naturally look tilted to the upside) added for reference.
Check it out.
Now, many people who saw this chart had the following reaction:
“$100,000 for one Bitcoin! No way! That would mean it has a market cap of $2 trillion lol… NEVER”
I’m guessing that the people who think like that don’t really understand that $1 trillion does not buy you much these days…
So instead of checking how many billions and trillions correspond to the market cap of Bitcoin at a given price why don’t we just compare it to more familiar assets of the same size.
Let’s see.
With Bitcoin around $19k it is the same size as JPMorgan, one of the largest banks in the world.
That’s one of the reasons you see institutional money taking a serious interest in Bitcoin these days. At this scale they simply can’t afford to ignore it.
Same with the recent PayPal move. Since $12.7k Bitcoin is already bigger than PayPal… at this scale they’ll miss the boat if they don’t start integrating.
All that is interesting but it is what lies behind us now.
Let's check out what’s coming up ahead instead.
The ‘what if’ scenario we discussed above is placing Bitcoin to settle anywhere in the $100k to $400k range during this halving cycle.
So how big is that?
At the bottom of the range it is bigger than Google, bigger than Microsoft, bigger than Amazon. In fact it is about the same size as Apple.
At the top of the range Bitcoin would be as large as the current balance sheet of the Federal Reserve or as large as BlackRock total assets under management.
But that would still be smaller than the market cap of physical gold… so for an asset that acts as digital gold this range absolutely makes sense.
Now if the scale makes sense the next question is the timing.
Can we really have Bitcoin working on the same level as gold within one or two halving cycles?
We can get an idea by stretching the chart at the bottom to see how Bitcoin has changed from halving to halving.
Check it out:
1st halving BTC at $12
2nd halving BTC at $650
3rd halving BTC at $8,500
In terms of scale each halving is adding one zero. So if Bitcoin continues to grow at this rate we can expect roughly two halving cycles in order to move somewhere between gold and the US M2 money supply.
Even if you think the chances that this happens are low you should not pass on a bet with a potential 100x return in 8 years.
Your call.
CME Bitcoin Derivatives
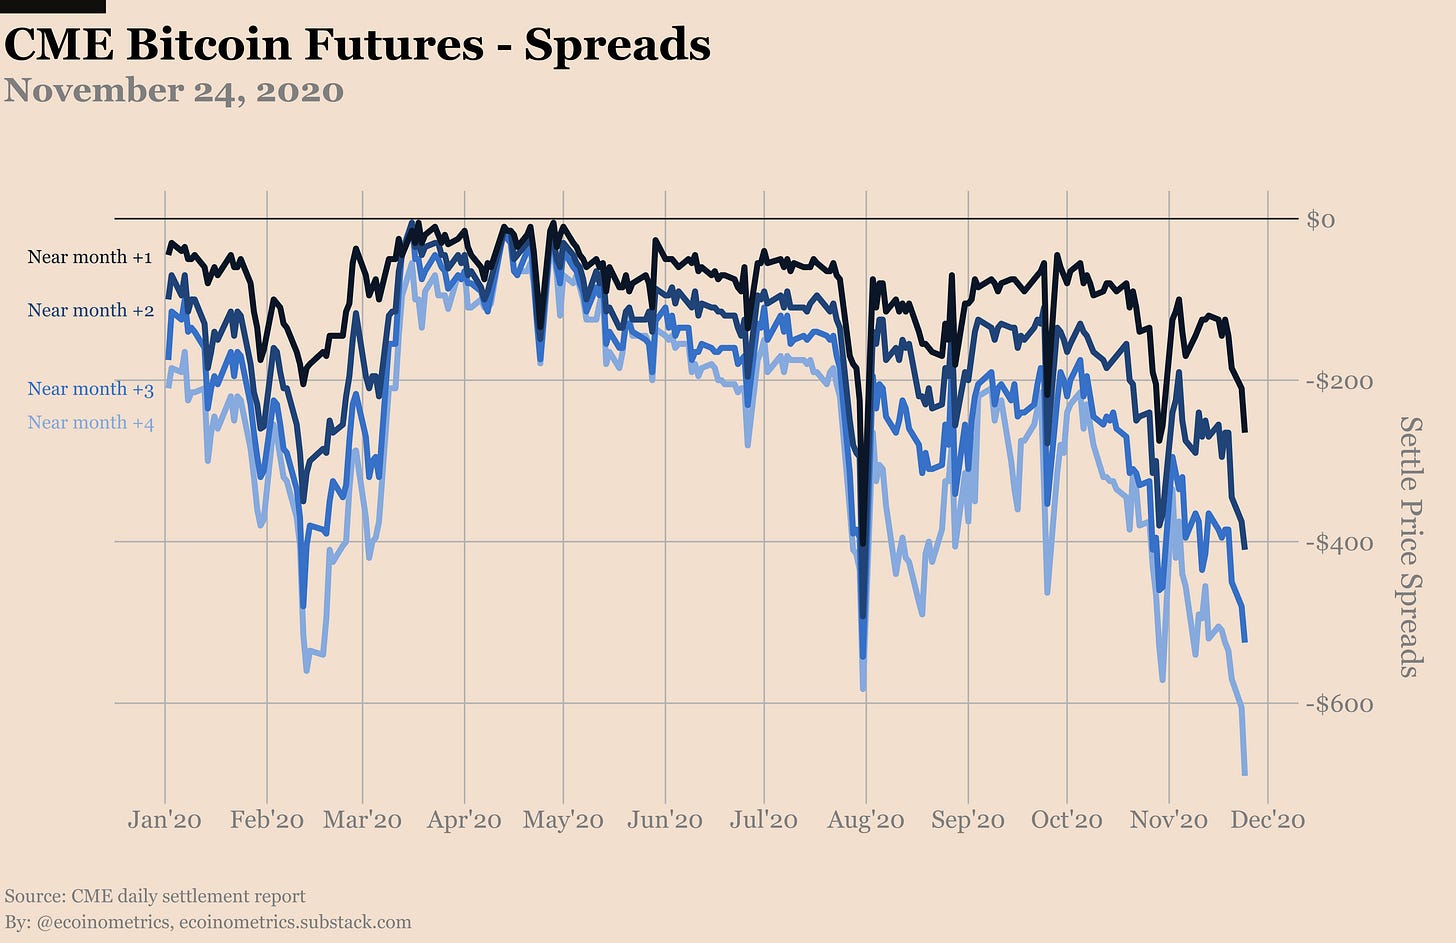
The November contracts expire at the end of the week AND the Thanksgiving holiday is coming up so it isn't very surprising to see that the trading activity has been high during the last few days.
Everybody wants to wrap their rollover before the long weekend.
Result high traded volume, small bump in the open interest but there is probably not much to be excited about.
Following the heat map the roll should be complete on Wednesday.
Right now the end of the month is creating noise. And because of the holiday weekend there will be less volume for the next few days.
So how much of the extra trading activity is due to Bitcoin closing in on $20k? We'll know at the start of next week.
When it comes to the options, things are looking pretty slow.
But the calls are doing well this month:
- 38% of all the positions are expiring this month.
- Yesterday at the close 58% of the November calls are in the money.
Note that the $20k strike is only a +5% move away. That could happen anytime before Friday and the result would be a record 87% of calls expiring in the money this month!
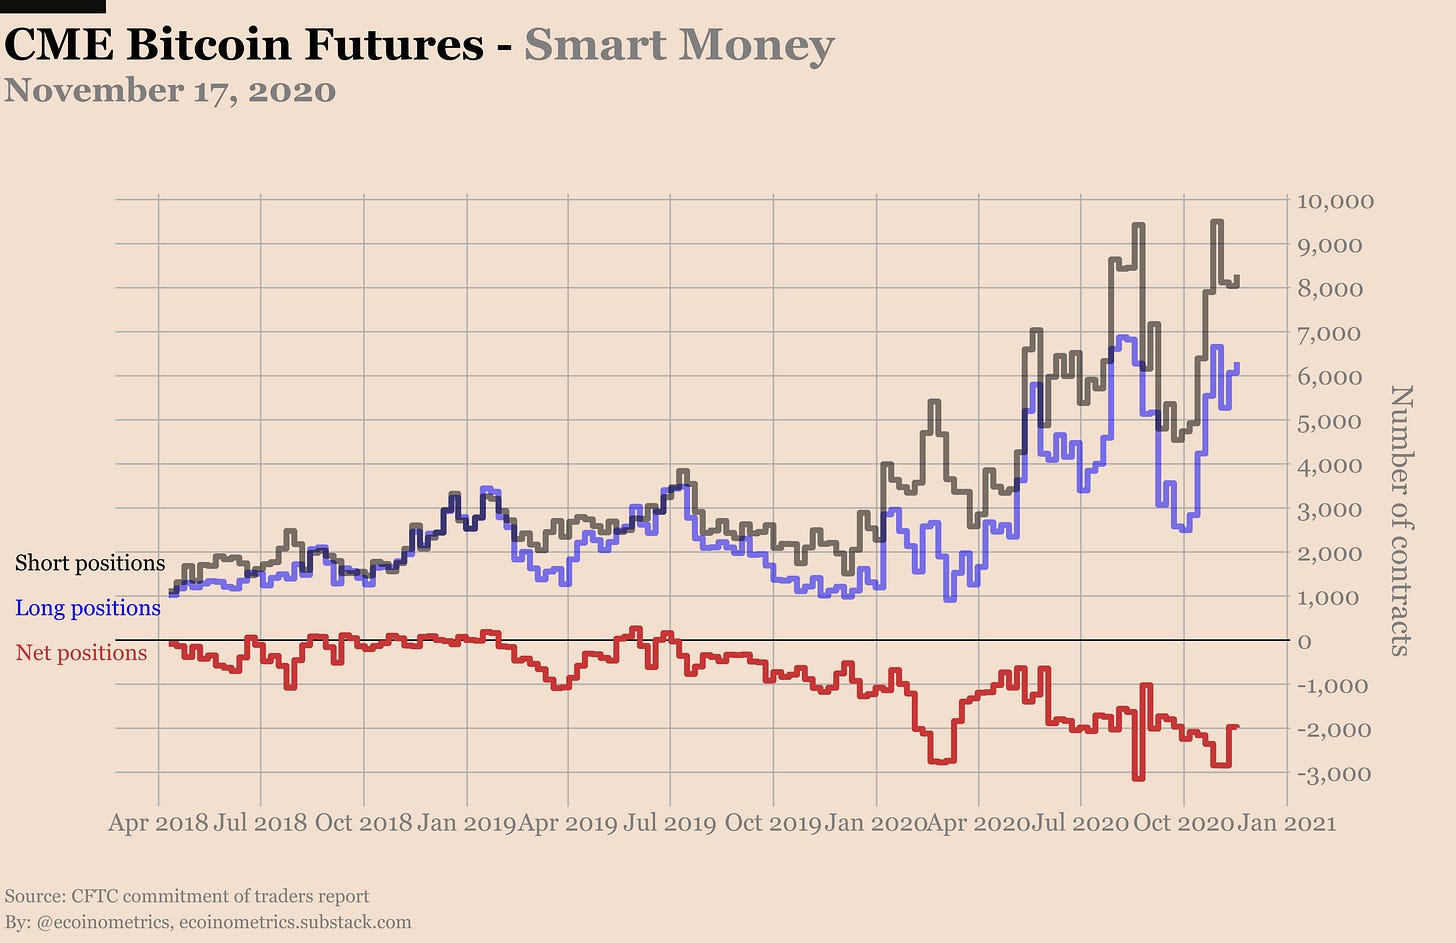
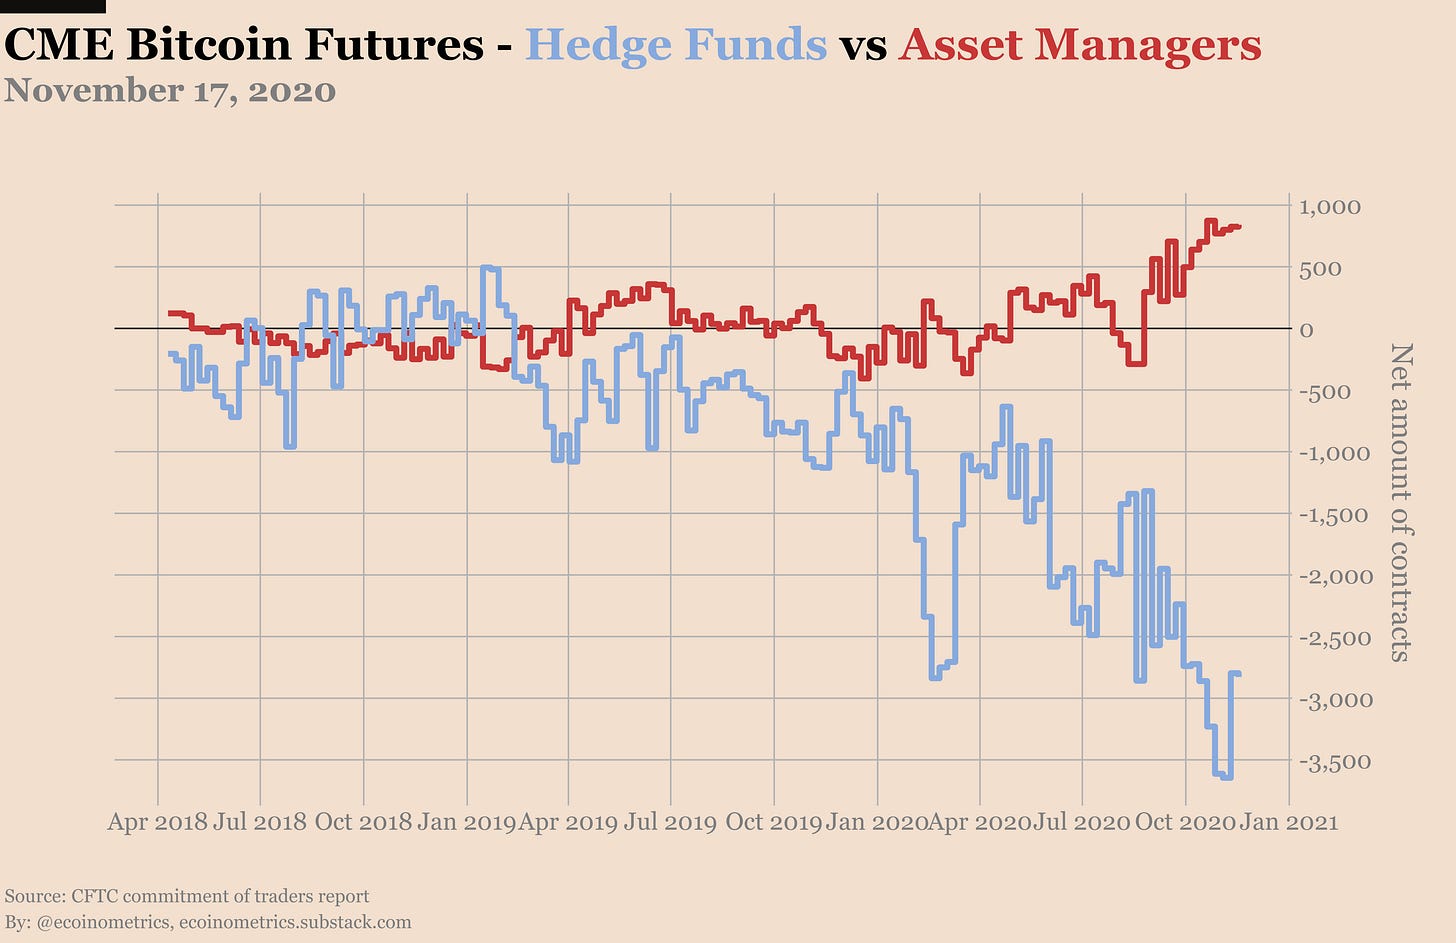
When it comes to the Commitment of Traders data there aren't many changes since last week.
The only notable thing is that some retail traders have increased their short positions... unless it is a hedging move this might not be very wise given the strength of this BTC trend...
That’s it for today. If you have learned something please subscribe and share to help the newsletter grow.
Cheers,
Nick
The Ecoinometrics newsletter decrypts Bitcoin’s place in the global financial system. If you want to get an edge in understanding the future of finance you only have to do two things:
Click on the subscribe button right below.
Follow Ecoinometrics on Twitter at https://twitter.com/ecoinometrics.
Done? That’s great! Thank you and enjoy.


Hi! Regarding the Bitcoin Value in Context visual: can you share your assumptions behind the analysis (particularly gold market cap value and number of BTC)? Most BTC price estimates I've seen showing BTC reaching gold market cap are in the $400K-$500K range.