November might prove to be an interesting month. On one hand the supply shock is still in play for Bitcoin. On the other hand the Federal Reserve is poised to announce something that could derail the markets. So where are we going?
The Ecoinometrics newsletter decrypts the place of Bitcoin and digital assets in the global financial system. If you want to get an edge in understanding the future of finance you only have to do one thing, click on the subscribe button right below:
Done? Thanks! That’s great! Now let’s dive in.
Pumping the markets
You know the mechanics of the Federal Reserve printing money right?
The Fed doesn’t print bills directly into US citizens wallets. At least until not we’ve made the full switch to a CBDC version of the US Dollar where each citizen has a wallet controlled by the Federal Reserve…
No, instead it plays an accounting game by adding to the balance of those who do have an account at the Fed. That is the government and banks.
For the most part newly created dollars end up doing one of two things:
Increasing the liquidity available to banks so that they can use more leverage.
Feeding the Treasury General Account i.e. the account of the US Treasury at the Federal Reserve.
Then that money is supposed to find its way towards the real economy either by the banks using the extra leverage that was given to them to lend more money or by the US government distributing the cash in their war chest as helicopter money.
Before 2020, relatively speaking, the US government wasn’t handing that much cash directly to the citizens.
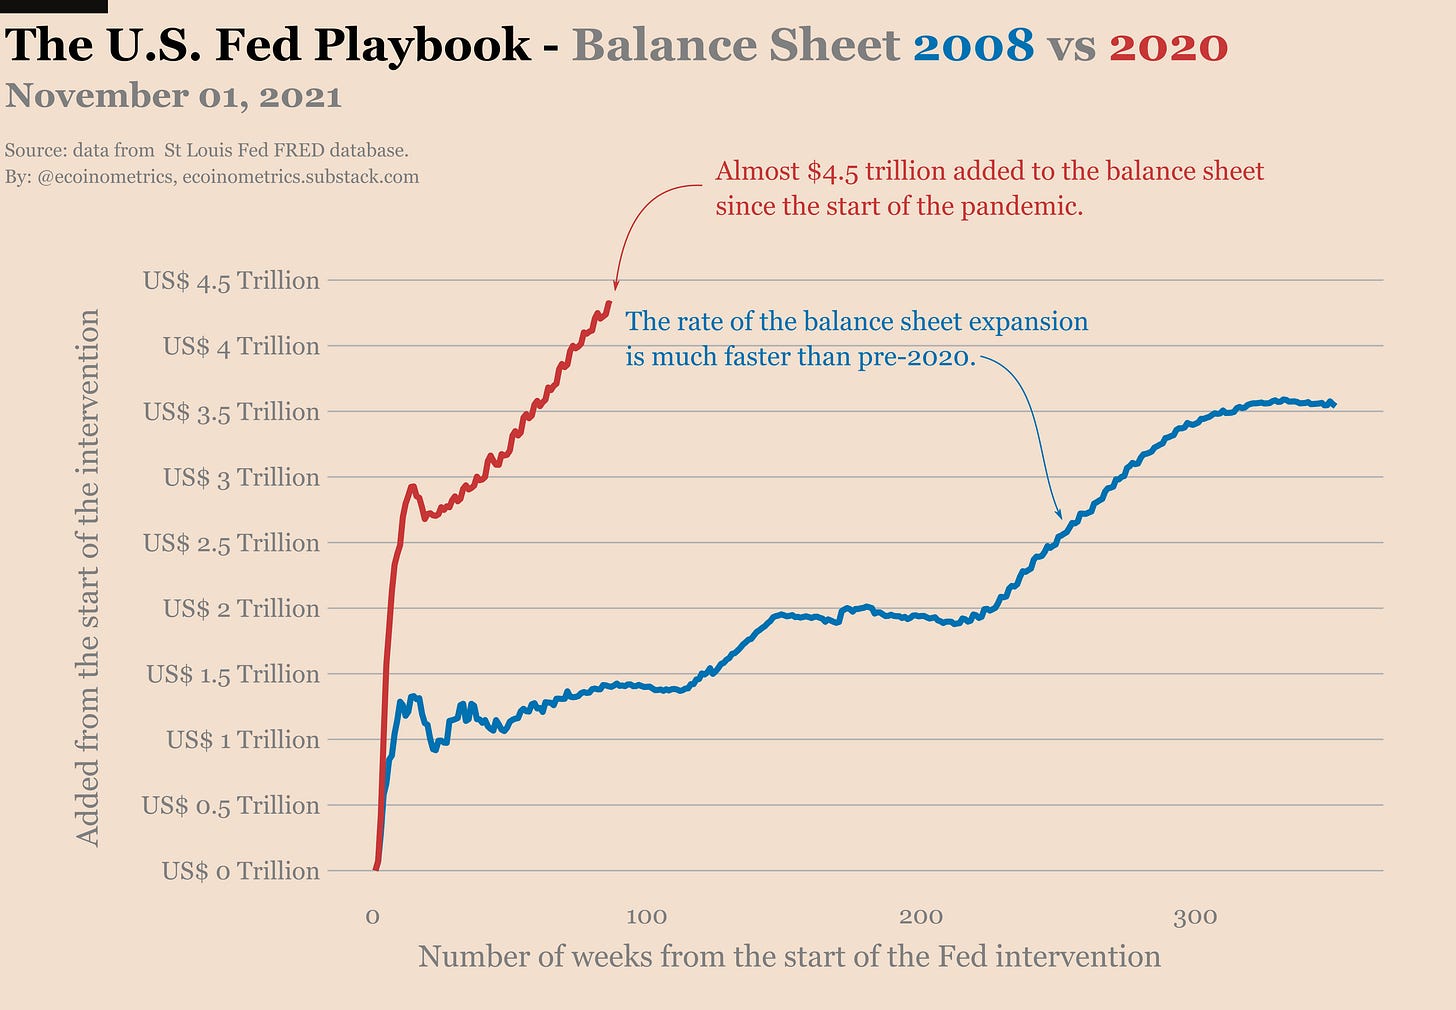
Most of the $3.5 trillion that were added to the Fed’s balance sheet after 2008 went into the banking system. It is also true that most of that cash went into buying financial assets instead of being used to power the real economy. If you aren’t convinced of that just go checkout any chart of the velocity of money since 2008.
This time is a bit different but also kind of the same. Bear with me.
In less than 2 years the Fed added almost $4.5 trillion to its balance sheet. That’s already more than the entirety of the balance sheet expansion post 2008. A large part of this expansion (about $1.8 trillion) is the result of the Fed buying US Treasury bonds to finance the US Treasury General account.
In other words the Federal Reserve is doing debt monetization for the US government. This is what’s different from what we have seen in the past. The Fed has gifted the US Treasury with a lot of cash. Then in turn the US Treasury has been distributing that cash as social benefits.
You can see that easily by looking at the long term chart of the social benefits distributed by the US government every quarter.
Not only are we way above baseline since 2020, we also have had two massive spikes that correspond to cheques being mailed in to actual people (instead of being freebies for the banks).
The twist though is that with this free money a lot of people started to buy financial assets. Of course!
It seems that whatever the Fed does, it all ends up pumping the markets in the end.
This is why you have to watch closely what is going to come out of the FOMC meeting this week. If the Fed signals that tapering is going to start soon then the stock market might be in for a dip.
And if that dip is large enough we are likely to get some dip for Bitcoin as well.
Do what you want with that. But my personal strategy is to keep some dry powder ready to buy any significant dip just in case. After all, in the long run the most important thing is how much of the total supply you control.
November market conditions
Let’s start the month by reviewing the on-chain market conditions for Bitcoin. The aggregate risk sits at 47% which is way below what you expect of a major top.
To clarify what the aggregate risk score means, let me remind you that it is built to measure whether or not the market is overheated.
Each metric that combines to form the risk score simply tells you if historically speaking the value is high.
Example, the score for the market value to realized value ratio is currently 85%. That means the current MVRV is larger than 85% of its history.
Since most of the metrics used in this risk score have a fat right tail this signal is most meaningful when it is high.
What I mean by that is there isn’t much difference between a risk score of 40% and 50% because those are in the bulk of the historical distribution. It basically tells you the same thing.
But a move from 70% to 80% does tell you that things are really heating up because at this point you are moving to the fat right tail of extreme events
So tl;dr as long as we are far away from the orange zone there isn’t much to talk about.
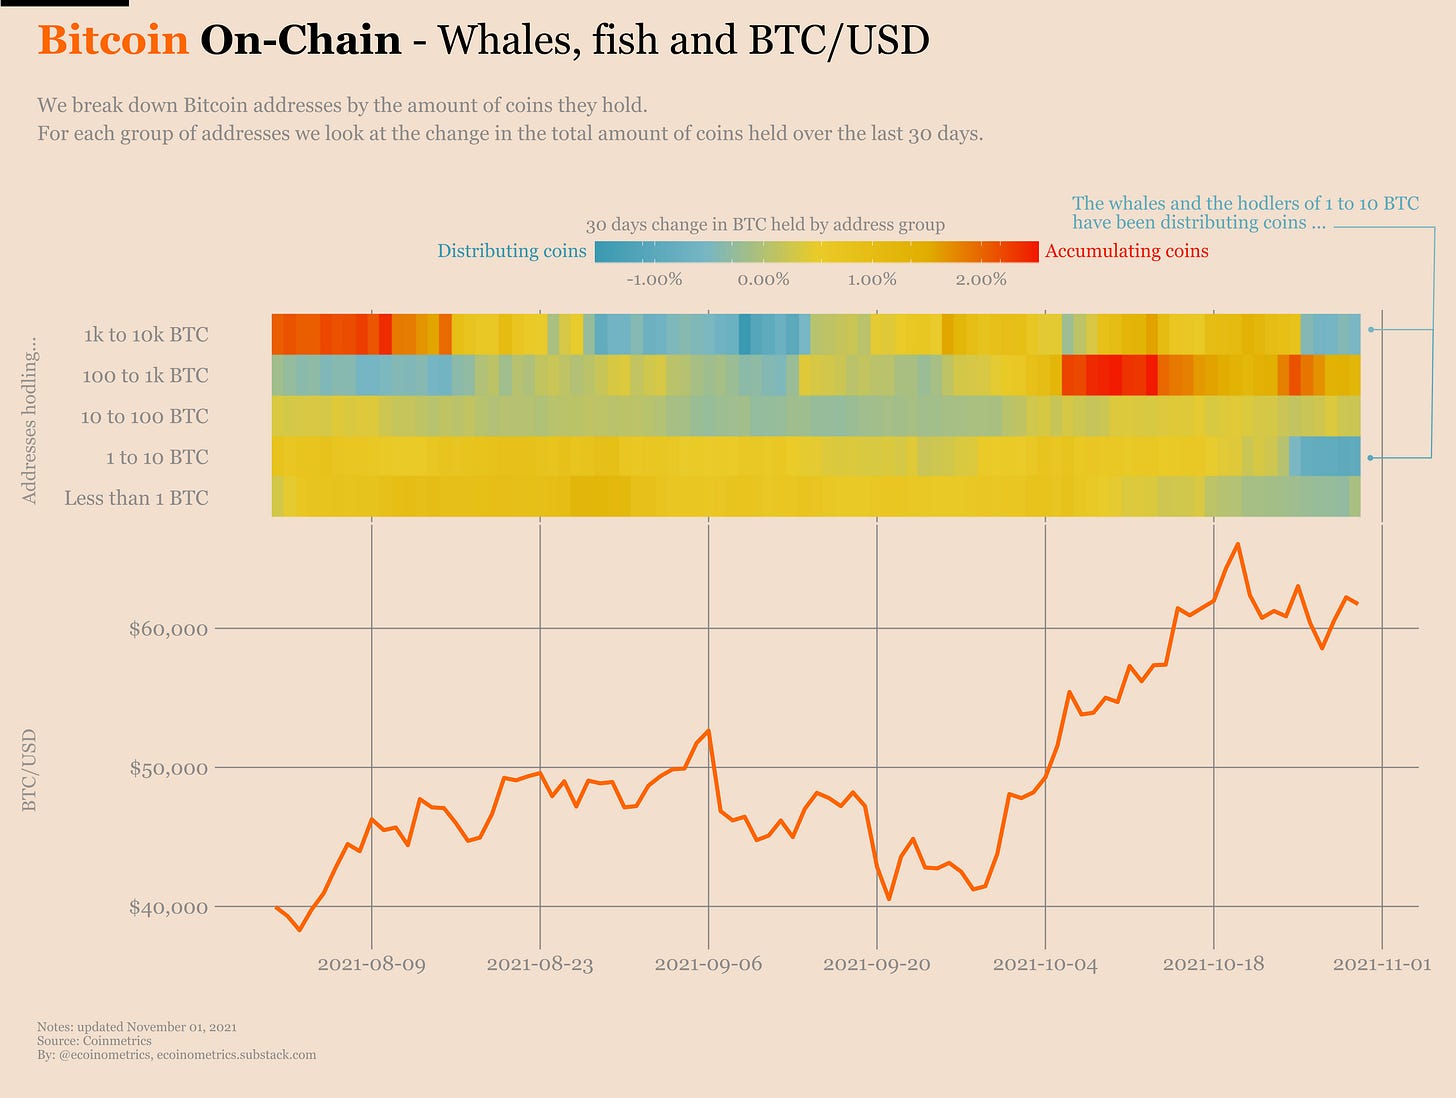
Right now the accumulation trend is strong. That means a large number of addresses of all sizes have been accumulating Bitcoin over the past 30 days.
However last week the whales as well as smaller addresses have been distributing coins on a one month basis. That kind of lines up nicely with what we observe in the price action of BTC which has been stalling around $60k.
It could be a bunch of people taking profit close to the all-time high. It could also be whales moving coins around different addresses. But at the end of the day the result is the same. As long as this doesn’t last for a long period of time we are likely to stay in the orange/red zone.
And if we dig into the details we can actually see that small fish have already started to stack sats again. So my guess is that we are all good and ready for another leg up.
Note that the supply shock is still playing out. Over the past 30 days there has never been so many Bitcoins getting out of exchange addresses. Unless we start seeing a reversal of this trend it is going to be very hard to get your hands on the corn when FOMO kicks in...
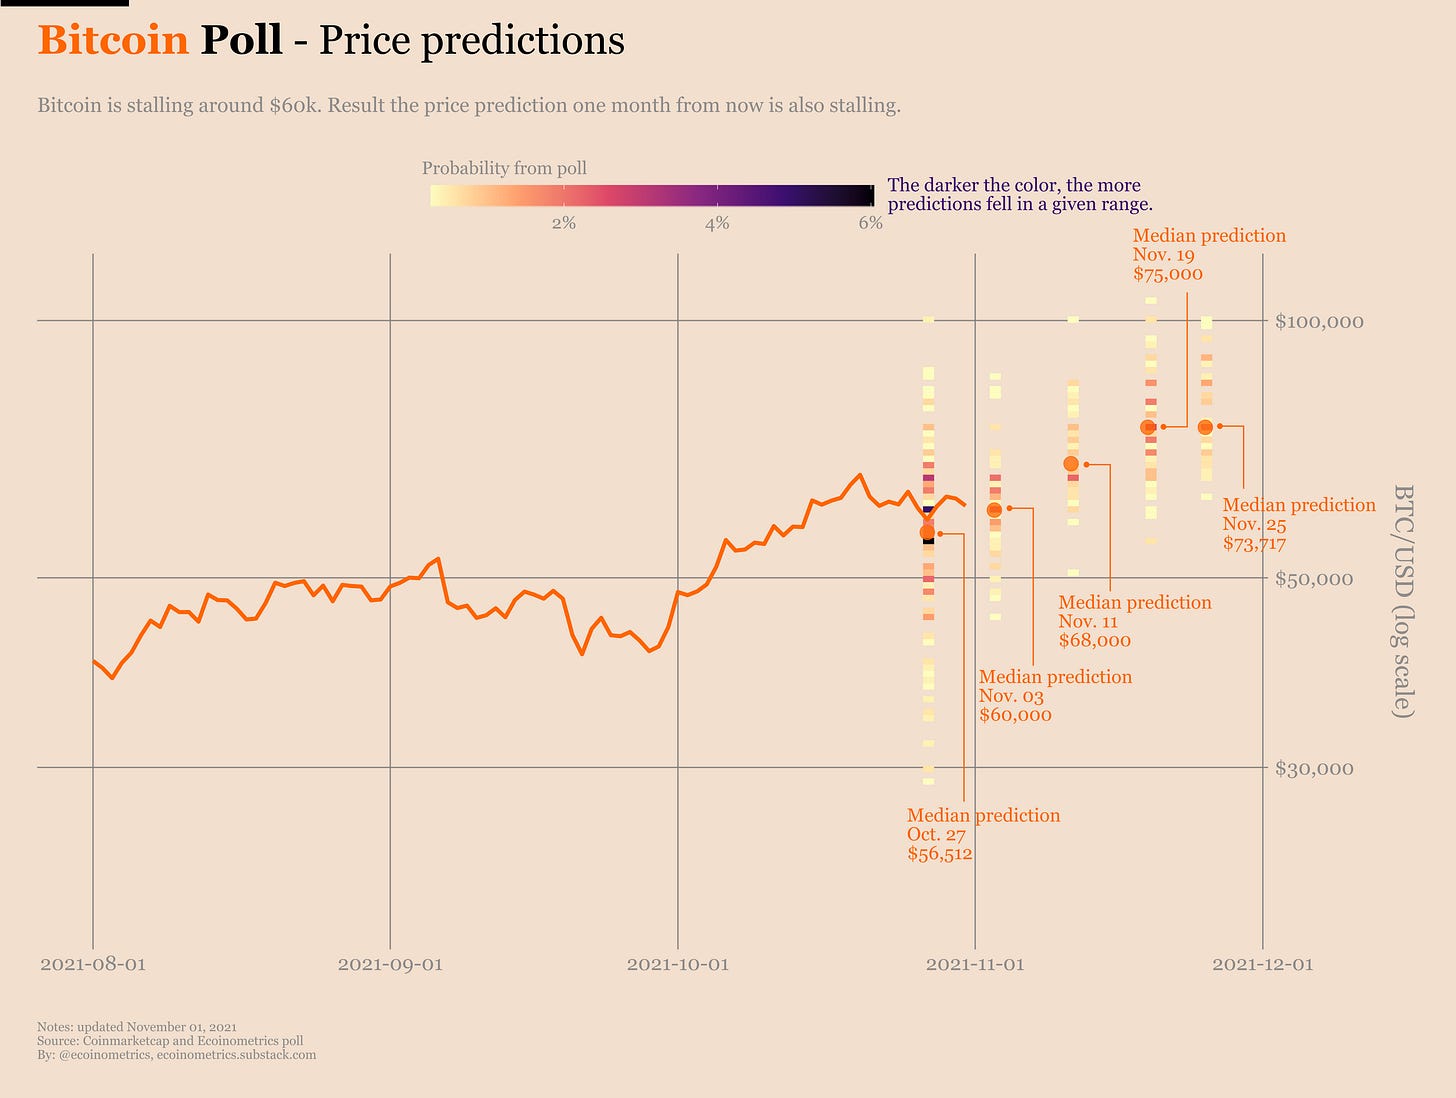
This is also the sentiment indicated by the price predictions poll. Next target is around $75k within a month. So far the median price prediction has been pretty accurate. Let’s see if it continues like that.
It will be interesting to see if we do get another parabolic move during this cycle or if Bitcoin is getting more tame as it is becoming more embedded in the global financial system.
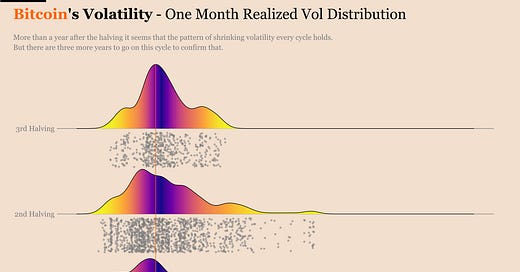
If you look at the distribution of the one month realized volatility broken down by cycle you’d think there is a trend here i.e. less and less extreme events each cycle. That might make Bitcoin “more predictable” as we move forward.
So let’s see what are your predictions for the price of BTC one month from now:
https://forms.gle/CHMSre6eExKhza767
That’s it for today. If you have learned something please subscribe and share to help the newsletter grow.
Cheers,
Nick


Awesome writeup as always!
Thank you! Much appreciated...