Ecoinometrics - Rate hikes, recession, market correction...
Looking past today’s FOMC decision
Pause or no pause, that is today’s question. For a strategic perspective though the closer we get to a recession the less important the rate hike cycle becomes. Because if we can take history as a guide the sequence is always the same: rate hike, recession, market correction.
Without data you are just another investor with an opinion.
The Ecoinometrics newsletter gives you insights from crypto and macro data to help you make better investment decisions.
Each issue of the newsletter tells you what you need to know in 5 minutes or less, direct to the point, with lots of charts to allow you to quickly visualize what’s important.
Join more than 20,000 subscribers here:
Done? Thanks! That’s great! Now let’s dive in.
P.S. Checkout our latest tracker of MicroStrategy Bitcoin holdings at https://www.ecoinometrics.com/microstrategy-bitcoin-holdings-with-charts/.
Rate hikes, recession, market correction...
The takeaway
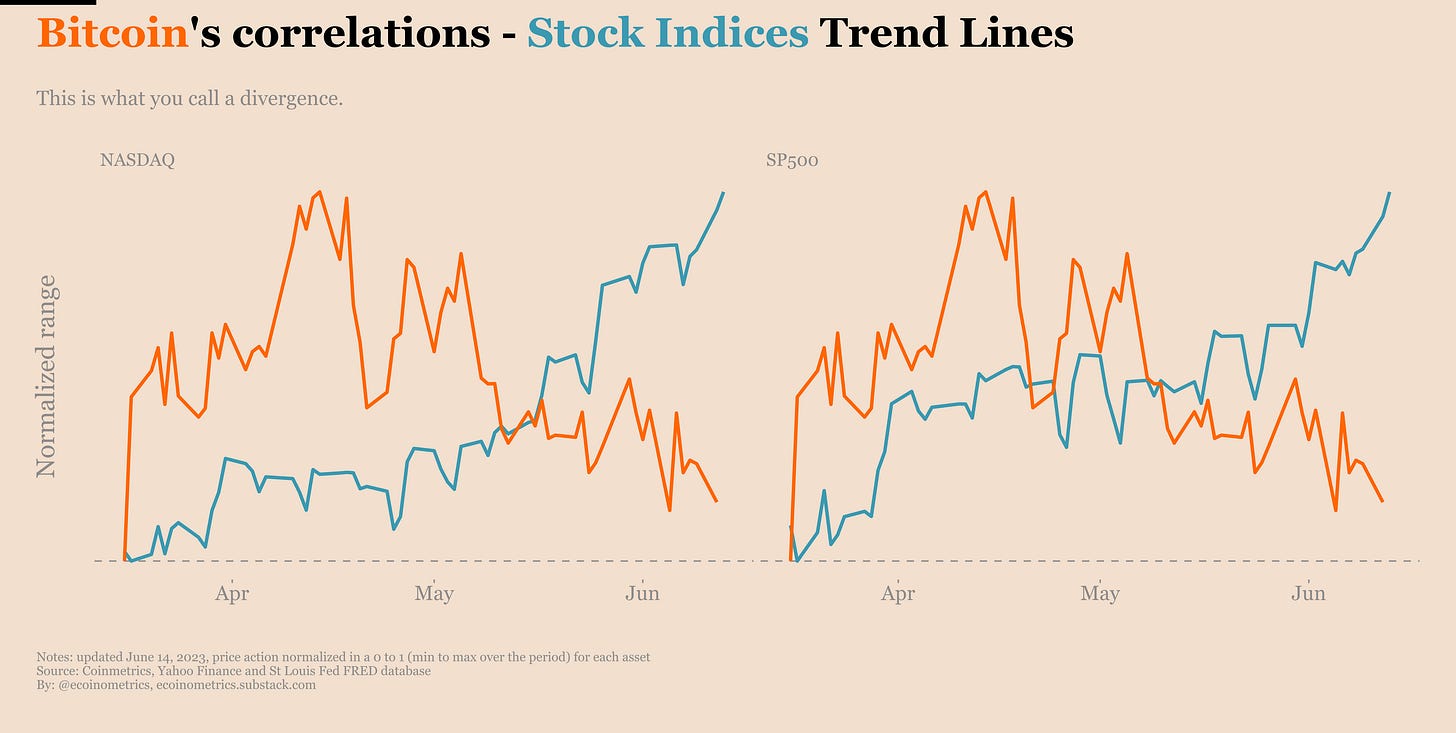
The financial markets in general are expecting the Federal Reserve to be done with rate hikes. You might even say that the stock market in particular is already looking forward to rate cuts at some point.
That’s pretty obvious from the divergence between Bitcoin and the major stock indices.
However there are a few things to keep in mind:
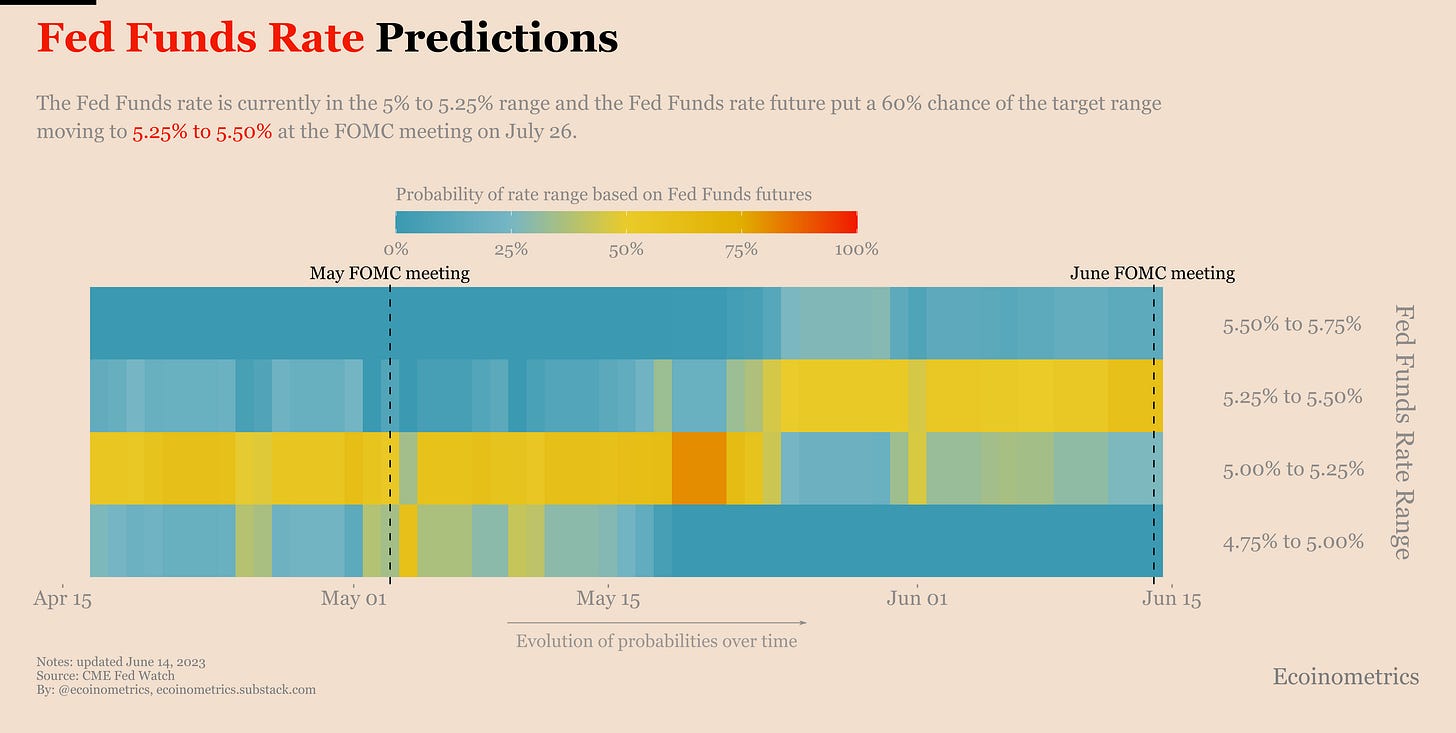
As of today, before the FOMC, the Fed Funds future are still pricing a rate hike in July.
But even if the Fed is done with that, recessions only typically start after the Fed Funds rate is at its apogee.
And in turn the stock market only bottoms after a recession is in progress.
So while there is nothing wrong in trading on momentum right now, don’t mistake the bear market rally for the start of the next 10-year long bull market.
But let’s dig into that.
Pricing no rate hike but…
There is a futures market for everything. Well maybe not everything but you can trade futures on Bitcoin, on crude oil, on sugar, on meat… and futures on the Fed Funds rate.
The good thing with these markets is that the price consensus tells us about where the traders in aggregate see the Fed Funds rate going over the upcoming FOMC meetings.
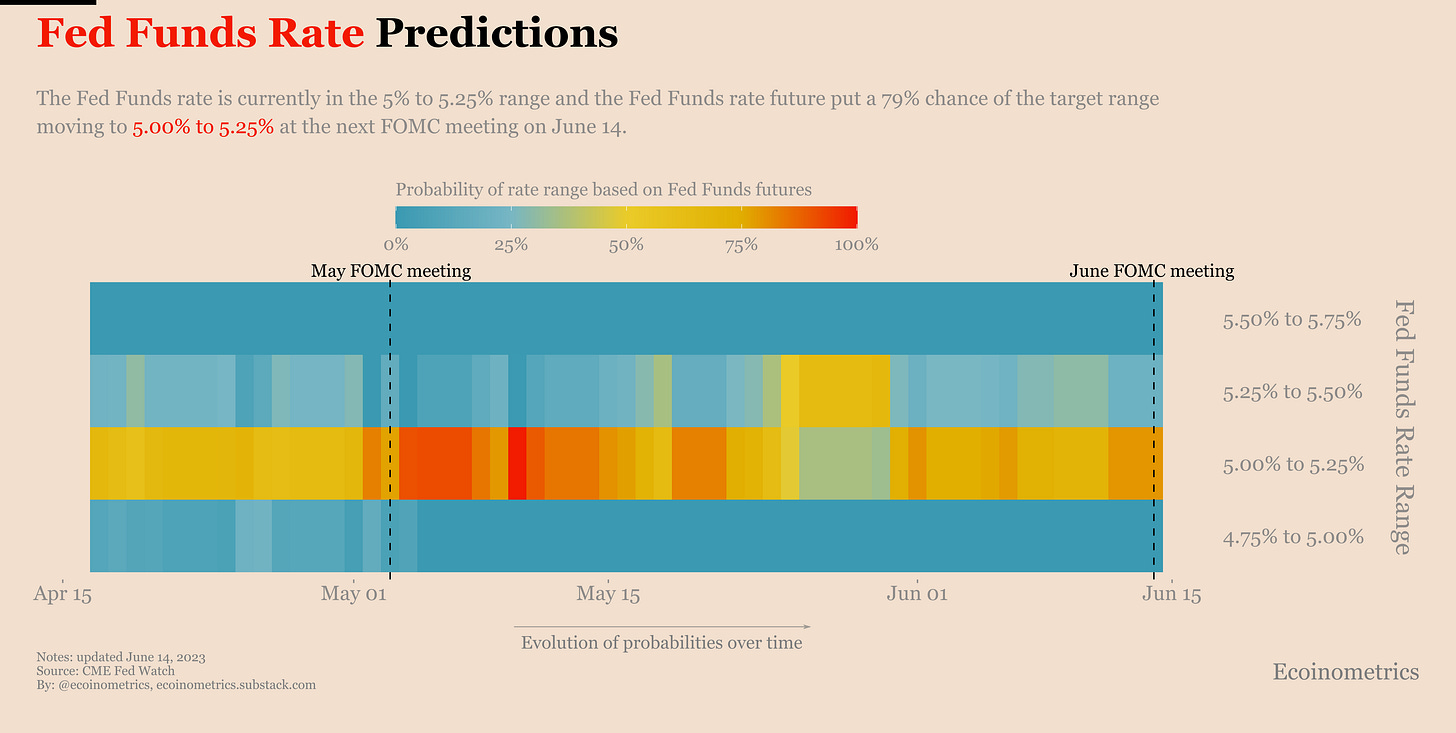
Of course this consensus is evolving over time with new data coming in and with various info being leaked out by the Fed. But the CME transforms this data into some nice probability distribution for the Fed Funds rate range at a given FOMC meeting and this is what we have plotted below.
Right now, on the day of the FOMC meeting the futures are putting a 79% chance of no rate hike. This close to the event itself this kind of prediction is almost always correct.
So those people whose job it is to bet on the Fed Funds rate say the FOMC is going to pause this rate hike cycle. But is it like a real pause, a turning point or just like taking a break?
Well interestingly the same Fed Funds rate futures market are currently putting a 60% chance of another rate hike at the FOMC meeting in July. This probability has increased over the past few days.
Of course we are one month away from the July FOMC meeting, lots of things can change, but the market is telling us that the Federal Reserve is more likely to take a break than to stop with the rate hikes completely.
That makes sense when you look at the data. And more rate hikes make sense from a strategic perspective for the Fed as I’ve made the case over here.
Unsatisfactory inflation trajectory
I don’t want to sound boring but I’m going to repeat myself again. The FOMC isn’t playing 4D chess. The US economy has an inflation problem. That’s the only thing that matters.
For months we’ve heard various commentators explain that the Federal Reserve is about to pivot because inflation is coming down or because regional banks are failing or any other flavour of the month. And you know what? No pivot yet.
The reason for that can be summarized in three lines:
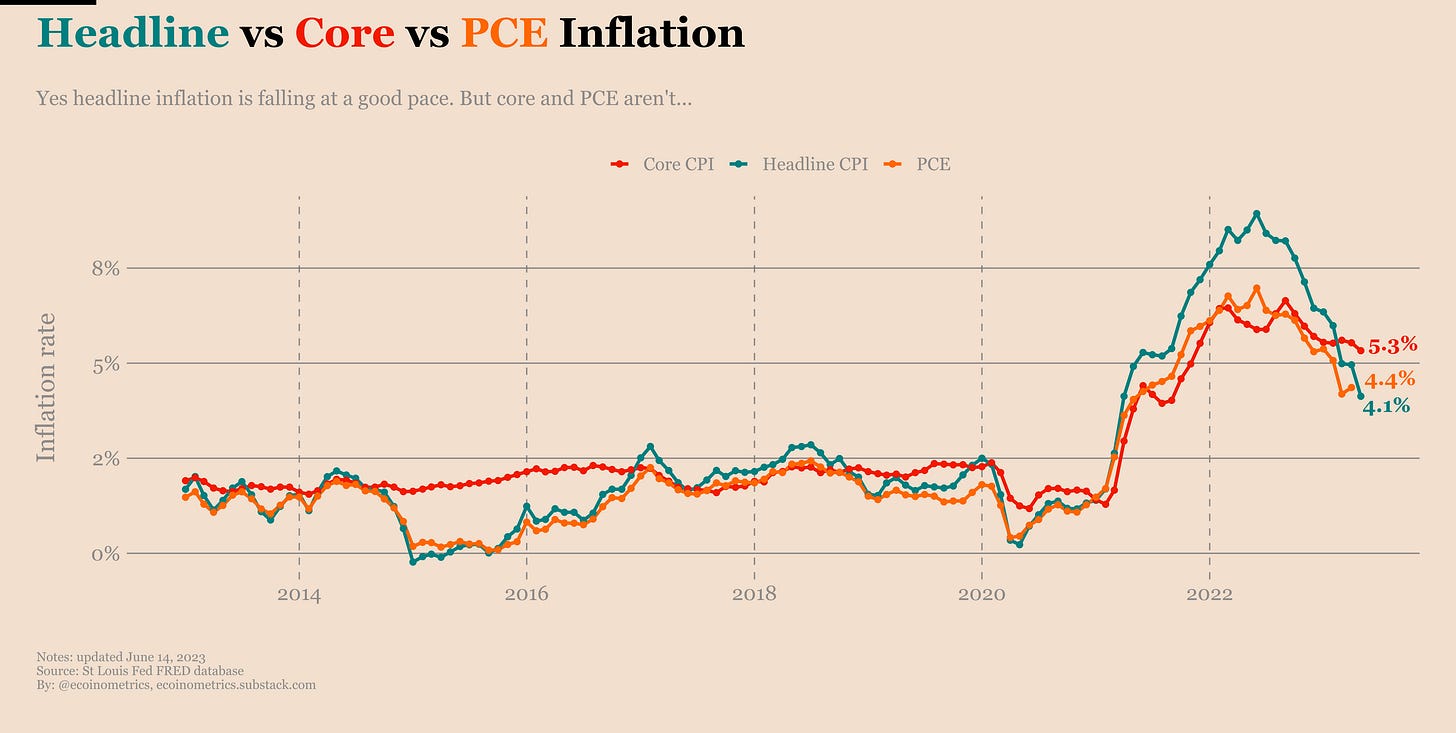
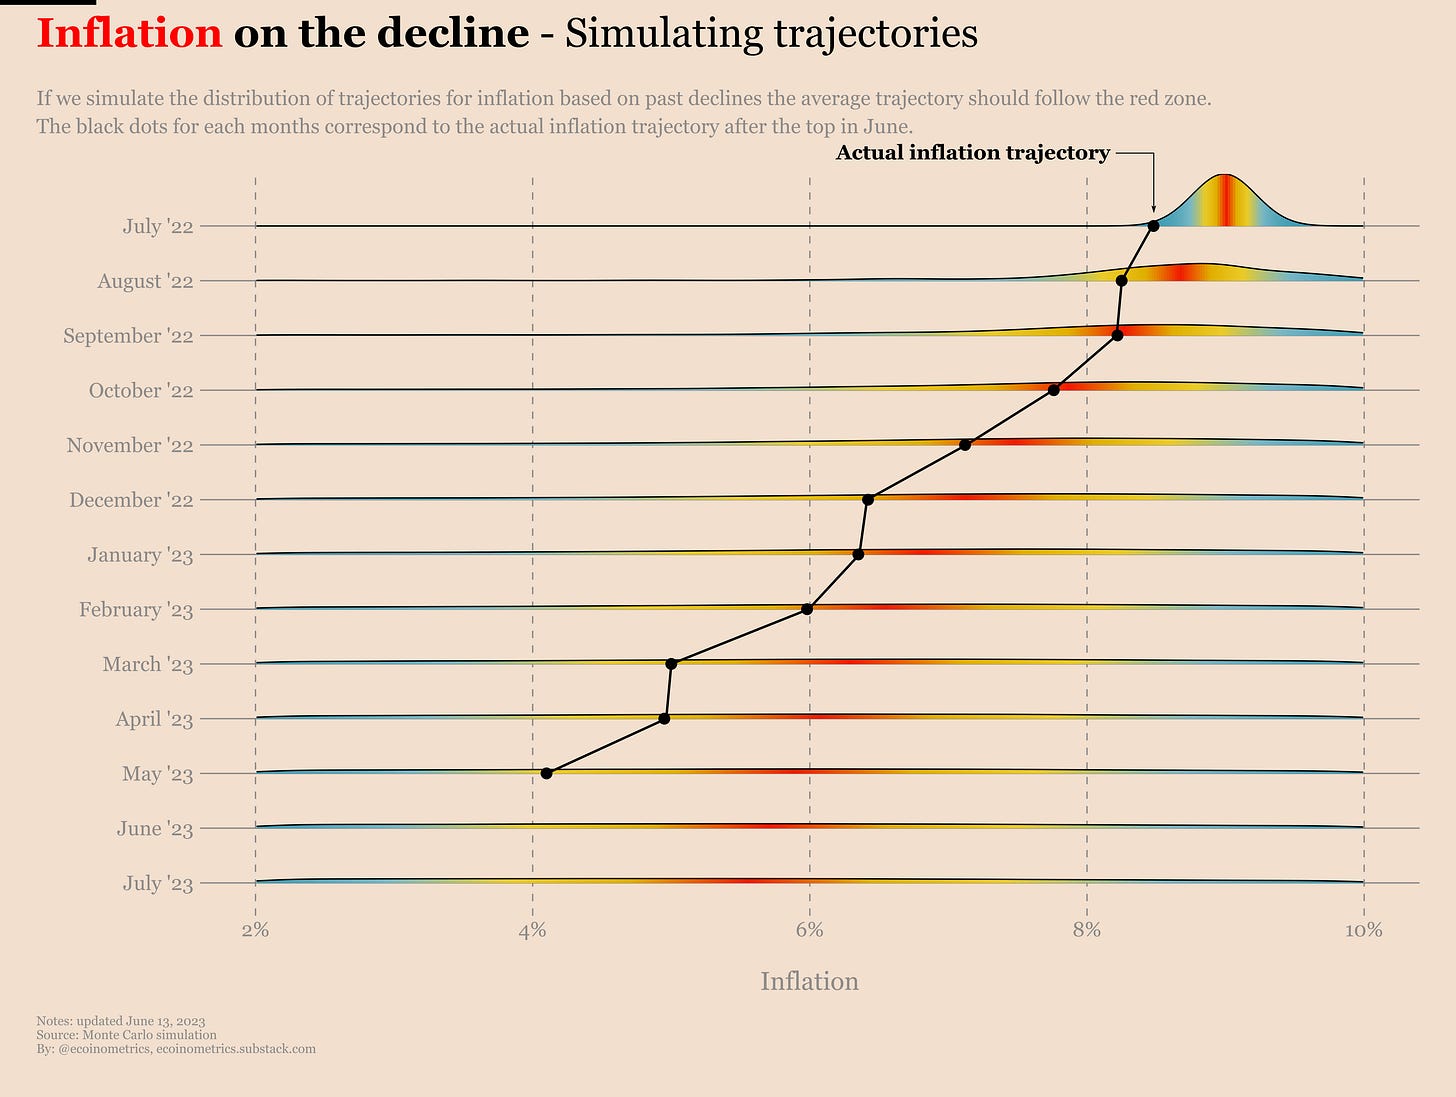
Headline inflation is coming down nicely, but that’s mostly about energy prices and the Fed has little control over that.
PCE inflation, the preferred inflation measure of the Fed, is also coming down. But that path is not smooth and the pace is definitely much slower than headline.
Core inflation is one notch above that. Sure if you zoom it we have downtrend, but it is painfully slow.
See for yourself.
So for all the pain that the Fed went through by doing the most aggressive rate hike sequence in 60 years, they haven’t achieved that much. And they know it.
At the same time they also know that it takes time for higher interest rates to start really putting pressure on the real economy. The first affected are the activities that require raising new debt, like buying a house or financing a startup, that kind of thing. Or operating a bank where your whole business model is doing some form or rates arbitrage. Those activities have been hit already.
The ones that haven’t been hit yet are more related to debt refinancing. Of course that’s massive since the US economy runs on debt. But you aren’t running around refinancing your debt all the time so naturally the effect of the rate hikes comes with a delay.
We are more than one year in this rate hike cycle though. So the FOMC has some ground in calling for a pause and selling a “wait and see” approach based on headline inflation following a typical post-peak cool-down trajectory.
But pause or no pause, the important part is what comes next.
The standard sequence
From a macro perspective, what’s going to make the difference between a bear market rally and the conditions for the start of a new long term growth phase?
The answer is: where we fall in the sequence of rate hikes, recession, acute market crisis.
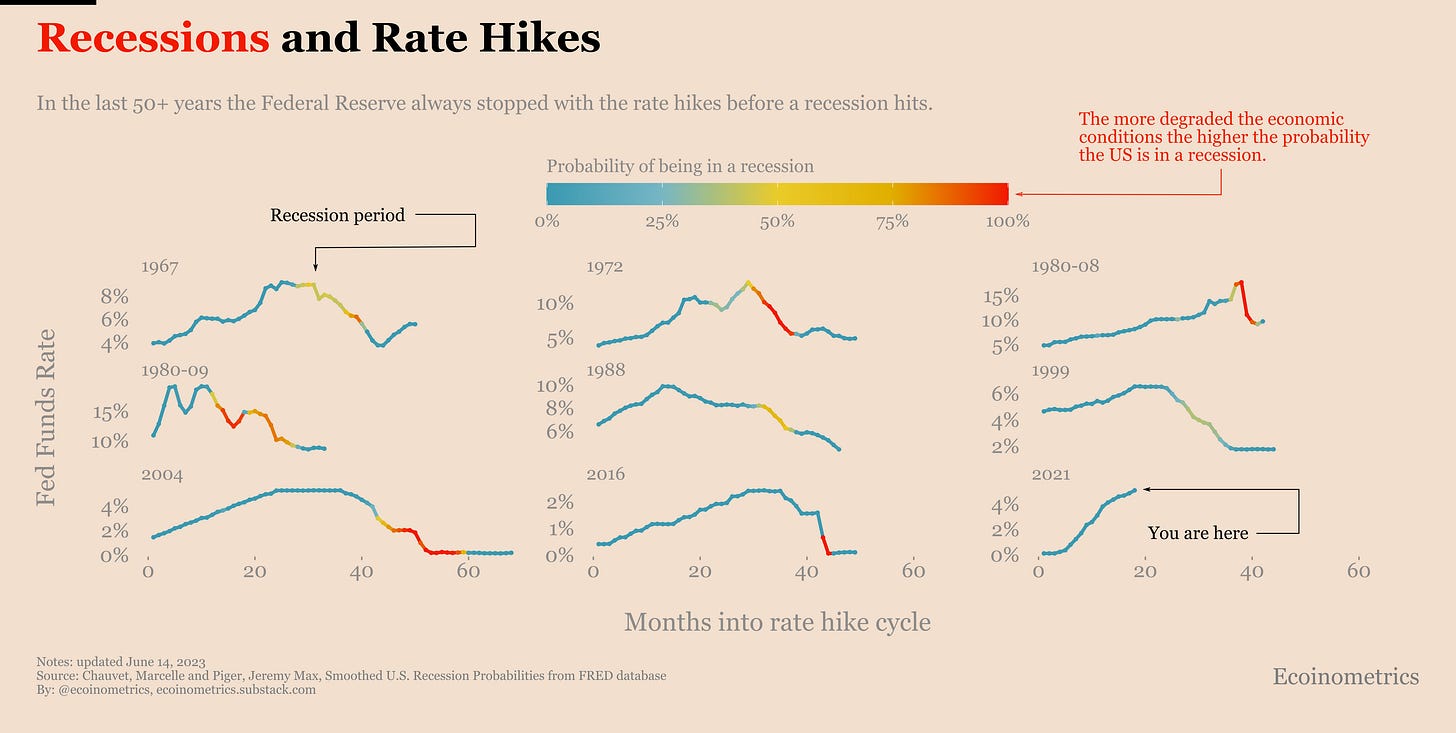
Take the chart below. Going back to the 1960s I have extracted the Fed Funds rate evolution during each rate hike cycle. Overlaid on top of that is an indicator showing the economic situation of the US using “real time” data (i.e. not declared after the fact by the NBER) as a probability that the economy is already in a recession.
Check it out and tell me what you notice there.
That’s right, the rate hike cycle typically ends before, or just at the time the economic situation becomes so degraded it is moving in recession territory.
That’s the first step of the sequence. Rate hikes playing out until the Fed has achieved its goal or the economic situation is so bad they need to stop.
At the bottom right corner of the chart you can see the current situation. Blue. Very blue. That basically means based on the current economic data there is almost 0% chance the US economy is already in a recession. So if the Fed thinks they haven’t reached their goal, nothing stops them for pushing this further.
Does that mean that risk assets have bottomed by the time the Federal Reserve “pivot”?
Well, no.
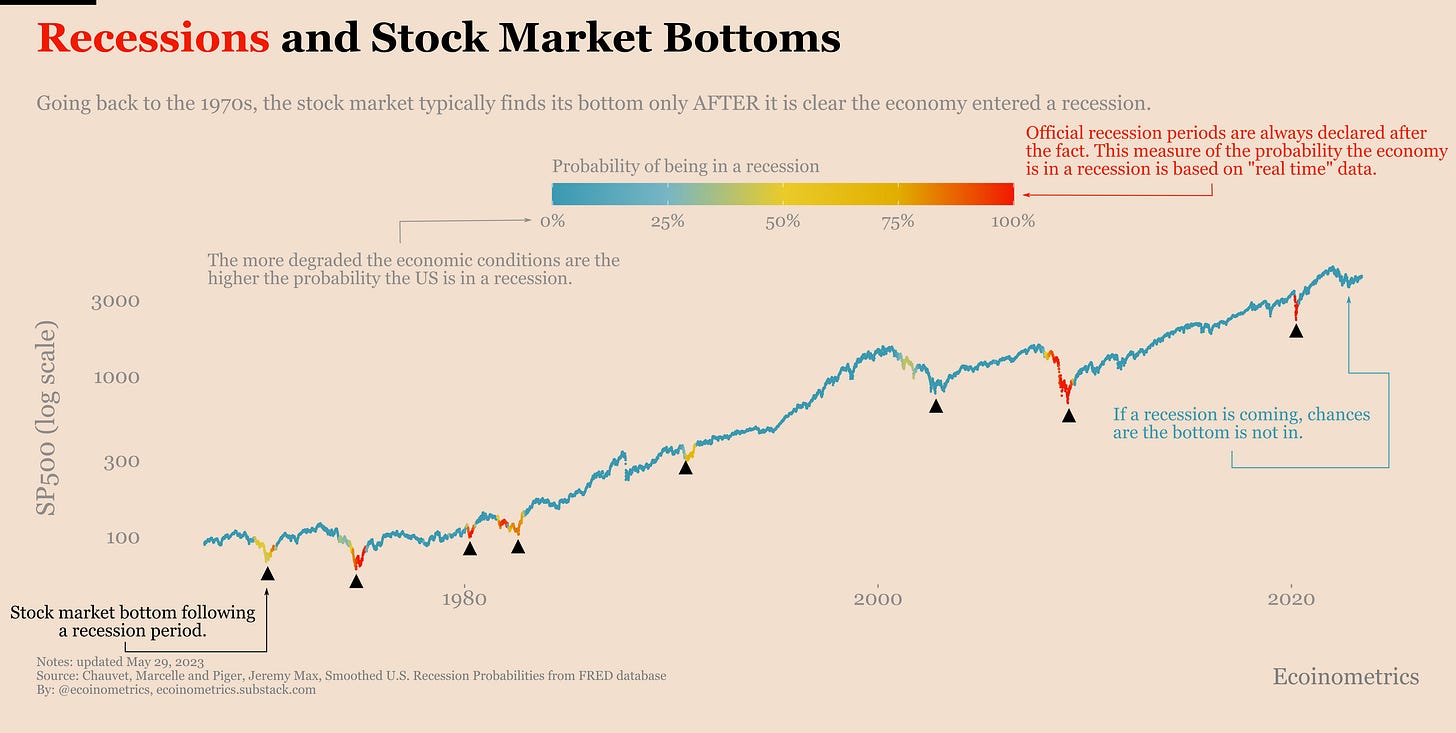
You need to let the second step play out, the recession, before the recovery phase can really start. That’s because, without a fault, since the 1960s the stock market (that’s our proxy for risk assets) bottoms in a moment of acute crisis only during or after a recession.
That’s what you can see on that chart below.
If you were around during the COVID crash you know that during moments of acute market crisis the first thing that happens is that everything becomes correlated. It does not matter if you are holding stocks, gold or Bitcoin. Investors that need to meet margin calls will sell anything they can to get cash.
So do not think that Bitcoin decoupling from the stock market means you are safe from whatever is coming.
By all means profit from any bear market rally we might experience in the 6 months. But don’t get caught mistaking a bear market rally for a bull market until the macro conditions are ripe for it.
Bitcoin derivatives
Let’s close it for today with a quick tour of the CME Bitcoin derivatives. We’ll be real quick because there is not much new to talk about.
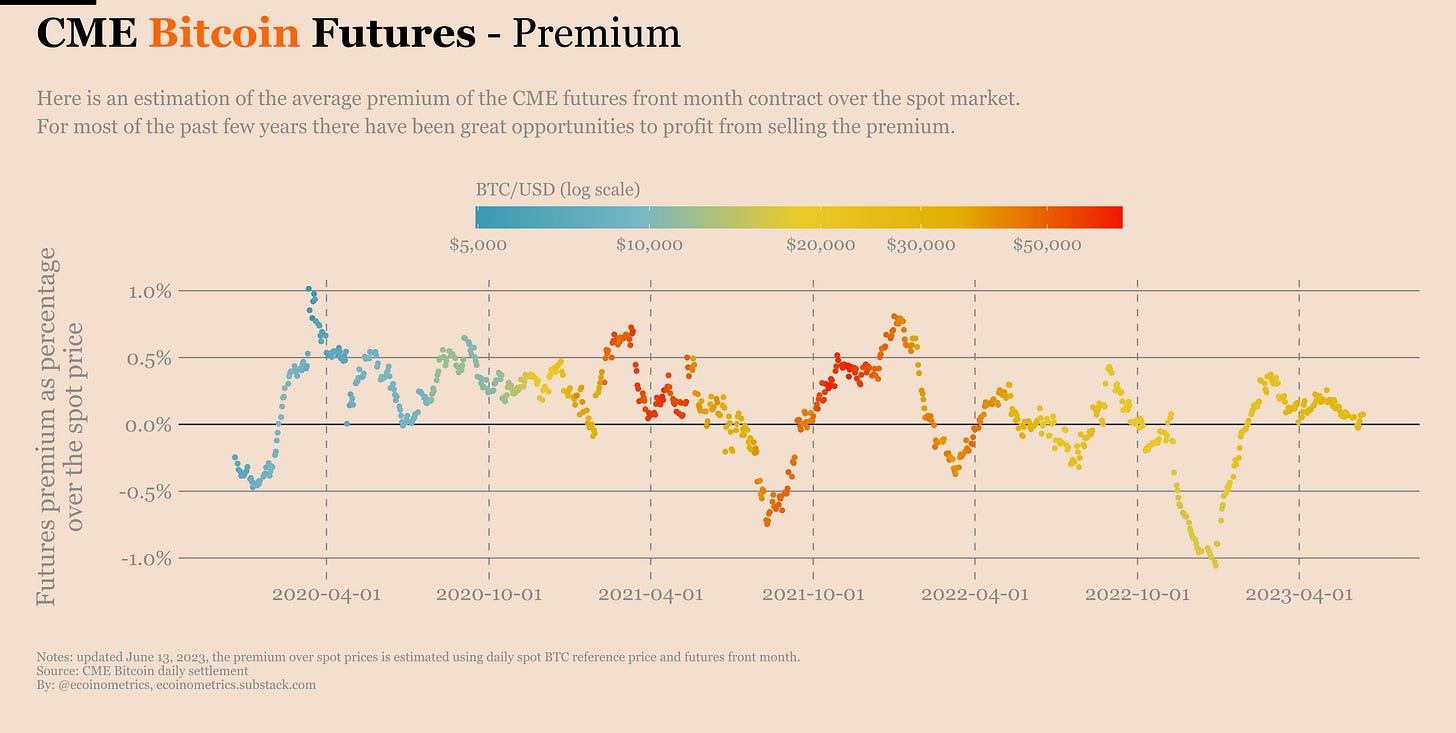
CME Futures
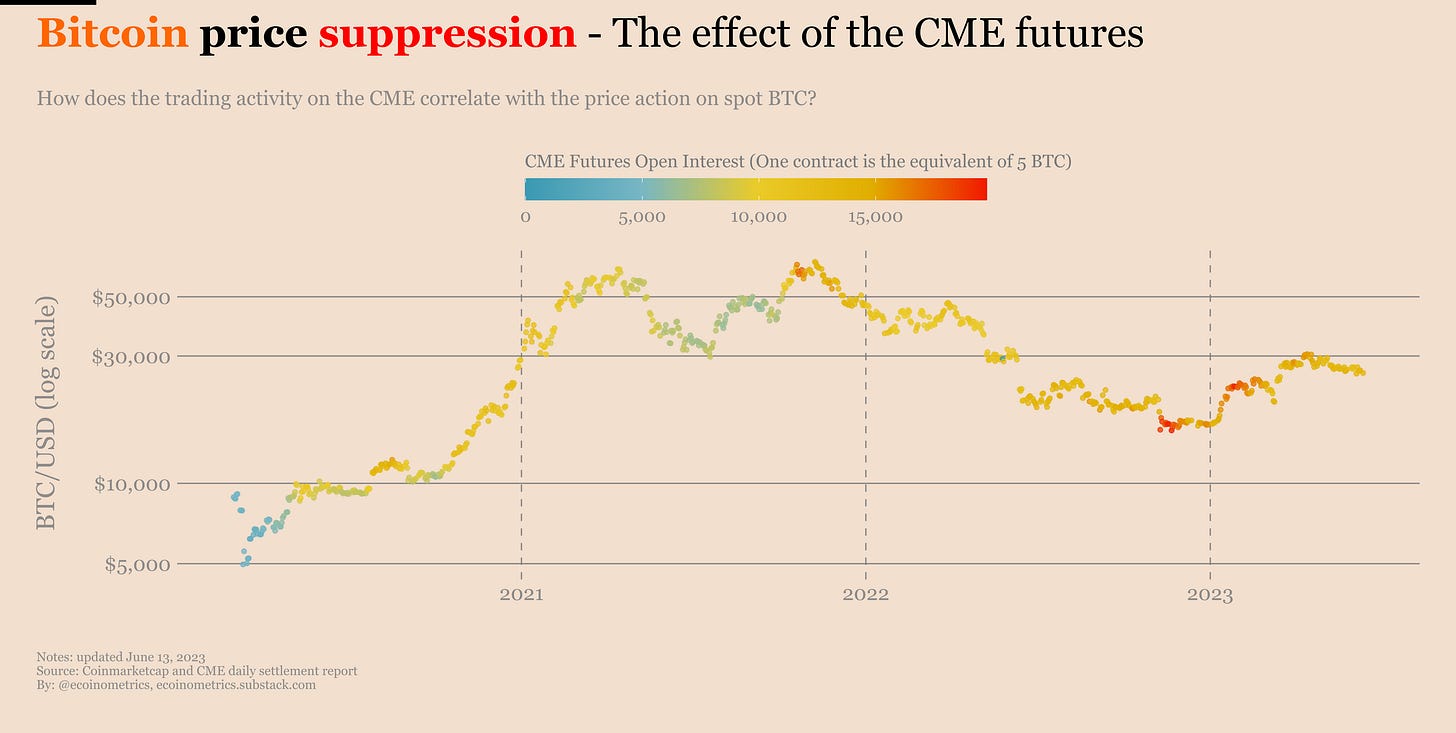
You can tell traders are not rushing to get long exposure to Bitcoin given that the premium of the futures over the spot market is basically 0.
The activity on the CME futures itself has been stable, the open interest is around the same level it was three months ago.
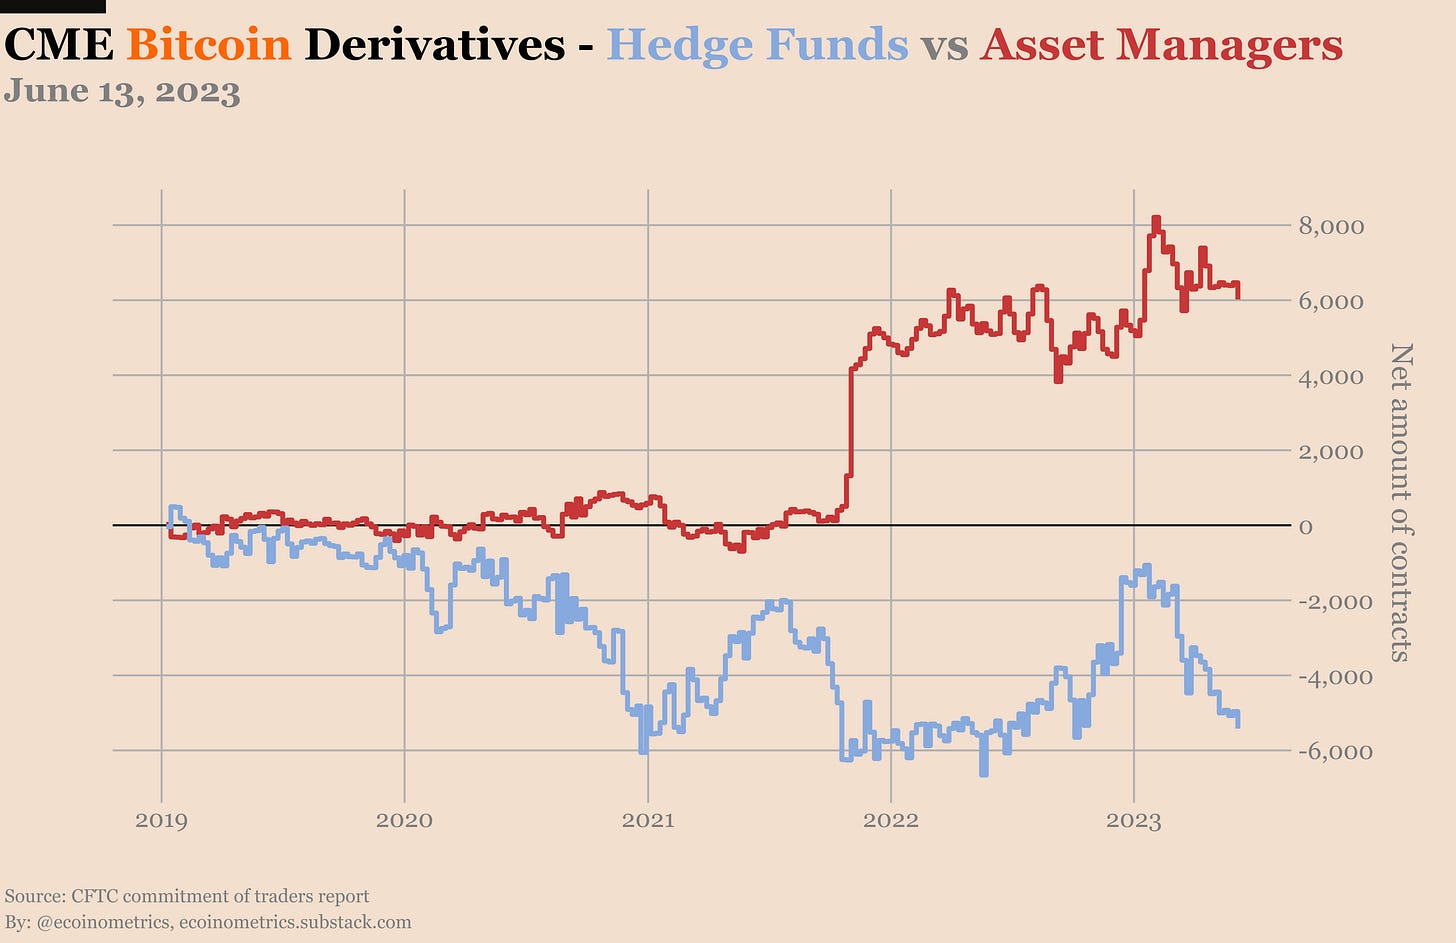
You won’t be surprised to see asset managers and hedge funds take on some more short positions given the regulatory show the SEC is putting around crypto in the US. But that’s probably just a temporary reaction given that Bitcoin itself isn’t really the focus in this story.
CME options
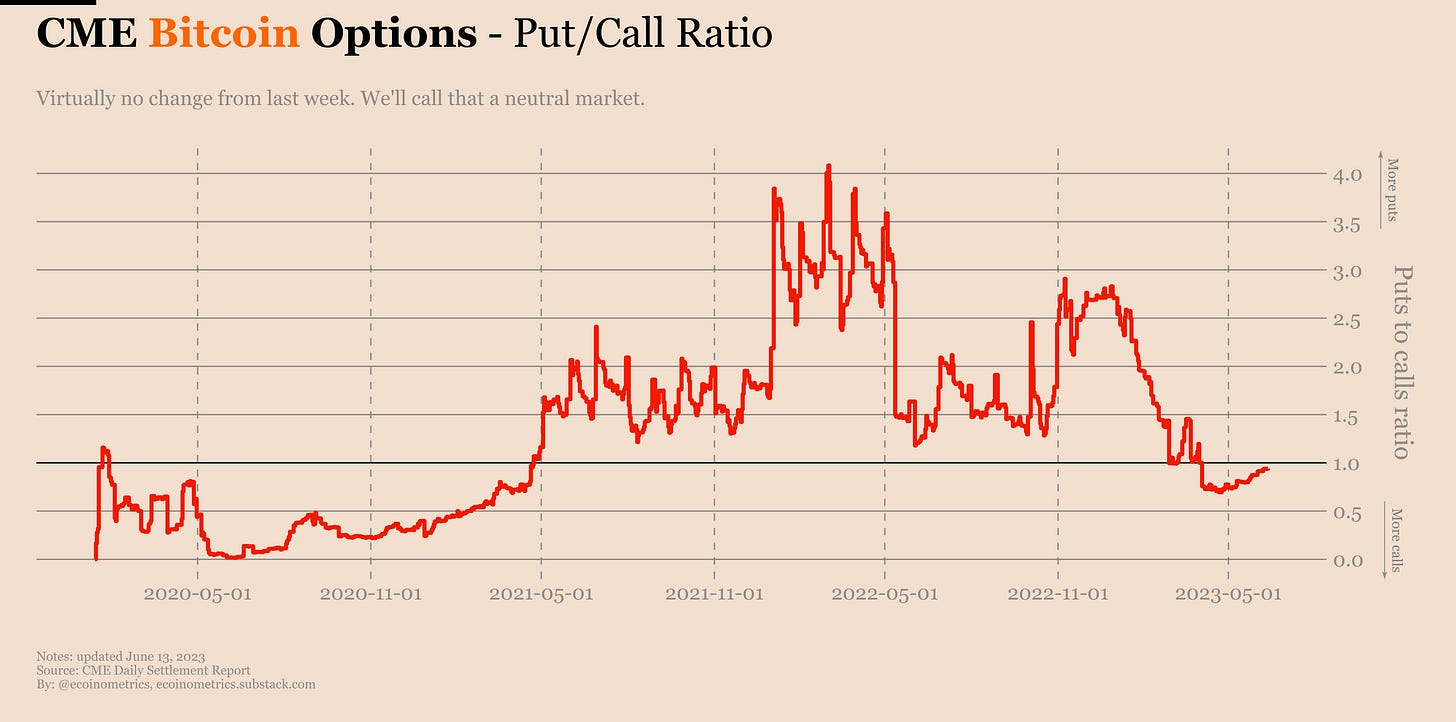
On the options side, the puts to calls ratio is about even. Will be interesting to see how long it stays there. Since the Bitcoin options were introduced on the CME in 2020 the puts to calls ratio has mostly oscillated between extremes. What we haven’t seen much of is a market lacking a clear sense of direction.
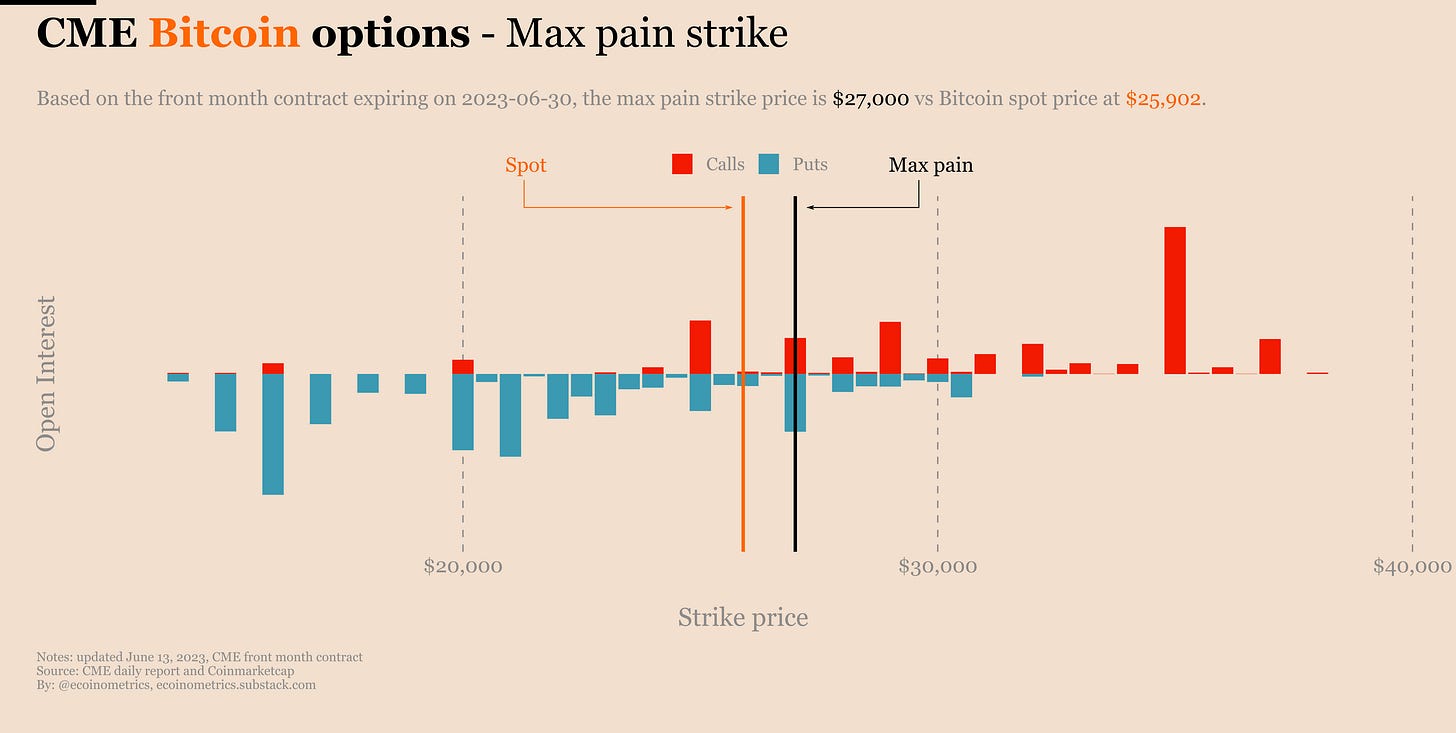
Meanwhile the max pain strike is pinned at $27k. For once it is not very far from spot BTC, but it is still a while until the expiration date. And as we have analyzed in the second part of this newsletter, the max pain strike doesn’t seem to have much sway on spot BTC anyway.
Let’s see how that plays out.
That’s it for today. If you have any question don’t hesitate to reply to this email and I’ll get back to you.
If you have learned something please like and share to help the newsletter grow.
Don’t forget to checkout other resources on the Ecoinometrics website such as:
A dollar cost averaging performance calculator for the stock market.
Which assets really hold up against inflation over the long run.
If you are already a free subscriber please consider upgrading to a paid tier to get the full access including:
Investment insights on crypto and macro backed by data.
All that delivered to you twice a week, read in less than 5 minutes and completed with data visualizations.
Cheers,
Nick
P.S. For weekly threads and hot takes follow Ecoinometrics on Twitter.


