


Ecoinometrics - September 30, 2020
People are worried about correlations (again)...

Here is the problem. People have been sold that Bitcoin is an uncorrelated asset. But when they look at the current market conditions what are they seeing? Gold, the stock market and Bitcoin are moving in parallel…
So is this uncorrelated asset thing just a lie?
As usual the answer to this kind of question is to just take a step back.
The Ecoinometrics newsletter decrypts Bitcoin’s place in the global financial system. If you want to get an edge in understanding the future of finance you only have to do two things:
Click on the subscribe button right below.
Follow Ecoinometrics on Twitter at https://twitter.com/ecoinometrics.
Done? That’s great! Thank you and enjoy.
But first let's take a look at what has people worried. Since the market crash in March it looks like everything is moving in parallel.
There is a simple explanation for that: 2020 has been just one big move that started in February.
We can break it in phases.
Phase 1 is the liquidity event. During that period the stock market goes down significantly. Traders get hit by margin calls and need to raise cash. The result is that they sell their hard assets to meet the margin calls and everything goes down.
Phase 2 is the rebound phase. The Fed injects a massive amount of liquidity in the market and everybody starts buying. The money flows to all financial assets. This time things are rising in parallel.
Phase 3 where we are right now. As we are moving away from the initial shock we expect two things:
- The markets are ready to react to anything that might look like another crash.
- Investors bid up the price of hard assets. That includes Bitcoin and gold.
If you look at the 1 month correlation time series for BTC versus gold, the SP500 and crude oil WTI you can see those different phases playing out.

And since 2020 is mostly this long price action sequence around the crash it isn't particularly surprising to observe that Bitcoin is not completely uncorrelated to other assets.
As a quick reminder a correlation coefficient of 1 means that the assets are moving always in the same direction, a correlation coefficient of -1 means that the assets are moving always in opposite directions and a correlation coefficient of 0 means that the assets are moving totally independently of each other.
Now check out the correlation matrix for this year:
The correlation coefficient between gold and Bitcoin is 0.39
The correlation coefficient between the SP500 and Bitcoin is 0.45
The correlation coefficient between the SP500 and gold is 0.41
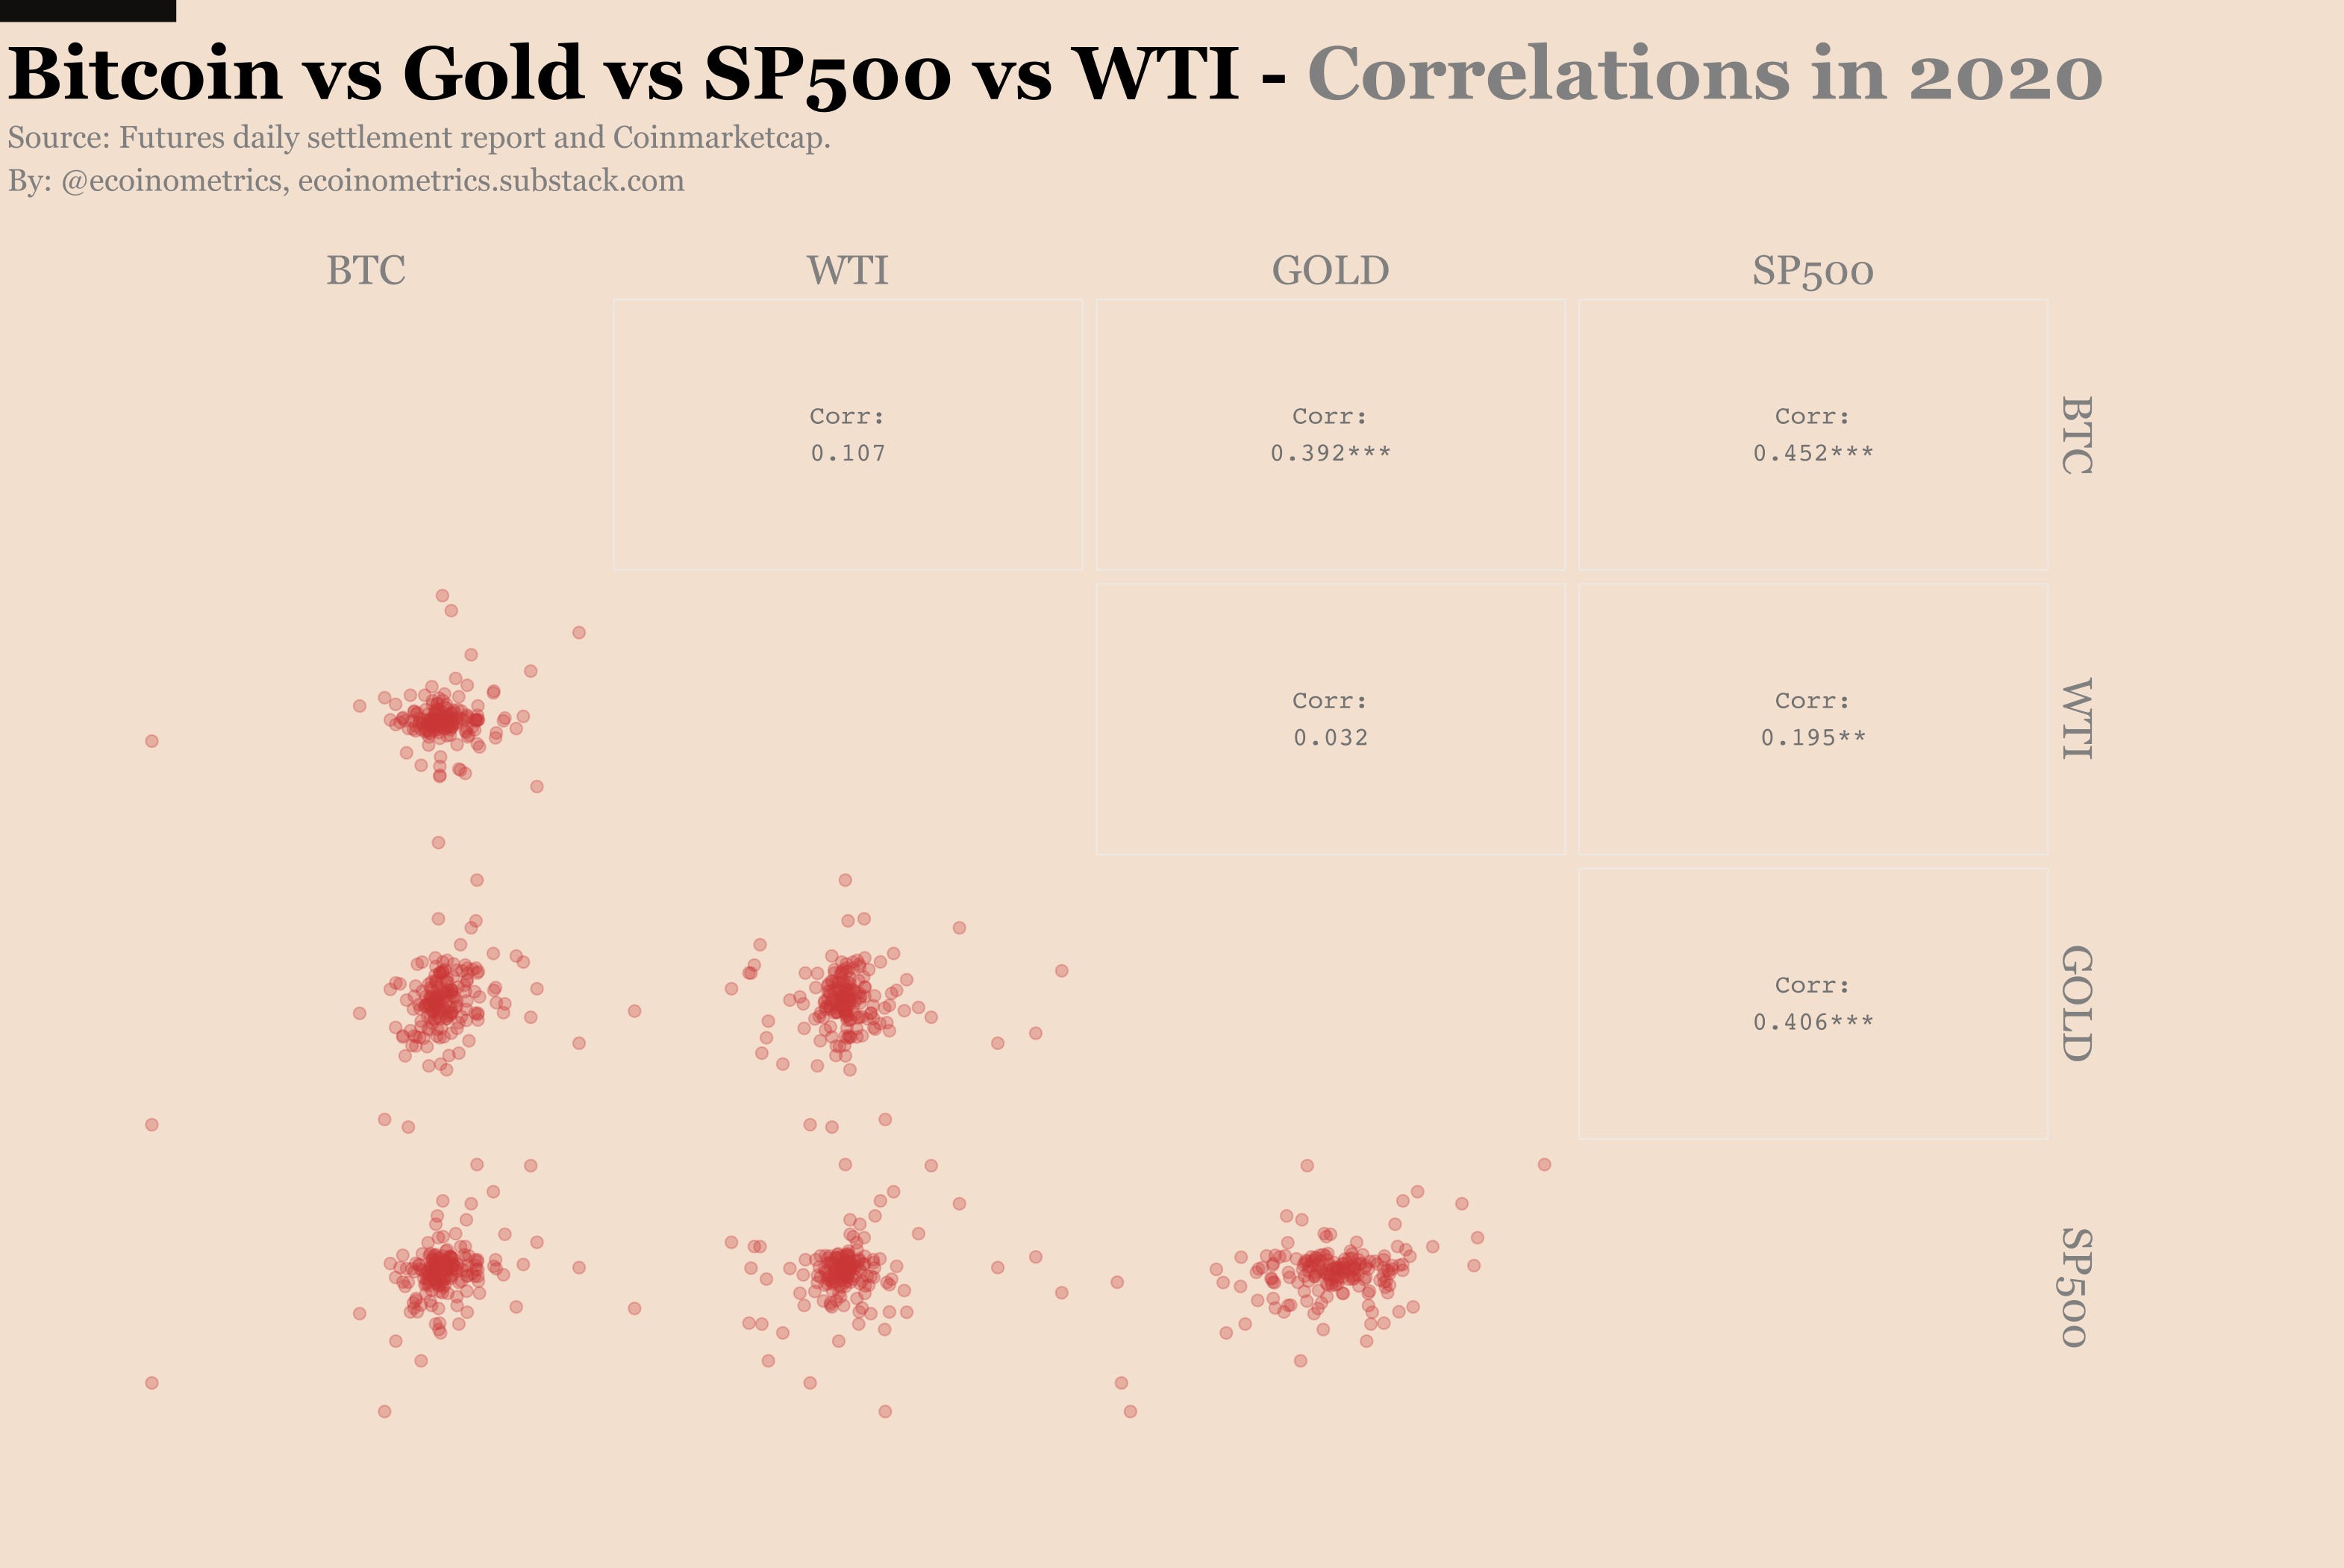
To be fair that’s not super high, but it does indicate that those assets tend to move in the same direction a little bit more than usual.
But what's important is that as we get past the crisis you can expect things to go back to normal.
And what is normal?
Well you just have to zoom out of 2020 to see what the situation was before we moved into this very particular moment in time.
See for yourself...


Yep that’s correct. Over a long period of time those assets are pretty much uncorrelated!
You might still be worried that we won't get back to normal...
I’m not.
There are plenty of reasons why BTC should start decoupling from the other asset classes.
Here are a few of them:
- Central banks are pursuing QE policies that can't help but debasing fiat currencies at an increasing rate. That should drive more investors towards hard assets and help with the decoupling between Bitcoin and the stock market.
- Of course gold and Bitcoin are prime candidates to benefit from the inflow of money into hard assets. But Bitcoin massive upside potential makes it a more attractive investment than gold. So both assets should benefit, but Bitcoin will benefit more. That should help with the decoupling between Bitcoin and gold.
- Finally, a compounding effect that should accelerate the decoupling is the halving. With each halving cycle Bitcoin becomes more scarce. This jump in scarcity has so far always been followed by a phase of exponential growth. Four months after the halving this phase has not started yet.
So as usual, I recommend you consider the long term view. When you zoom out it only looks like a great time to buy.
Moving on to the CME Bitcoin derivatives the market has been sluggish to say the least.
There was some spike in trading activity around the expiration of the September contract last week. But since then traded volume has been very average.


The fact that it looks like Bitcoin is going nowhere at the moment is putting the futures traders to sleep.
The bulls should be happy that the $10,000 level has held so well. After all we are in a record streak above $10,000... but it feels like the excitement is missing. Most likely traders are waiting for a move towards $14k to start building their positions. For now $10k is the new normal.
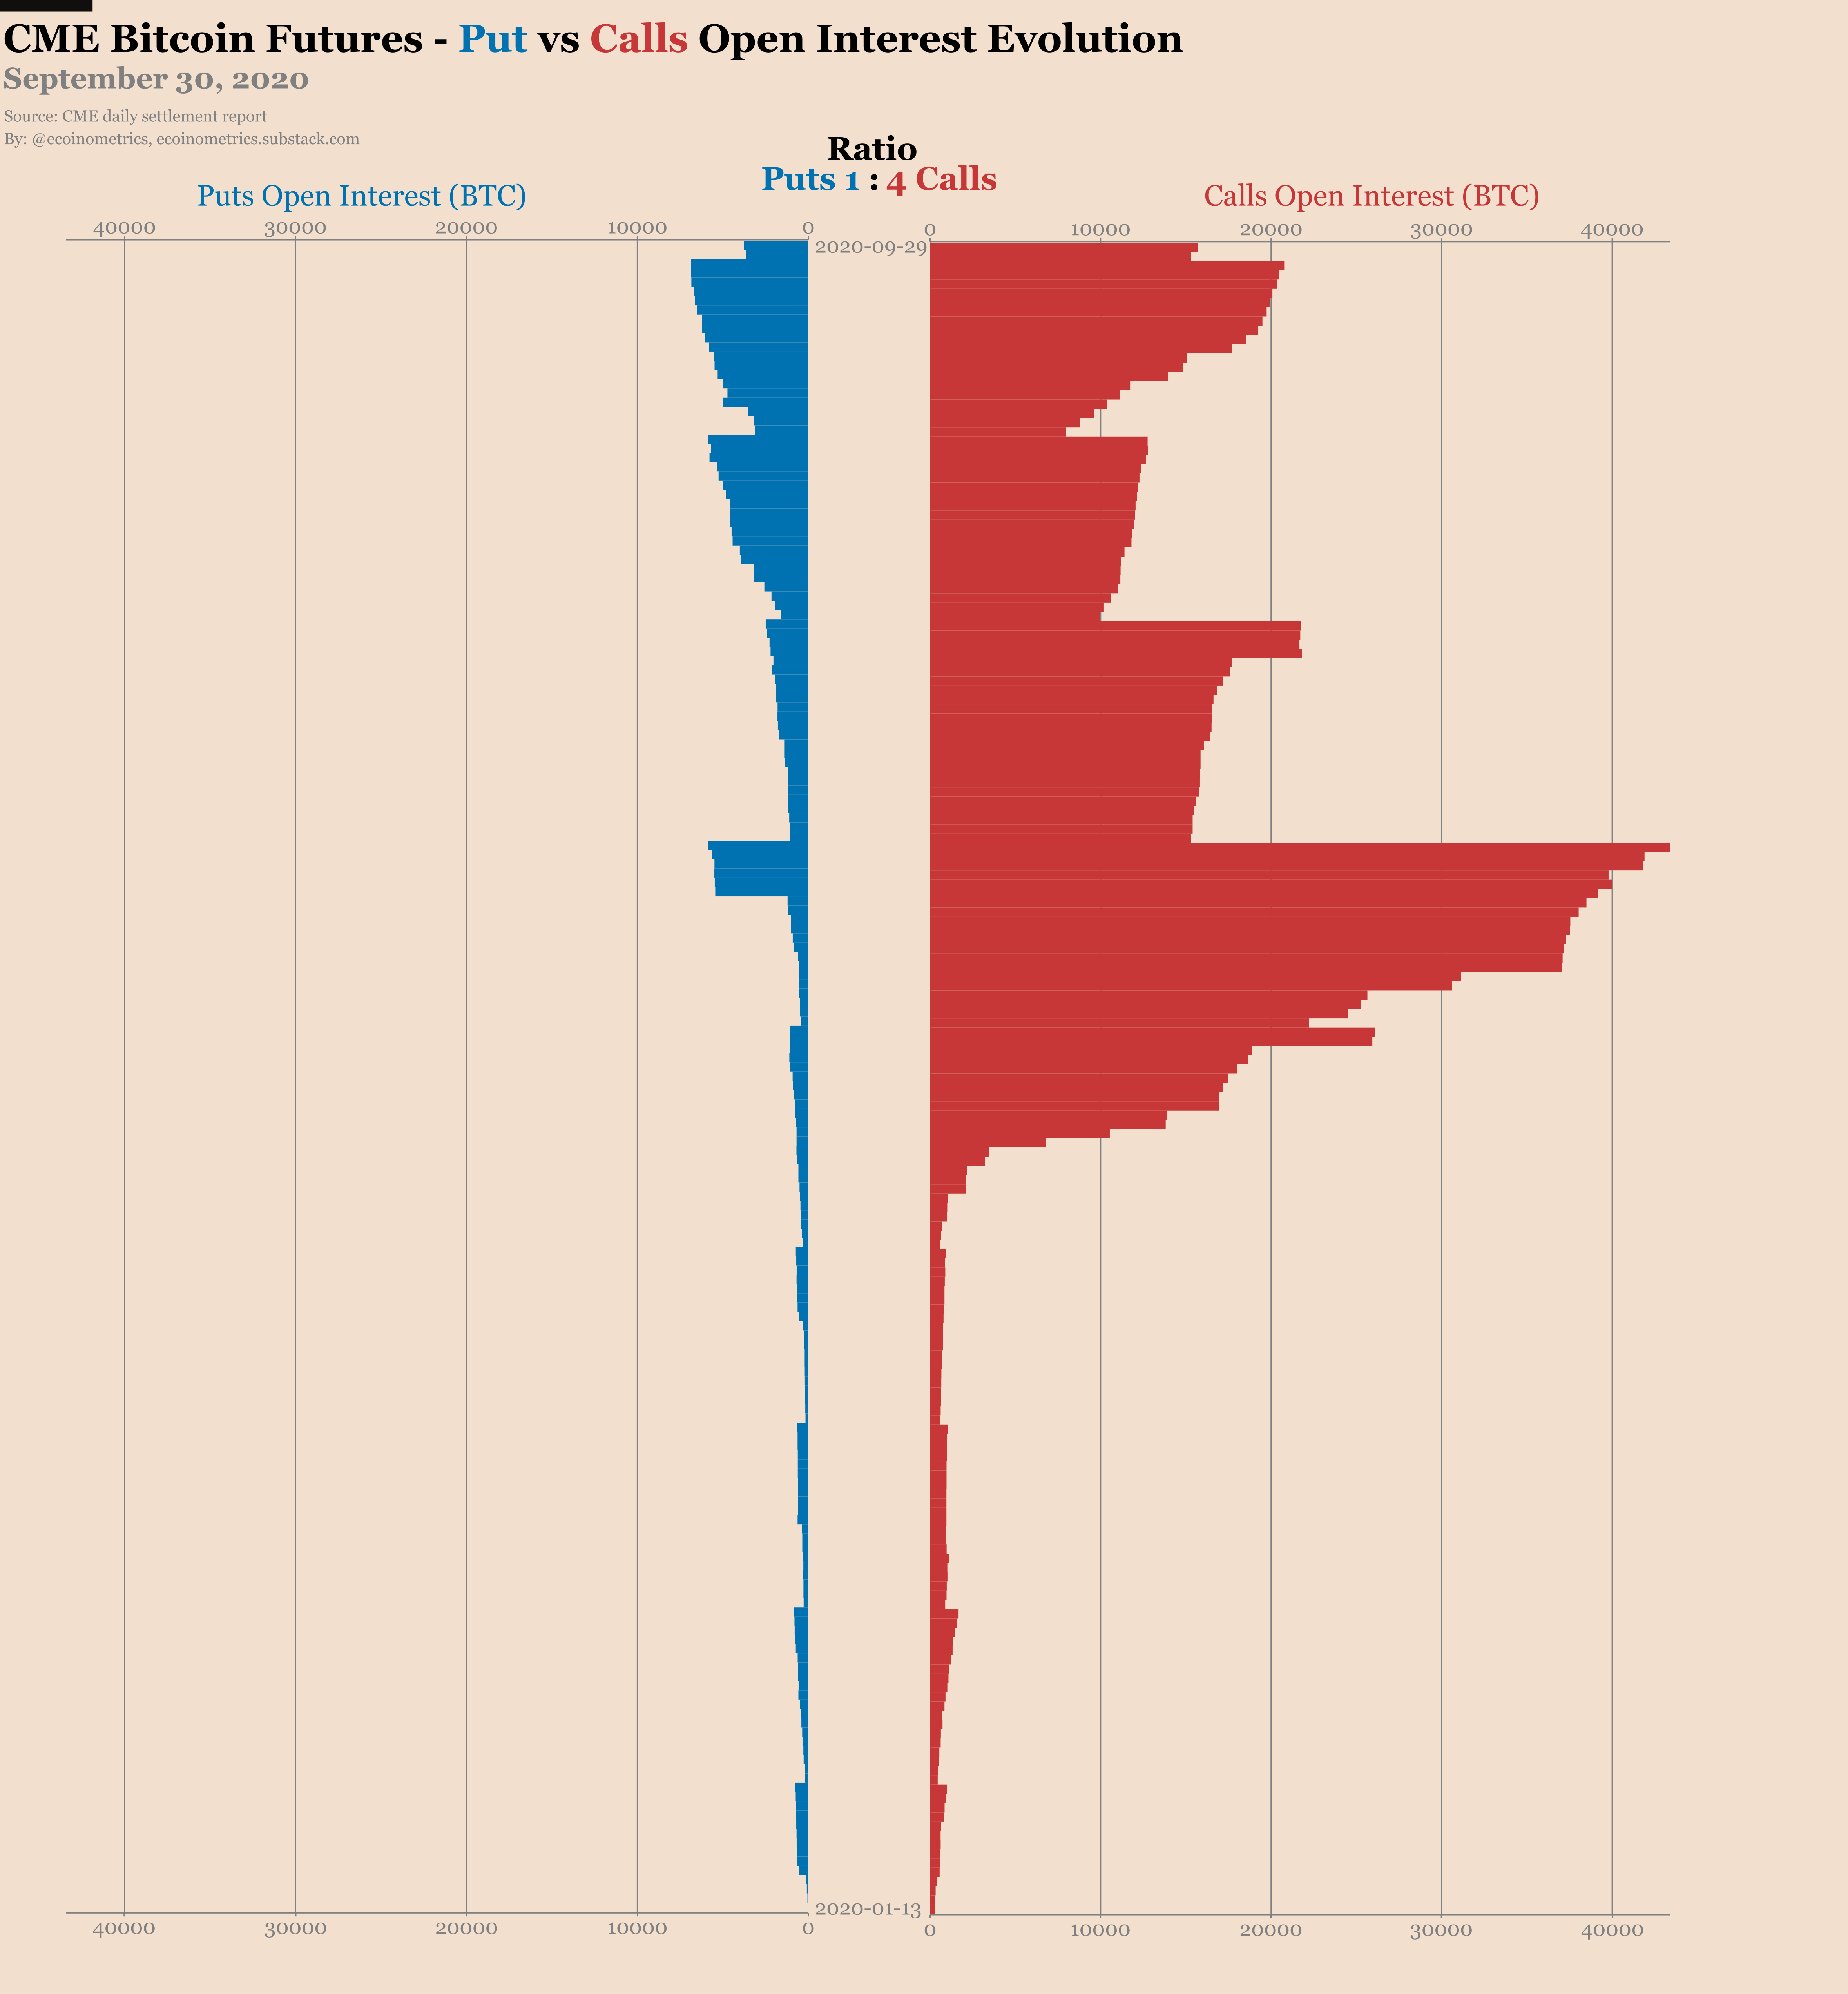
On the options side the calls still dominate the market. As of today there are 4 calls for every put. So at least some people are betting that the bull run will start this year.
They have been wrong in the past though. Timing is a complicated business. If you have the option to simply hodl go for it.

Looking at the Commitment of Traders report dated September 22 you might say that there is a lack of commitment of the bulls:
- Retail traders are not adding to their net long position.
- Same goes for the smart money where asset managers are having trouble moving far above neutral.


My guess is that it will take FOMO to seriously kick in before we start seeing the trend following crowd entering the market in a major way.
We are still early. You haven't missed the boat. It is a perfect time to accumulate more Bitcoins!
That’s it for today. If you have learned something please subscribe and share to help the newsletter grow.
Cheers,
Nick
The Ecoinometrics newsletter decrypts Bitcoin’s place in the global financial system. If you want to get an edge in understanding the future of finance you only have to do two things:
Click on the subscribe button right below.
Follow Ecoinometrics on Twitter at https://twitter.com/ecoinometrics.
Done? That’s great! Thank you and enjoy.