


Ecoinometrics - The KiS portfolio one year later
In retrospect was it a good or a bad idea?

A lot of metrics points towards a major economic downturn for the US economy later this year. And it doesn’t help that in the name of fighting inflation the Federal Reserve is doing everything it can to accelerate this outcome.
As a consequence of that I’ve been warning you for more than a year against taking any major risk before the macro winds turn.
That being said, last year I also said that if you have a long enough time horizon and you aren’t playing with leverage then you should not overthink this bear market too much:
Either dollar cost average your way into assets with high growth potential.
Or if you have a bunch of capital to deploy move into long term positions as soon as possible.
And to exemplify option (2) I decided to start tracking the “Keep it Simple” portfolio. Here is where we are at one year later.
Without data you are just another investor with an opinion.
The Ecoinometrics newsletter gives you insights from crypto and macro data to help you make better investment decisions.
Each issue of the newsletter tells you what you need to know in 5 minutes or less, direct to the point, with lots of charts to allow you to quickly visualize what’s important.
Join more than 19,000 subscribers here:
Done? Thanks! That’s great! Now let’s dive in.
The KiS portfolio one year later
What’s the idea behind the Keep it Simple portfolio
When it comes to investing I am a big proponent of the Keep it Simple Stupid approach. As someone who has worked as a quant in the hedge fund business I’ve seen time and time again that overcomplicating investment strategies only lead to more brittle systems.
Simple doesn’t mean easy. But simple strategies are as a rule:
Easier to reason about.
Easier to monitor for performance.
More adaptable and more robust to various market conditions.
Have less chance to be overfitted to the past.
Are executed at a lower cost because they do not require complex setups or lots of trades.
Of course you can make money with complex strategies. But why bother if you can get pretty good results with much less effort.
So the key points behind the Keep it Simple portfolio are that:
If you only care about the performance of your portfolio on a 5 to 10 years horizon you don’t have to play the game of timing the bottom.
If your portfolio includes asymmetric bets then you don’t need to apply any leverage to generate good returns.
With (1) and (2) you have a lot of staying power which means you are more likely to maximize your time in the market.
To put this idea to the test I decided to track a very simple portfolio initially deploying $1m split among:
The SP500 (via SPY) with 40% of the initial capital.
Bitcoin (via spot BTC) with 20% of the initial capital.
Ethereum (via spot ETH) with 20% of the initial capital.
Cash reserves for the last 20%.
Cash reserves can be used as dry powder in a bear market and as ammunitions for momentum trades in a bull market. We can rebalance the portfolio if the proportions get completely out of whack.
Over time we deployed part of the cash to buy ETH on one of the dips and we are still holding on to some dry powder to buy:
More BTC at $15k if that day ever comes.
More SPY at 3,200 again if that day ever comes.
On one occasion it looked like we were going to trigger these two levels but unfortunately that was a miss. But given that we aren’t done with this bear market a liquidity crisis could still bring us down to those levels in a flash crash. We’ll see.
Regardless, let’s review how this portfolio has performed so far.
Overall performance
As of today we are up +1.78%. I guess you might label that as not being very impressive. But at the same I don’t expect this portfolio to perform particularly well until we are on the other side of the upcoming recession.
Check out the current composition and the breakdown of the performance asset by asset.

Bitcoin is the only line in red and the reason is that we failed to buy any more dip to lower our BTC cost basis. Because that’s what we did for ETH and that turned out ok.
Overall after a year the composition of the portfolio is pretty close to where it started. On the chart below you can see the evolution of the proportion of each asset in the portfolio.

What I expect is that until we are in the real recovery phase of this bear market the proportions should be unchanged. But at some point Bitcoin and Ethereum would start to outpace the SP500 and take a much larger space. We aren’t there yet.
Bitcoin and Ethereum have been the most volatile part of the portfolio. At some point these two positions were down almost 50%. You might think that we should have waited for that to happen before buying, but hindsight is 20/20.
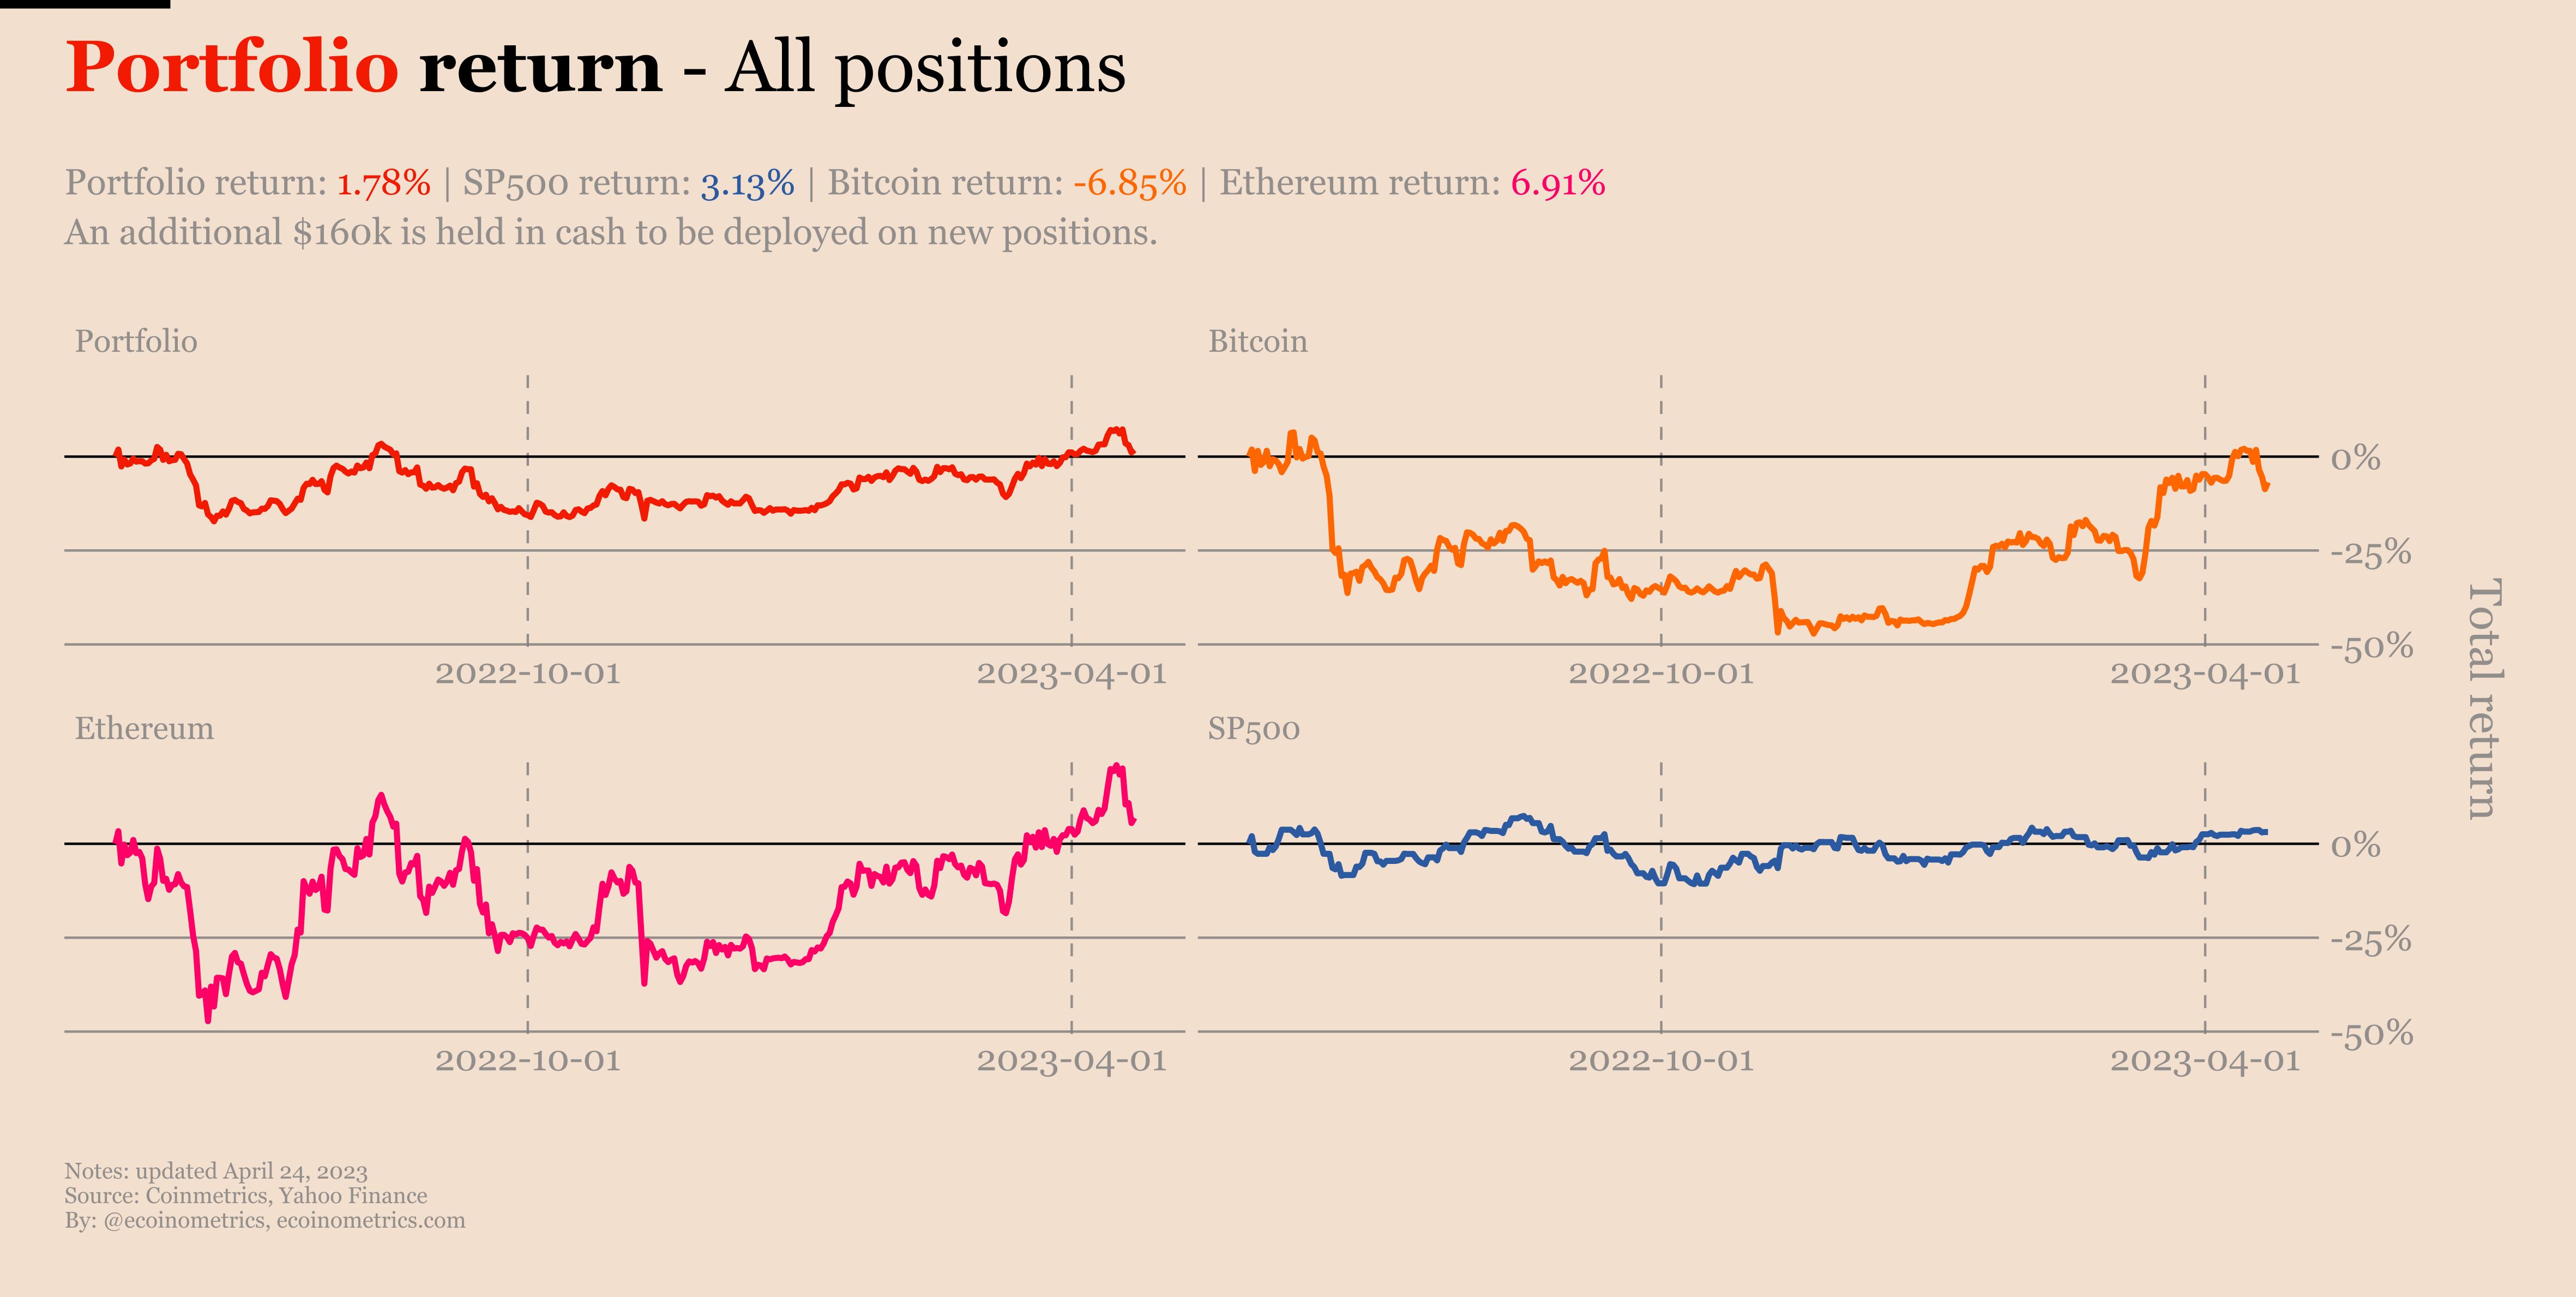
Now the combination of the BTC and ETH positions is less than half of the portfolio, so as a whole we never went down more than 20%.
That being said I still think there is 50% chance we have not seen the bottom of this bear market. So this portfolio could see much more downside but at the same time that would mean we get the opportunity to deploy the rest of our cash for very good deals.
With no leverage and a 5 years time horizon there is no reason to sweat the downside volatility.
Correlations and concentration
One criticism you might have with this portfolio is that it is very correlated and concentrated on three positions. But again that’s by design.
I don’t see the macro environment permanently change to a state of austerity. The financial system runs on debt which means central banks will ultimately act in a way that boosts risk assets more than anything else.
So again, over a long term horizon betting on a very conservative risk asset which is the SP500 and two high potential asymmetric bets is the way to go.
Now ideally we would have positions on risk assets that are not highly correlated. That’s really hard to find these days and as you can see on the chart below:
BTC and ETH have an extremely high correlation score.
Crypto and the SP500 also have a relatively high correlation score.

But the thesis is the following:
BTC and ETH are completely different investment thesis. So over a long enough timeline you’d expect the correlation to get less strong.
If the Bitcoin as a store of value narrative prevails, there is no reason for it to trade the same way as the stock market.
Anyway if at the end of the day you get three correlated risk assets that go up in value then it is worth more than keeping your daily volatility low.
Should you do something similar now
So almost one year after we got in this portfolio the performance is basically flat. We are back at square one. Which raises the question: if you had are starting with cash right now, should you apply the exact same strategy?
Well my answer is yes. The exact same reasoning as last year still applies:
You are already getting a good deal at the current price levels.
You can keep some dry powder to deploy capital during a liquidity crisis.
The long term upside potential for all these assets hasn’t changed.
Your call.
Update on Balaji’s Bitcoin bet
Seems that Balaji’s Bitcoin bet is slowly fading away from everyone’s memory but for the sake of consistency let’s checkout where it’s at today.
We have 6 weeks to go and there is absolutely no sign that Bitcoin is being bought en masse as a safe haven for the upcoming wave of hyperinflation.

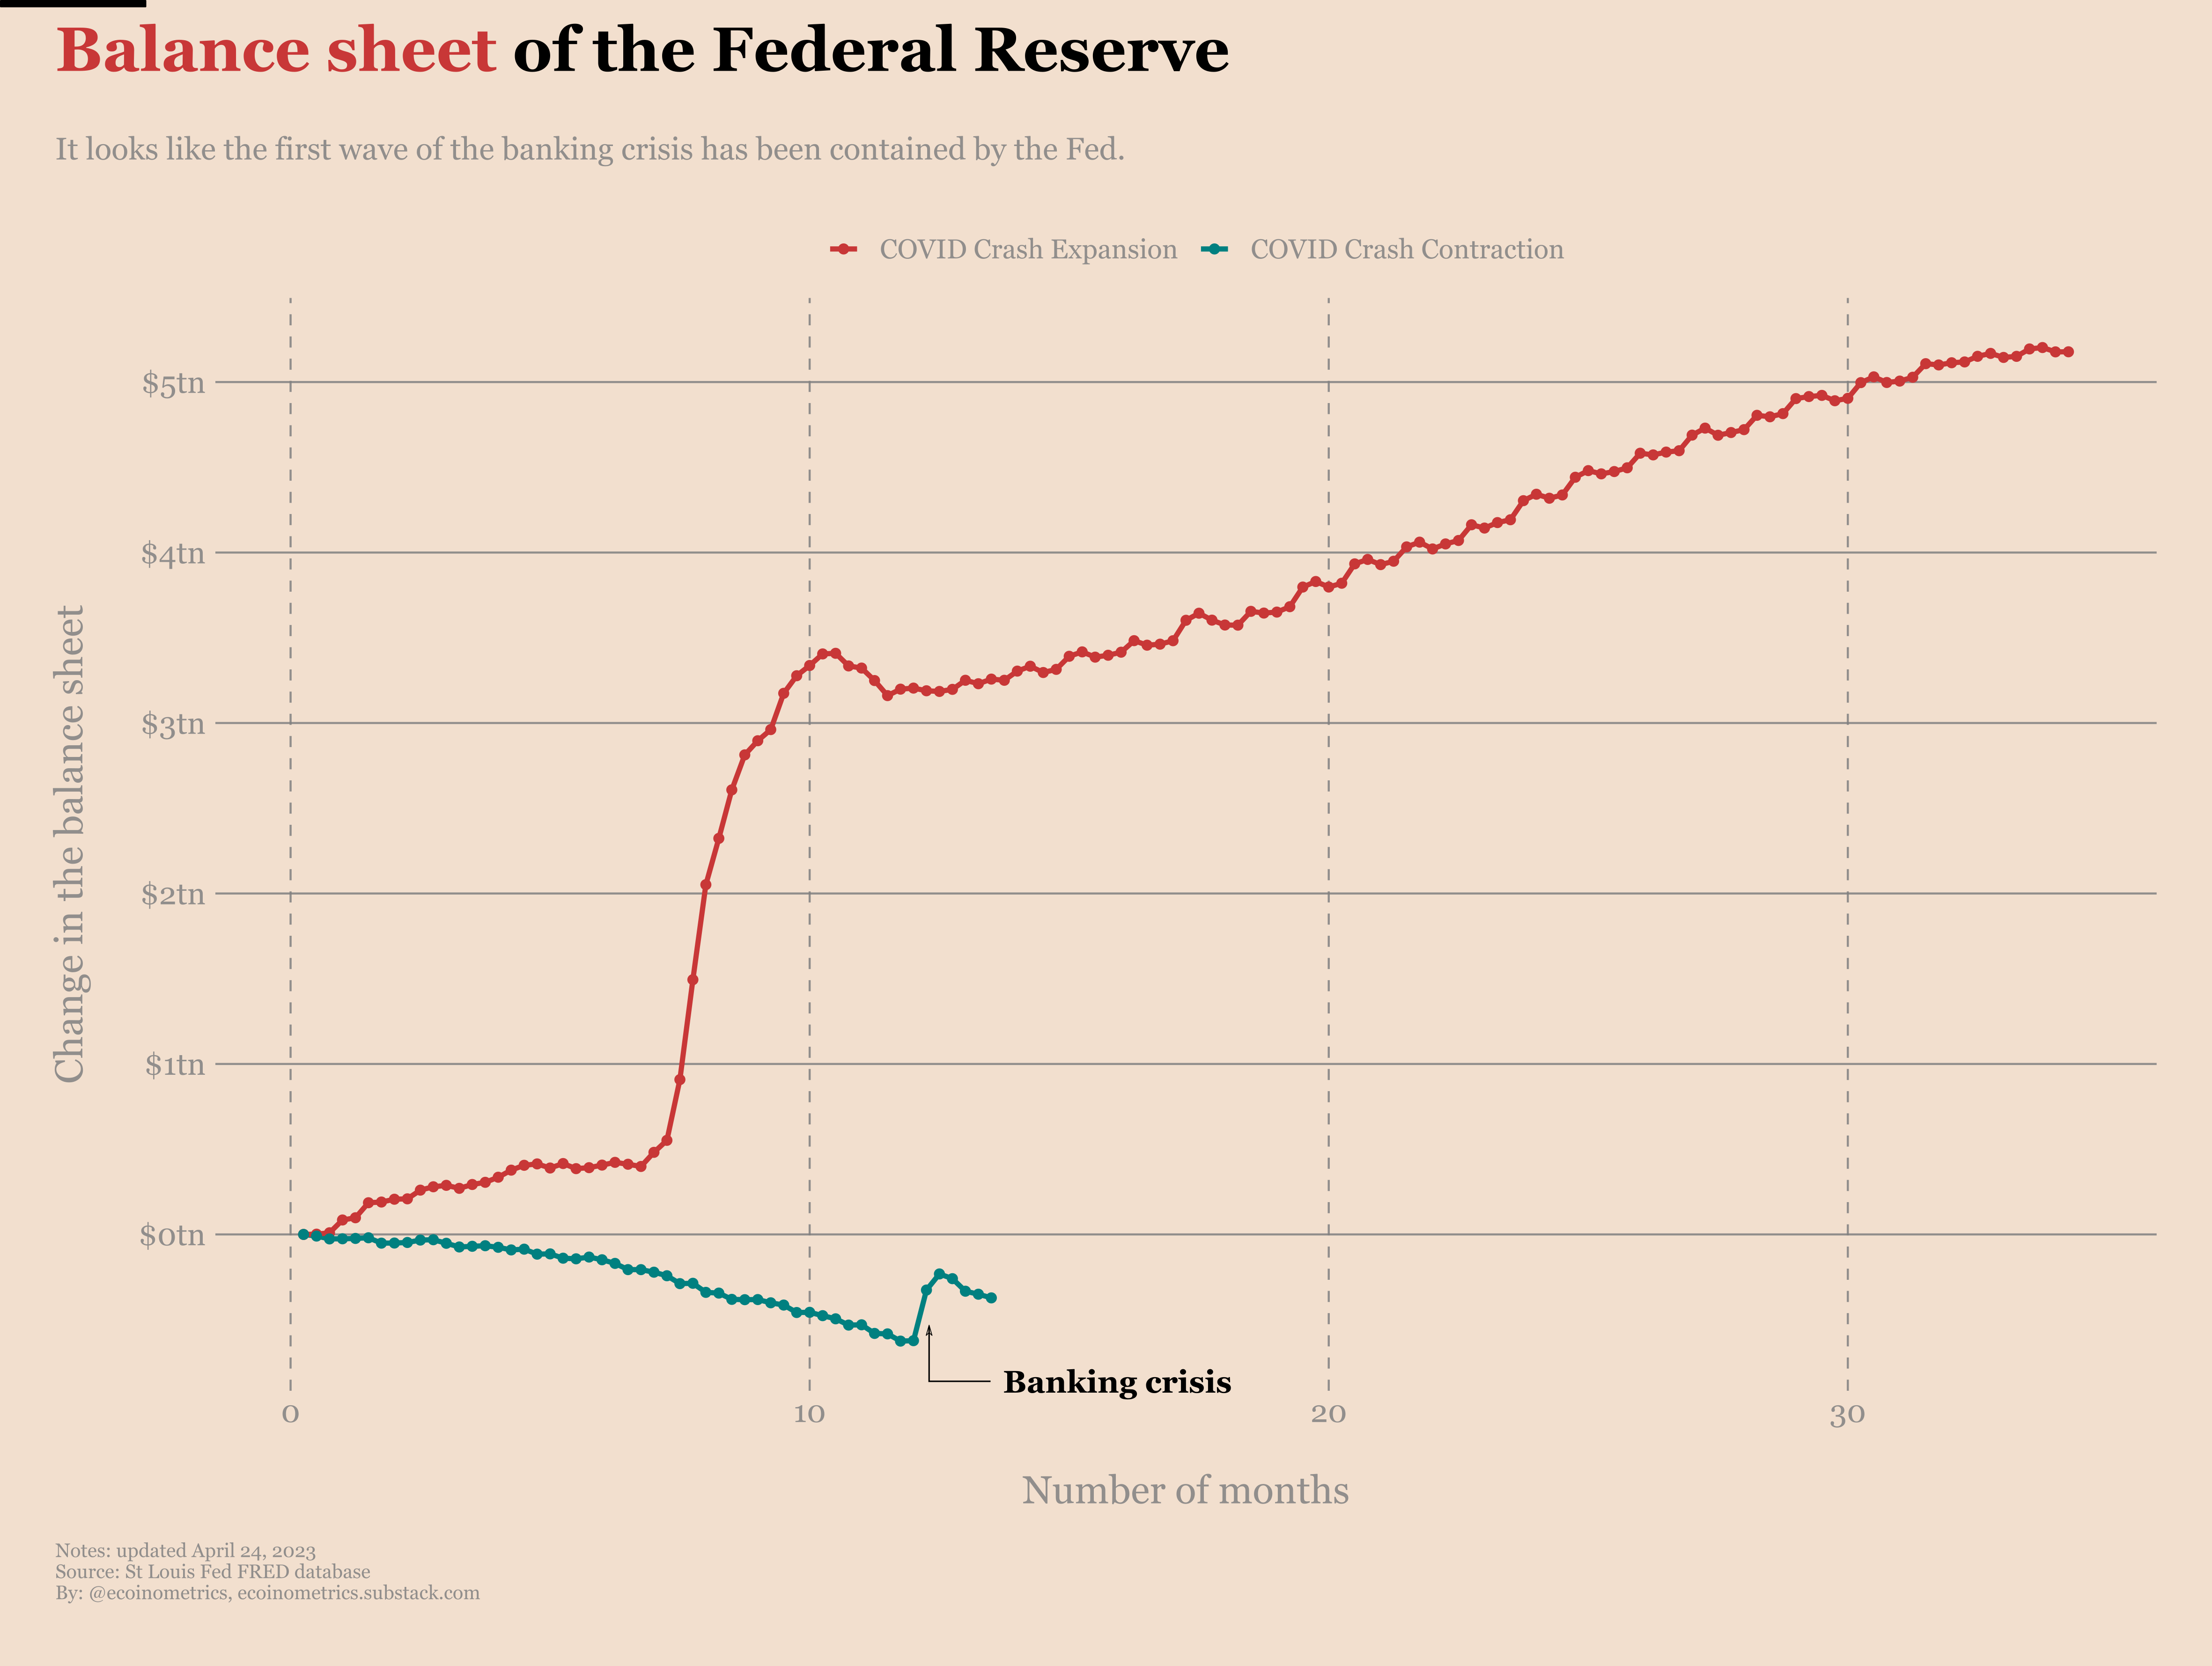
If you remember Balaji’s thesis, due to the rise in interest rates US banks are insolvent. To save them the Federal Reserve will need to print trillions of dollars in a very short amount of time essentially creating a massive debasement of the US dollar. That will lead to hyperinflation and people will flee to Bitcoin as a beacon of hope.
Now I don’t disagree that the debasement of the US dollar will continue to happen and might even accelerate. However I don’t see too many indications that we are heading towards hyperinflation anytime soon.
It is true that banks have been badly hit by the rise in interest rates. But it seems that the Fed has done enough to prevent the risk of too many bank runs and that didn’t cost them that much so far. For the past few weeks the Fed’s balance sheet even restarted its downtrend.
That being said people are now afraid of commercial real estate loans. Real estate runs on high leverage and is thus very sensitive to rate changes. So when you combine:
High interest rates (high cost of refinancing).
Risks of a recession (bad for the occupancy of commercial real estate).
The rise of work from home post COVID (also bad for the occupancy of commercial real estate).
You can understand why people are worried we might see defaults on commercial real estate loans in the coming months.
But would that be enough to make the banking system collapse? Two data points.
US banks are exposed to about $3tn of commercial real estate loans. Not all these loans need to be refinanced this year. And not everyone who has to make payments is going to default at the same time. So while $3tn is a lot of money, only a fraction of that is exposed to defaults which means the Fed would have to print one way or another a low number of trillions of US$ to “stabilize the situation”. They have done that before without creating hyperinflation.

As of the latest data point (Q4 2022) we have not seen a rise in the delinquency rate on commercial real estate loans. We will see if soon whether or not there was a spike in Q1 2023. But at the worst of the 2008 financial crisis delinquency on commercial real estate loans was about 9%. So again yes the Fed will need to inject money in the system if things go south but the scale of it doesn’t seem to justify hyperinflation.

The tl;dr is that regardless of what happens we are heading for more debasement of the US$. But nowhere near the scale that’s probably needed to trigger a bout of hyperinflation.
We’ll continue to monitor the situation.
In case you missed it
Here is a roundup of the topics we covered during last few weeks:
If you aren’t a paid subscriber yet you can check these out, as well as everything else we published, with a free trial.
For fun stuff here are two other articles published on Ecoinometrics.com where we look at what you can eat and drink while safely ignoring inflation.
That’s it for today. If you have any question don’t hesitate to reply to this email and I’ll get back to you.
If you have learned something please like and share to help the newsletter grow.
Don’t forget to checkout other resources on the Ecoinometrics website such as:
A dollar cost averaging performance calculator for the stock market.
Which assets really hold up against inflation over the long run.
If you are already a free subscriber please consider upgrading to a paid tier to get the full access including:
Investment insights on crypto and macro backed by data.
All that delivered to you twice a week, read in less than 5 minutes and completed with data visualizations.
Cheers,
Nick
P.S. For weekly threads and hot takes follow Ecoinometrics on Twitter.