The drawdown continues and this weekend Bitcoin experienced another leg down. So is it time to buy yet?
The Ecoinometrics newsletter decrypts the place of Bitcoin and digital assets in the global financial system. If you want to get an edge in understanding the future of finance you only have to do one thing, click on the subscribe button right below:
Done? Thanks! That’s great! Now let’s dive in.
To buy or not to buy…
… that is the question. Of course I’m referring to the dip.
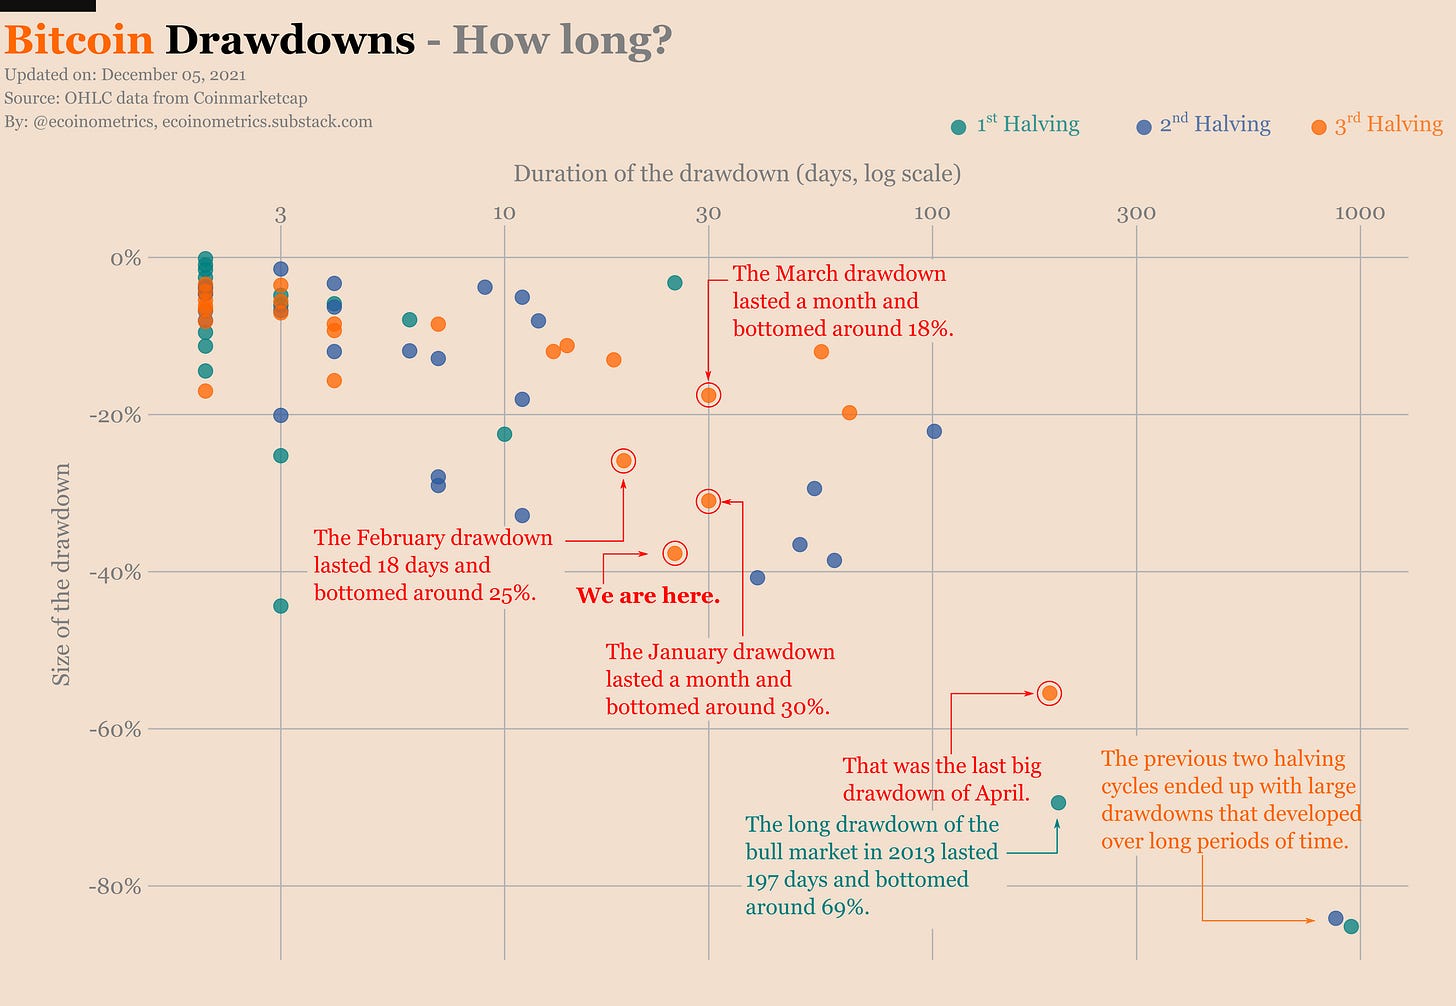
With this new leg down over the weekend, Bitcoin is right at the edge where most of the drawdowns typically stop.
Around the -40% mark we have three drawdowns from the previous cycle and one drawdown from the 1st cycle.
Below that we get the outliers and the bear market drawdowns.
That means if this one is a typical dip then there is no reason to wait before buying more. But if we are going to get another outlier then maybe you want to take it slow.
Now unless there are clear reasons to think that old schemas don’t apply to the current situation I’m always in favour of playing the odds.
In that case that means deploying some dry powder to buy the dip.
If you look at the chart of drawdown trajectories below, you can see that the few corrections in the -40% range tend to be bought pretty fast.
So buying the dips at the edge of the range is a time sensitive matter.
Alright then, if we play the odds then we bet this correction is not an outlier.
That being said, it is always good to consider the alternative just to see if we’ve maybe missed something. So is there any way we can try to sniff out an outlier?
There is no guarantee that all outliers look the same but maybe we can start by comparing the situation for the current drawdown to the most recent outlier we’ve seen.
We don’t have to look very far away in time since that happened earlier this year...
First thing we can say is that in terms of aggregate risk the situation is quite different when compared to April. If we go component by component we can see that:
Then, hodlers had been sitting on relatively high unrealized profits for a while.
Now, hodlers had moderate unrealized profits that vanished pretty fast when the breakout failed.
Then, the market had been on a multi-months parabolic move with a sustained high 200 days multiple.
Now, BTC barely started to rise above its long term moving average without even getting out of the bulk of its distribution.
Then, we were in a situation where very few hodlers groups had been stacking sats for weeks. I.e. the buying pressure had been minimal for a long time.
Now, we are in a situation where few hodlers are stacking sats. But so far that hasn’t lasted very long.
Then, the dip happened with an increase in exchange inflow. I.e. when the correction happened there was already a net positive influx of coins going towards exchange wallets.
Now, the situation is different. So far on a 30 days basis we are seeing historically large exchange outflows.
Alright so what is that telling us? I guess the market is in a different configuration than it was in April.
The only point that’s really concerning is the low participation in the accumulation trend.
If we want to see sustained long term moves we need to see sustained long term buying by hodlers. And in that regard the current trend is choppy.
But still, it is different from April. When we dig into the underlying data of the accumulation trend the difference is striking.
Take a look at the hodlings of the different groups in April/May vs now...
In April/May the accumulation trend risk was in the red because most of the address groups had been distributing coins for a while.
Right now the accumulation trend risk is high but it is because most of the address groups have been doing some sideways action.
From that we cannot conclude that this drawdown is not an outlier. But if it is one, it is a different beast than what we have seen before.
Now there are external risks that are harder to quantify:
You’ve heard the music coming out of the Fed. They are worried about inflation. We are getting tapering and the simple fact that they are talking about it is making the stock market jittery. This is bound to have some effect on all risk assets.
Stating the obvious, the price of Bitcoin is not decided on-chain. It is decided on the exchanges. And the short term dynamic of price formation on the exchanges is heavily influenced by the derivatives. So regardless of the fundamentals, the price can be greatly affected by the activity of the futures and the options market before a new trend becomes clear.
Those two kinds of risks are something we are going to spend more time doing research on in future issues of the newsletter. As Bitcoin becomes less volatile and more connected to the global financial system external factors will play an increasingly important role in understanding the state of the market.
Price prediction poll
A word of caution, last week’s poll was taken before the big drop so the mood could have changed.
That being said, the median prediction for Bitcoin’s price at the end of the year is $80,000. This number hasn’t changed much despite the big gap between the realized price and the predictions over the last month…
The same is true for Ethereum with an end of year median prediction at $5,750.
So at least for the people who are taking time to fill out this survey regularly, it feels like the sentiment is that Bitcoin and Ethereum are considerably undervalued.
We will soon have three months worth of data points from this poll. When we get there we’ll take a first look at how price predictions correlate with the recent price action.
But until then that would be great if more people gave their predictions. On average we get something of the order of 100 responses per week. The more submissions the more meaningful the analysis so I’m sure we can do better than that.
You can go ahead and let me know what are your predictions for January 2022 at the link below:
Inflation narrative
Something we need to watch is the narrative around inflation. Two important dates:
December 10 is the next US inflation data release.
December 14 is the next Federal Reserve policy meeting.
How they will talk about the data and whether or not they decide to modify the schedule of the taper is bound to affect all risk assets.
We have already seen two consequences since last week:
The stock market is jittery.
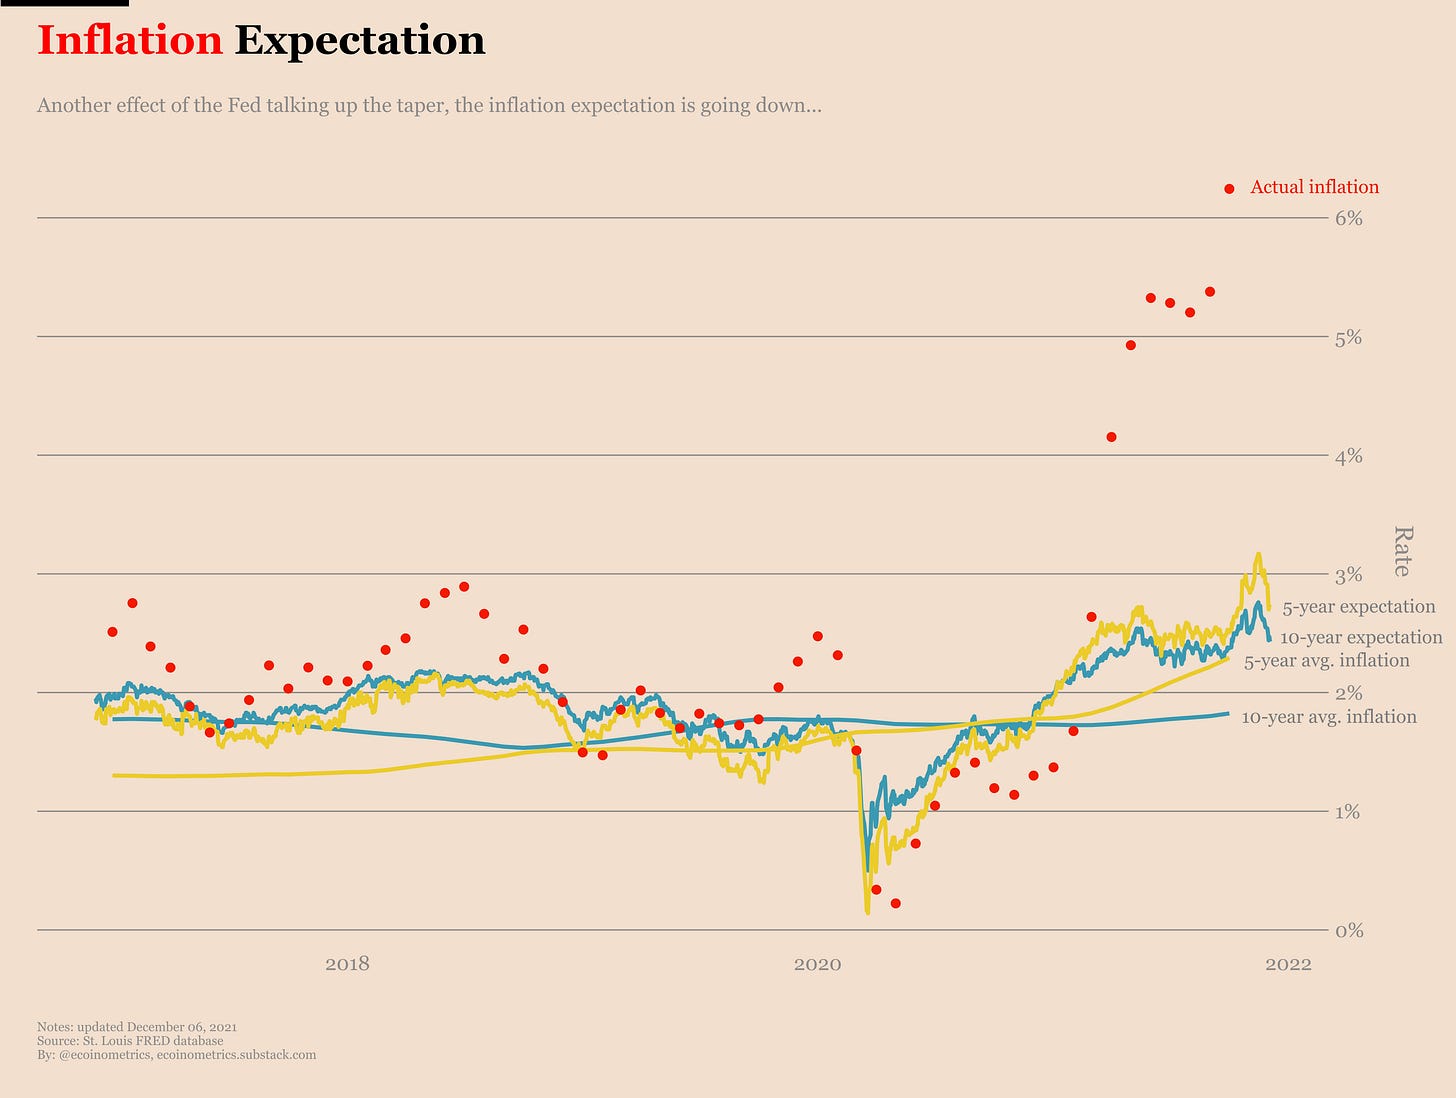
The inflation expectation in the bond market is already dropping.
We’ll see how far jawboning by the Fed can go. But at the end of the day the conundrum isn’t going anywhere:
Tapering / raising rates will crash the stock market.
Printing money like there is no tomorrow will feed inflation.
Pick your poison.
Last call
Final point, let me remind you that starting this week the newsletter is going private. If you want to continue getting full access to all the posts and don’t miss anything now is the time to upgrade.
For $15/month or $150/year (less than the average gas cost of minting an NFT on Ethereum) paid subscribers get 8 issues every month, can suggest research topics and ask for charts.
Free subscribers will get a couple of public posts every month.
If you have any questions just shoot me an email (nick.ecoinometrics@gmail.com).
That’s it for today. If you have learned something please subscribe and share to help the newsletter grow.
If you are already a free subscriber please consider upgrading to a paid tier to get the full access.
Cheers,
Nick


I love the charts! Can I volunteer to work with you and learn data analysis and charts?
always love the charts!! our hope lies in ₿… get cheap sats while you can!