When it comes to investing, different people have different time horizons.
If you have a long investment horizon you are probably just waiting for Bitcoin to go as far as possible on the adoption curve. In that case the strategy is simple: accumulate and hodl until your macro thesis plays out.
If you have a short term investment horizon then maybe you are day trading the news or you have some strategies based on TA.
But what if you are in the middle? What if you don’t want to get glued to the charts all day long but also don’t want to wait 8 more years before cashing out?
Well maybe you just want to trade momentum then.
The Ecoinometrics newsletter decrypts Bitcoin’s place in the global financial system. If you want to get an edge in understanding the future of finance you only have to do two things:
Click on the subscribe button right below.
Done? That’s great! Now let’s dive in.
Trading momentum
Bitcoin is one of those assets that has long phases of parabolic moves on a regular basis.
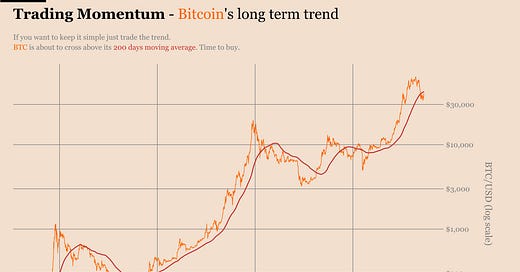
One way of characterizing this is to look at BTC versus its long term trend.
Check it out.
What you see is that Bitcoin is rising very fast ahead of its 200 days moving average. Then continues on its upward trend for a while. Finally it is crashing back down to the 200 DMA that has now moved to a much higher price level.
Well if you believe that this kind of pattern is going to repeat in the future there is a minimalist trading strategy that can help you capture most of the upside.
Here we go:
Buy when the daily close is crossing above the 200 days moving average.
Liquidate the position when the daily close falls back down below the 200 DMA.
That’s it.
For this strategy you basically only need to check the price once a day and you are set. Hard to make anything simpler than that outside of just hodling.
And what do you get from applying those rules:
Small losses or small wins when you get a false breakout.
Massive gains when you catch on the big trends.
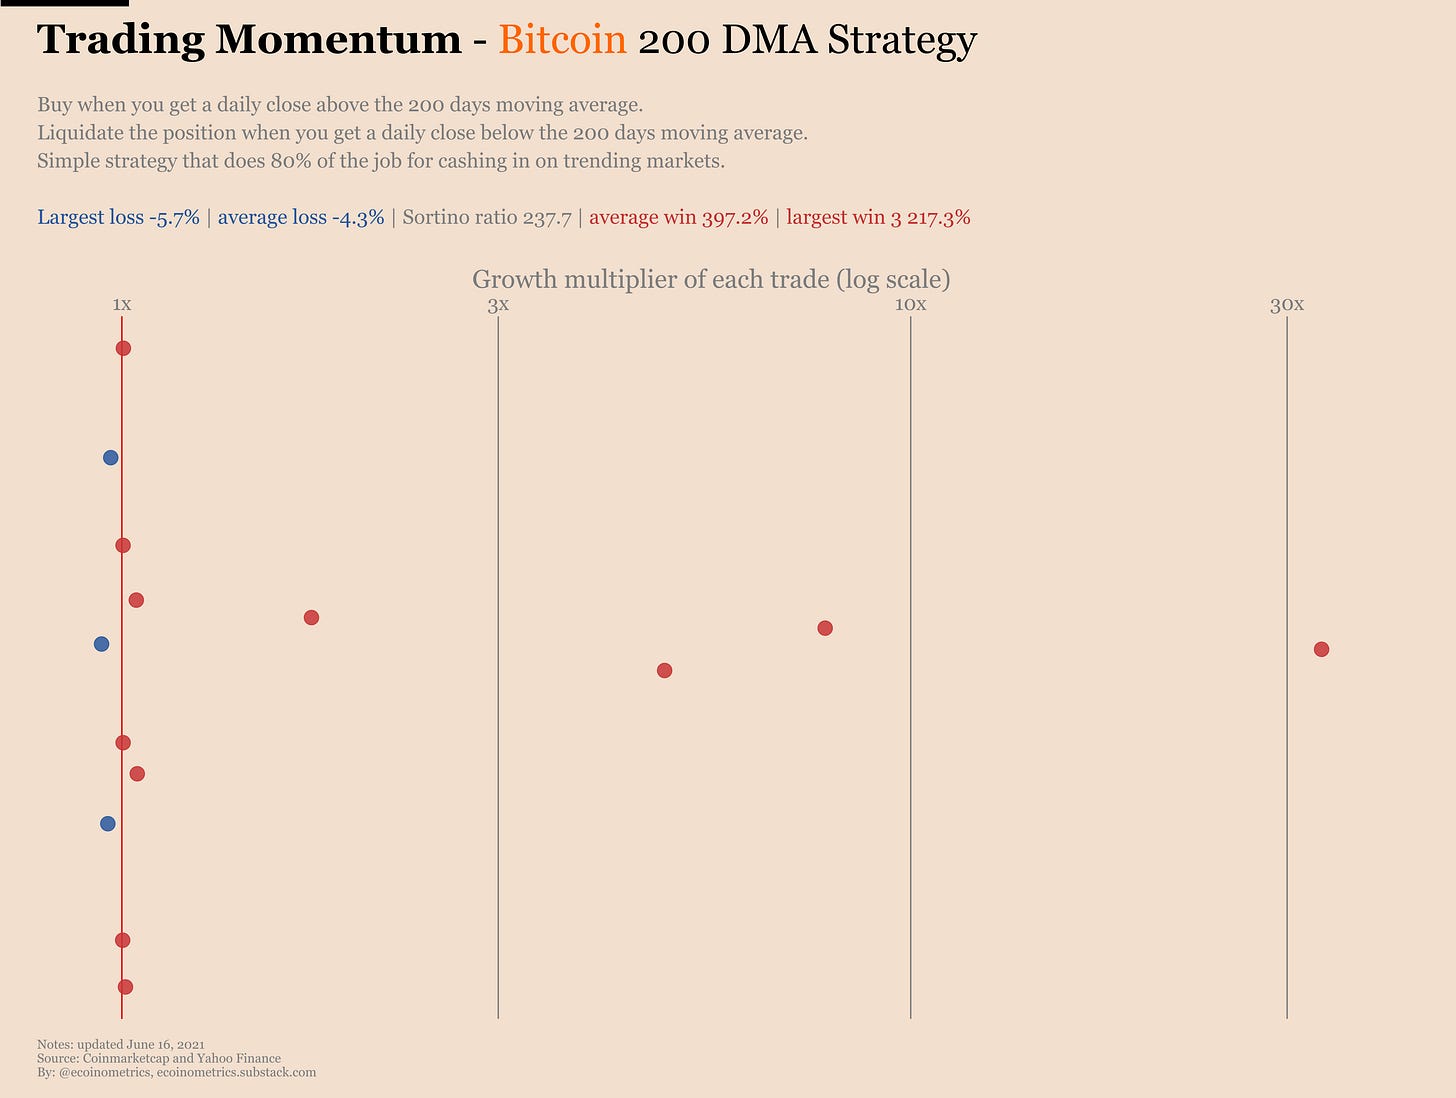
That’s the whole point of this strategy. Most of the time you don’t get anything out of it. But when a big wave shows up you generate enough profits from it to make it worth your time.
What you get out of this are asymmetric returns. It’s all in the right tail.
Take a look below.
Each point is a trade and its position on the horizontal axis indicates the return. Breakeven is at the 1x multiplier. Losing trades are in blue. Winning trades are in red.
The most recent trade that started after the crash of March 2020 returned 388%… not too bad.
Now obviously this is a well known strategy. But the beauty of it is that it works well on any market that exhibits strong trends.
Do you want more data point? Do you want an example outside of crypto?
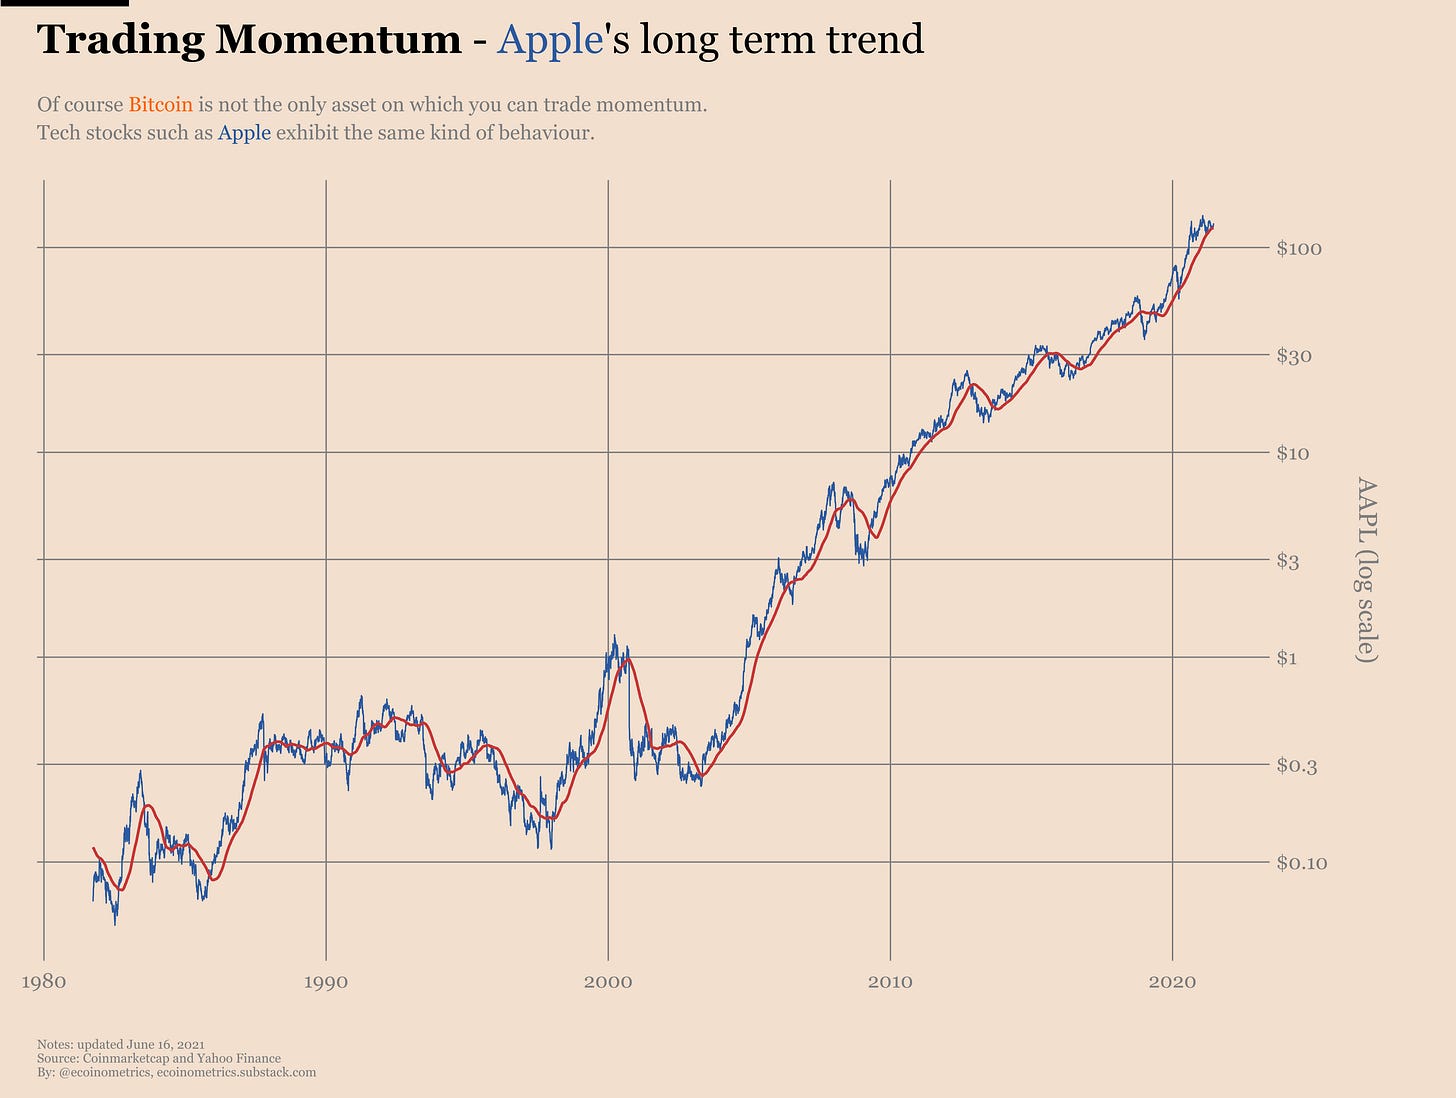
Alright… pick any of the big tech stocks. Say Apple.
Let’s do a quick check by comparing AAPL to its 200 days moving average.
With a quick look at it you can probably tell that this should work well enough.
So let’s apply the same rules and check out the result:
Most trades give you small losses or small wins.
But you do get to ride the big waves from which you’ll make all your profits.
So this works for Bitcoin and also for Apple. What about gold?
Gold is doing nothing most of the time. But on occasions there are those big waves that are driven by changes in the real yield or by inflation scares.
That means you can probably make it work there too.
No big surprise when you apply the same rules to a market that exhibits similar behaviours you end up with the same results:
Most of the trades give you small losses and small wins.
But you do ride the big moves.
Obviously those three markets have different kinds of returns due to their different levels of volatility. But as long as you are aware of that and size your positions accordingly then you are all good.
Apply this strategy to enough markets that exhibit a tendency to strong trends (crypto, growth stocks, commodities) and you’ll get something pretty close to what momentum-based hedged funds do.
Or just use this to trade only Bitcoin with a mid-term investment horizon.
That’s up to you.
I’m not here to sell you a trading strategy. What I want to point out is that you don’t need overcomplicated rules to benefit from trending markets.
Is this simple 200 days moving average strategy giving you the best backtested results? Probably not.
Could you make more money by closing your position when you think we are at the top? Maybe.
But in my experience keeping it simple and consistent will make your life easier and get you 80% of the results for 20% of the effort.
Bitcoin is pretty close to crossing above its 200 DMA again. So why not give it a try?
CME Bitcoin Derivatives
Nothing new this week in the CME Bitcoin markets. The volume looks low and the open interest is basically flat.
With BTC trading in this low range everybody is falling asleep at the wheel.
The Commitment of Traders data is showing that the retail crowd is done with getting out of their long positions. But they aren’t buying the dip either.
The smart money isn’t changing anything to their positioning. They are probably waiting for better times to add to the basis trade.
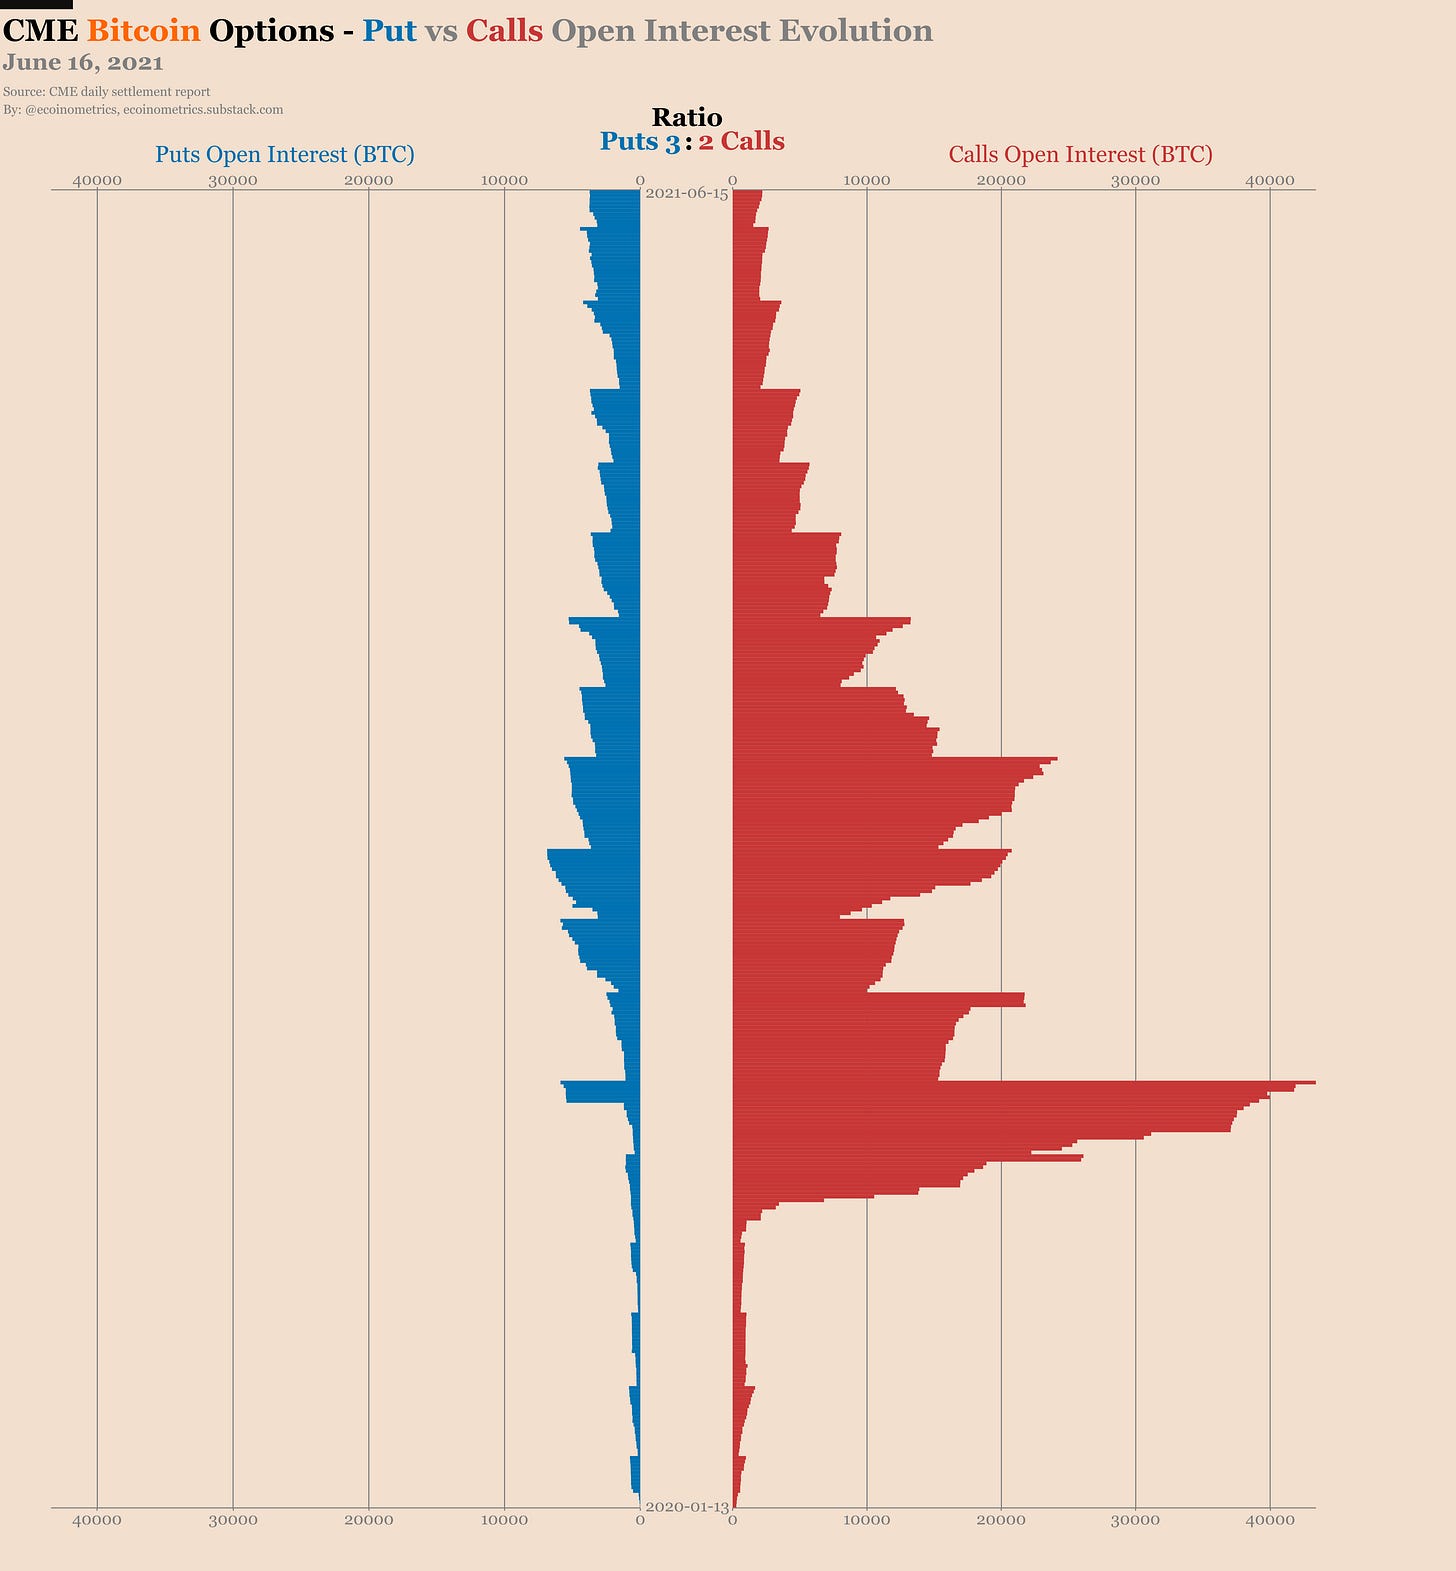
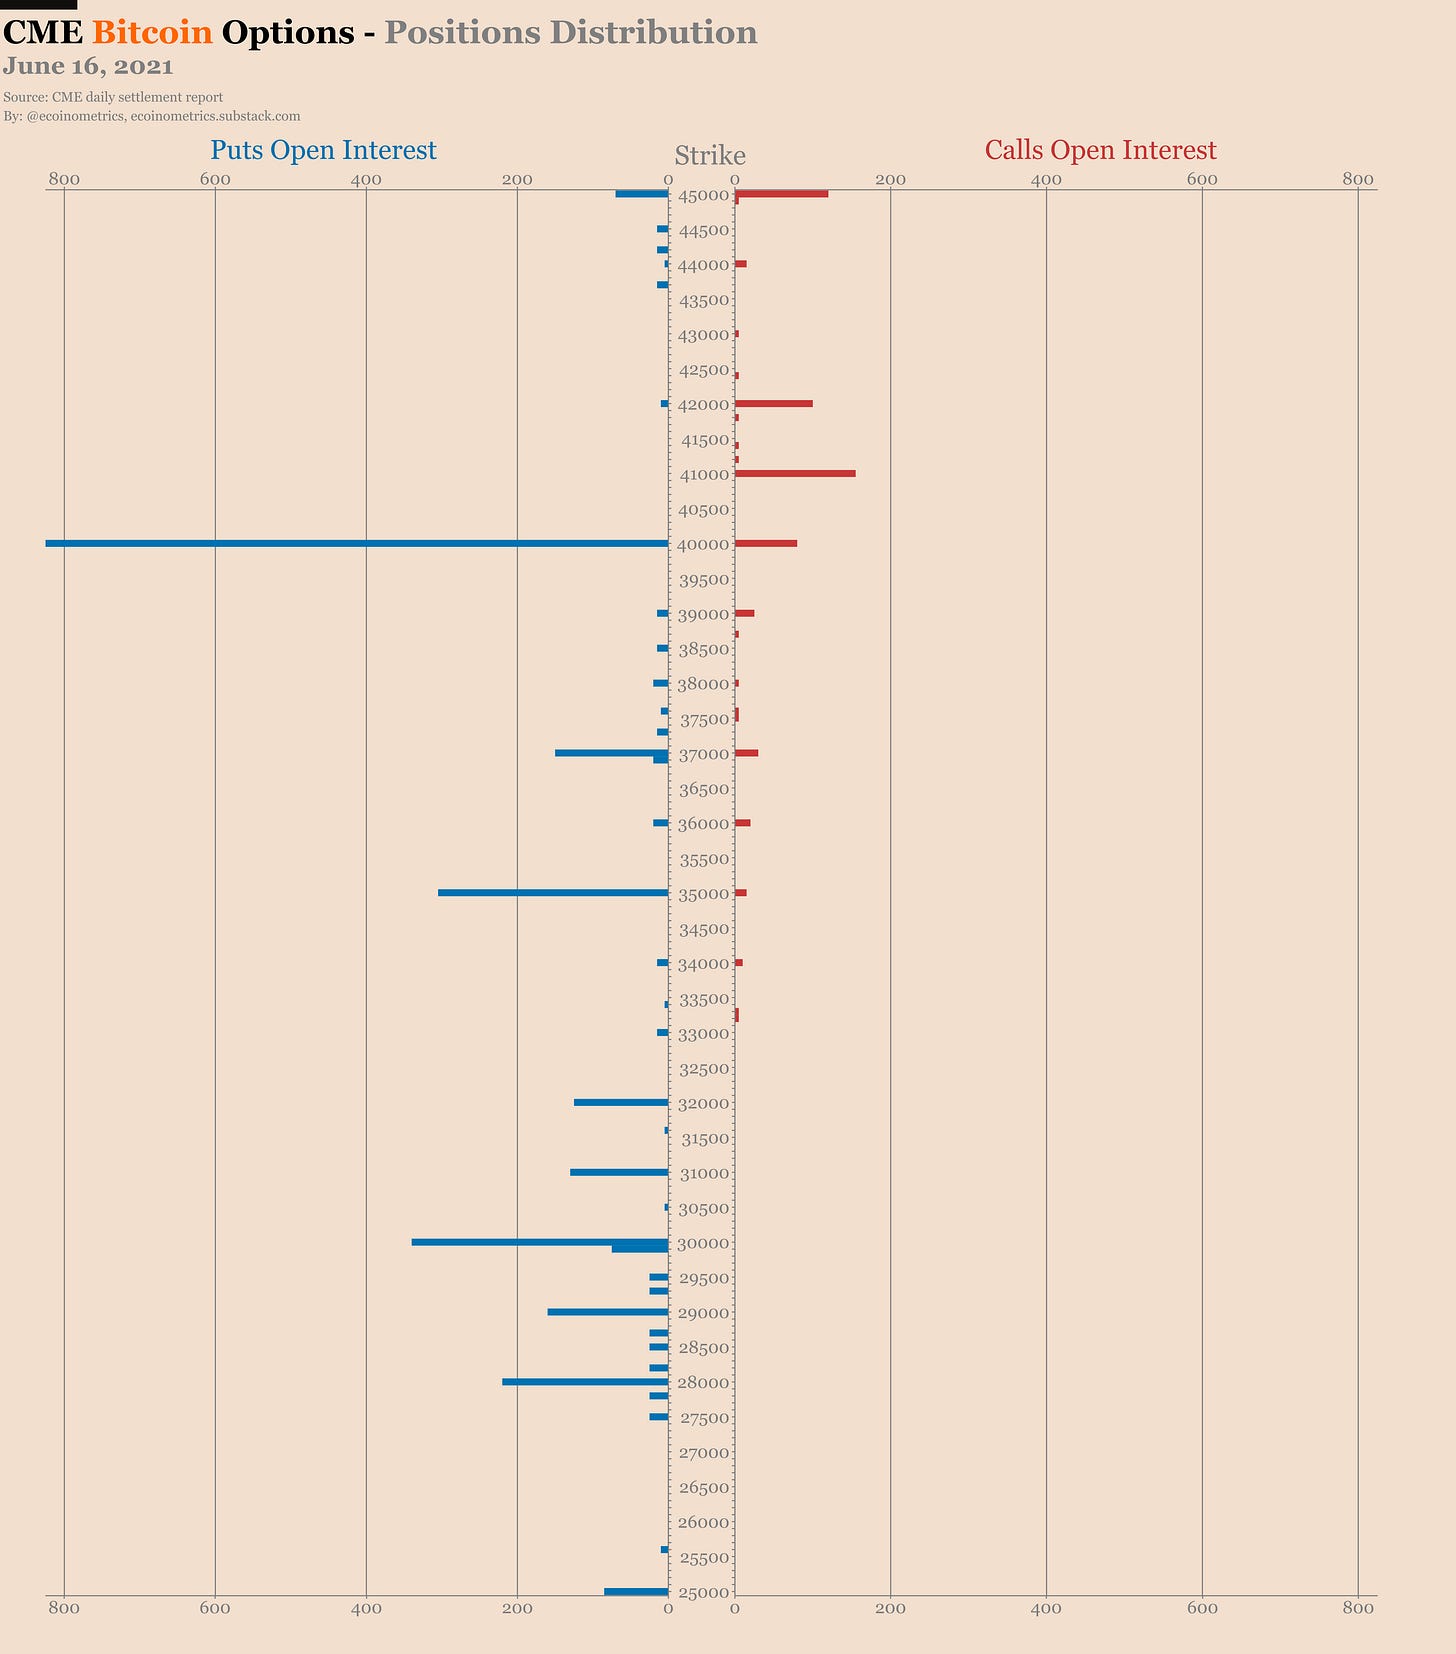
On the options market the puts still dominate the landscape with 3 puts for every 2 calls.
The $40k strike is the big level followed by the zone all around $30k.
That’s basically the same as it was last week.
So the sentiment hasn’t turned bullish yet, but at least it isn’t getting worse.
Let’s see how that plays out.
That’s it for today. If you have learned something please subscribe and share to help the newsletter grow.
Cheers,
Nick





another great post!!