Ecoinometrics - Where are we in the inflation cycle?
The next inflation print is due this week. Are we past the peak? Or is it going to be another bad surprise?
The next inflation print is due this week. Are we past the peak? Or is it going to be another bad surprise?
The Ecoinometrics newsletter helps you understand Bitcoin and digital assets through the macro quantitative lens. Subscribe to get an edge on the future of finance.
Done? Thanks! That’s great! Now let’s dive in.
Where are we in the inflation cycle?
July 13, 2022. Mark the date. This is the next US inflation data release. Where it will land is going to set the tone.
A new high would be disastrous as the market isn’t positioned for that.
A small decline would be good. But that’s would only be the first data point on the way to make an “economic” trend. It will still be a quarter before the Fed calls it a reversal.
A big decline would be ideal. That would release the pressure on the Fed to do more with QT. And that would give them some excuses to try to focus on not completely screwing up the entry in the next recession.
Now, what does qualify as a big or a small move?
There are two ways to look at this question. First you can look at this as an investor psychology problem.
Define big moves as those moves that are expected to drive investors to react and small moves as those who aren’t going to trigger any noticeable market reaction. Then you can try to look at the history of stock market moves at the time of the data release and try to classify month on month inflation changes based on that.
Maybe you’ll get some consistent bias in this data. Maybe not.
From the time I put in analyzing the oil market at for the weekly inventory data release I’m inclined to think that there isn’t much information to gain from this line of thought. How many times have I seen big inventory draws leading to a price collapse or large inventory builds leading to a price surge… I’ve stopped counting…
The point is, the data alone isn’t enough. You need to look at it in context.
So no, instead let us be a bit more “scientific” about this classification.
Take the history of month on month changes in the inflation rate since 1947. Take all these data points and add them to the inflation rate for May 2022. That gives you the full range of expected inflation rate for June 2022 as per historical records. This is the distribution you can see below.
Check it out for a minute.
As you can see the range of expected inflation is pretty wide. On some occasions there have been month on month drops in inflation of as much as 2%. Same thing in the other direction.
But by and large the bulk of the distribution of historical moves predicts that we should see a June inflation print between 8% and 9%.
Ok, let’s make this chart easier to read.
This is a bit arbitrary but let’s say that any inflation print between the median inflation surge and the median inflation drop compared to the previous month is the normal range.
Then anything above the median inflation surge would be a bad surprise. For June that would correspond to an inflation rate rising above 8.76%. Anything below the median inflation drop would be a good surprise. For June that would be an inflation rate falling below 8.32%.
See for yourself.
An excellent surprise would be an outsized drop, close to the 95th percentile which sits at 7.64%. Honestly I don’t think we are getting that this month. We aren’t in the acute phase of the recession yet so there is no reason to expect outliers.
With this kind of data there is an interesting back of the envelope calculation you can make. The median inflation drop is -0.2%. Said differently if starting this month we were to get a median inflation drop every month for 10 months it would only lower the inflation rate by -2%… which means that to reach the 2% target set by the Federal Reserve you would need 31 consecutive months of median inflation drop.
That’s how far up we are right now.
And 31 months is a long time when you are the chairman of the Federal Reserve. Which is why Jay Powell is probably secretly praying for an acute recession as soon as possible.
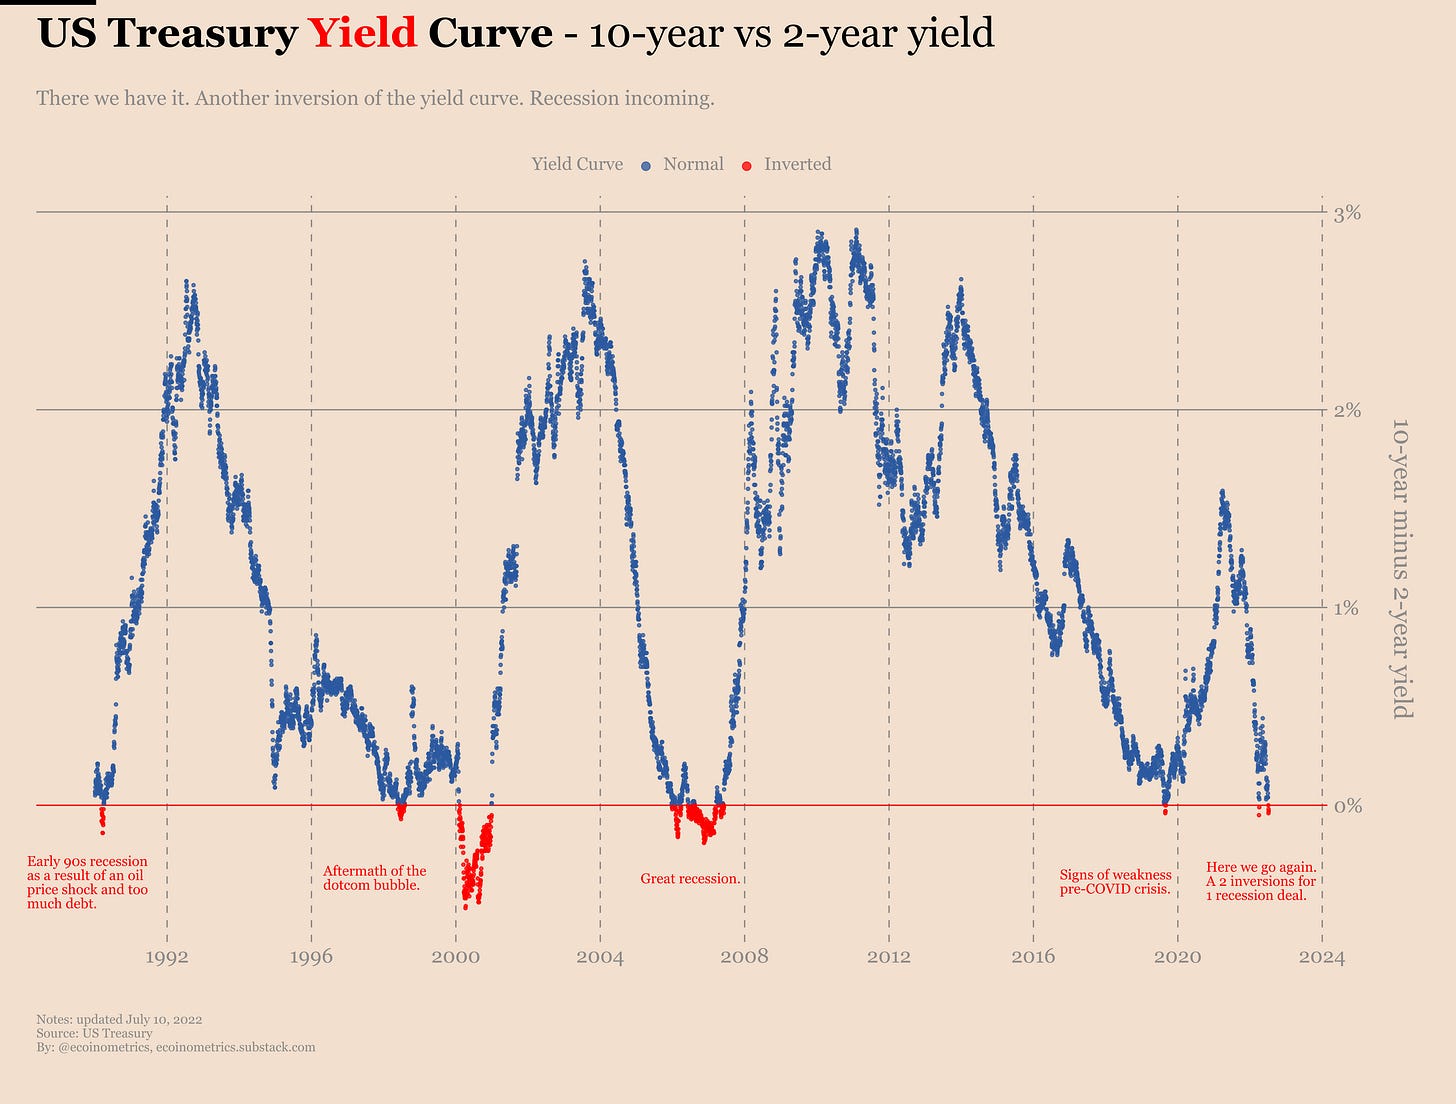
How soon will he get it? Well, last week the yield curve inverted. Again. That’s a sign the bond is expecting a recession in the coming months. Again.
So technically speaking chances are we are already in a recession. It will just take some time for all the economic indicators, which are typically lagging, to show that clearly.
My guess is that inflation still has a little bit of momentum left. I say that mostly because of the oil market.
Crude oil is a big driver of inflation.
Take a look at the chart below. Each point represent the oil price on a given month. Those points are colour coded based on the inflation at the time. Blue is low inflation. Red is high inflation. The grey bands represent periods of official recessions in the US.
Typically it goes like that:
For reason X oil becomes more expensive.
This has a tailwind effect on inflation.
Until things become too expensive and / or the economy collapses.
This creates demand destruction which has a headwind effect on oil prices.
With lower oil prices inflation is brought down.
If you stare at this chart long enough, you can see the rate of change of crude oil prices over the last 12 months definitely falls in the range that might trigger demand destruction.
Not alone of course. The Federal Reserve is also helping with QT. But still. You can imagine that we are already in one of those grey areas but we haven’t realized it yet. All we are waiting for is some official sign of demand destruction. Then investors will start dumping crude oil.
Now it is true that this doesn’t change the extremely tight supply situation faced by the energy sector. So maybe we aren’t going to see a total collapse of oil prices. But we don’t need one to see a significant effect on inflation.
Remember, inflation is a rate of change. So to see inflation come down you only need prices to stop rising.
From June 2020 to June 2021 crude oil is up about $33 per barrel.
From June 2021 to June 2022 crude oil is up about $38 per barrel.
That’s why I think a very large drop in inflation is unlikely this month.
But looking at the chart below, you “only” need to see crude oil fall back to $75 per barrel to negate its direct effect on inflation moving forward. Crude oil is volatile enough that you can’t exclude this will happen at the first sign of real trouble with demand.
Now what does that scenario mean for risk assets?
The Federal Reserve is going to push QT until they get to this acute recession phase. That’s the phase that starts to be damaging to the jobs market. At this point you’d expect inflation starts to ease, so rescuing the job market becomes the new priority. And that priority entails at least stopping QT, at most restarting QE depending on the severity of the situation.
You can’t trust the Fed when they are talking about their “unconditional” focus on getting inflation back at 2%. They are just saying the words the politicians want to hear.
In a recession scenario jobs will become the new priority and their “unconditional” resolve will go out the window.
My guess is something like that plays out over the next 12 months.
When we officially get in a recession some people will panic sell. It’s always like that. So there is likely to be another occasion to buy things at a discount.
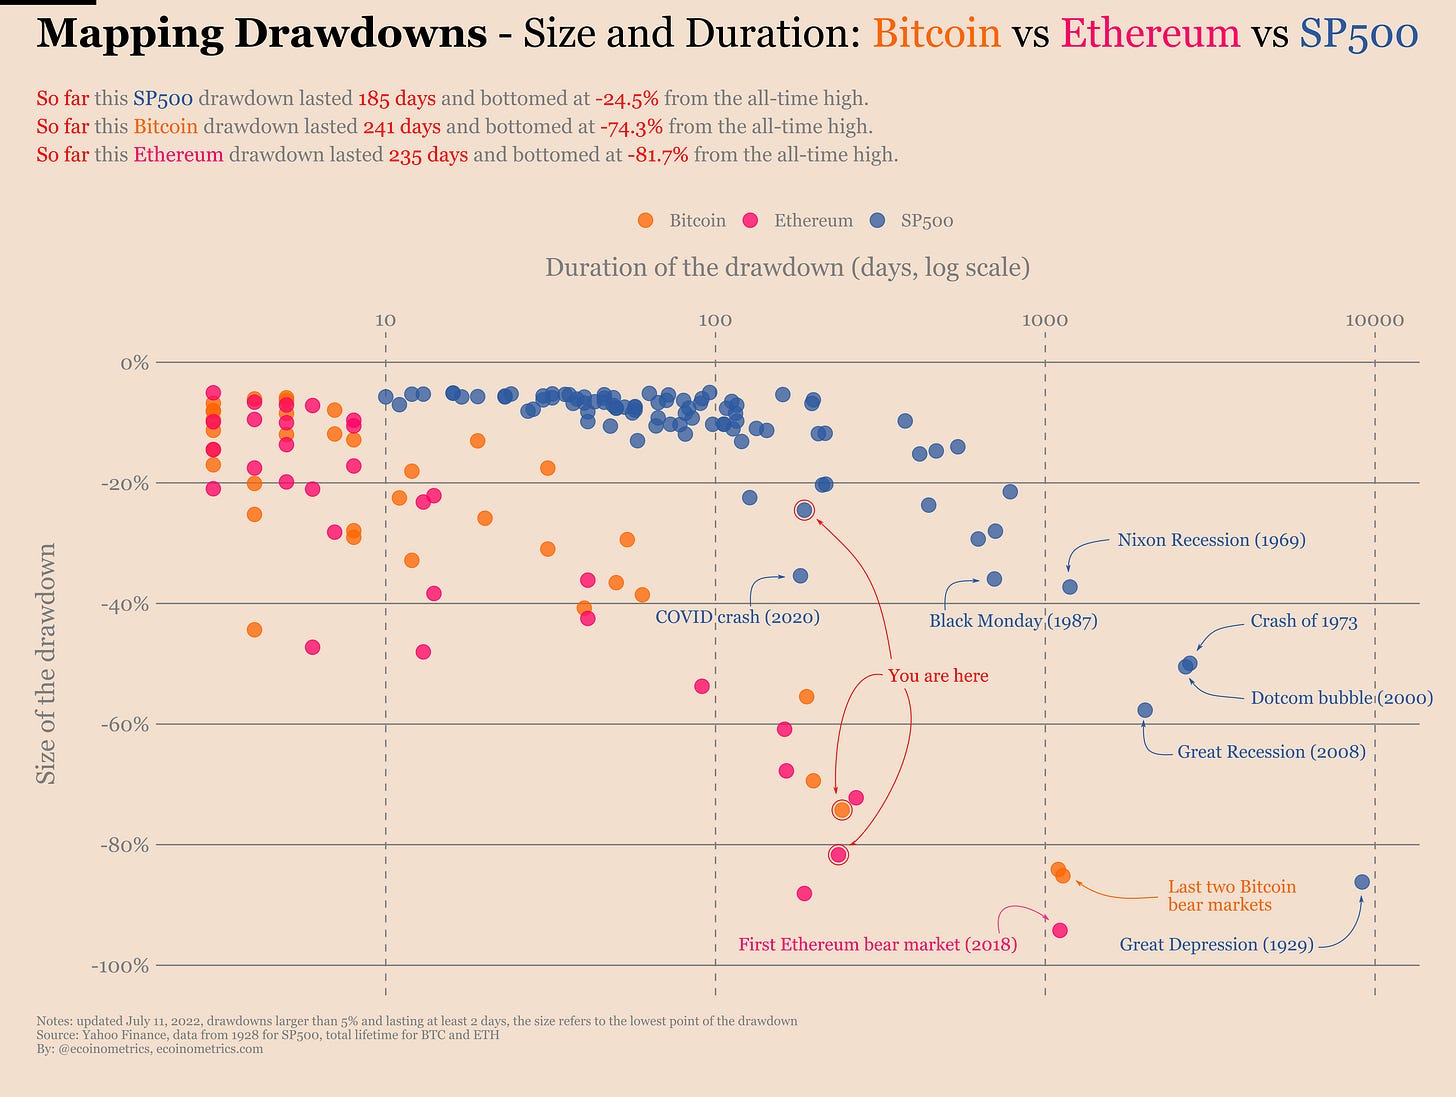
Bitcoin itself is following a drawdown trajectory that isn’t very far from the previous two cycles. A -85% drop from its all time high would imply that you can get your hands on some BTC at $10k… Why not… But just in case this day never comes your best bet is to start dollar cost averaging this drawdown if you haven’t already. At least do that to cover your basis.
The other thing you should do is look for great deals while there is blood on the streets.
What’s a great deal? This is something we have started to explore in the past few weeks.
We are putting together a framework for thinking of investment ideas as bets. The goal is to uncover asymmetric bets, that is investment whose expected upside is much greater than the downside risk.
So far we have covered:
How to analyze Bitcoin with realistic expectation at 5 years using this framework.
And this week we’ll discuss how to think about risk and correlations for this type of portfolio.
Go check those out if you haven’t already.
The likelihood of getting one of those asymmetric deals during a bear market is much greater than at any other point in time. It is now or never to adopt an offensive mindset.
That’s it for today. If you have learned something please like and share to help the newsletter grow.
If you are already a free subscriber please consider upgrading to a paid tier to get the full access including:
Two newsletters every week.
Suggest research topics and request charts.
Cheers,
Nick


