


Loose Financial Conditions Are Fuelling Bitcoin’s Rally
Also Bitcoin Moves with the Flows & The Yield Curve Twists

Welcome to Ecoinometrics' Friday edition.
Each week, we analyze the three most critical market signals impacting Bitcoin and macro assets, delivering institutional-grade insights through data-driven charts and analysis.
Today we'll cover:
Loose Financial Conditions Are Fuelling Bitcoin’s Rally
Bitcoin Moves with the Flows
The Yield Curve Twists and Bitcoin’s Thesis Strengthens
What ties these signals together is simple: liquidity. Whether it’s financial conditions easing, ETF flows accelerating, or the bond market flashing warnings about fiscal credibility, each chart points to how capital is moving and what that means for Bitcoin. Understanding those flows is what gives you an edge.
In case you missed it, here are the other topics we covered this week:


Essential Decision-Making Tools
Bitcoin Market Monitor - Key Drivers in Five Charts:

Bitcoin Market Forecast - Probability Scenarios & Risk Metrics:

Get these professional-grade insights delivered to your inbox:
Loose Financial Conditions Are Fuelling Bitcoin’s Rally
Bitcoin hit a new all-time high this week. And there are solid reasons for that. This isn’t just a rally driven by leverage or derivatives activity.
It’s supported by the macro environment. And it’s supported by real demand for spot Bitcoin.
Focusing on the macro: what stands out is how quickly things reversed in just three months.
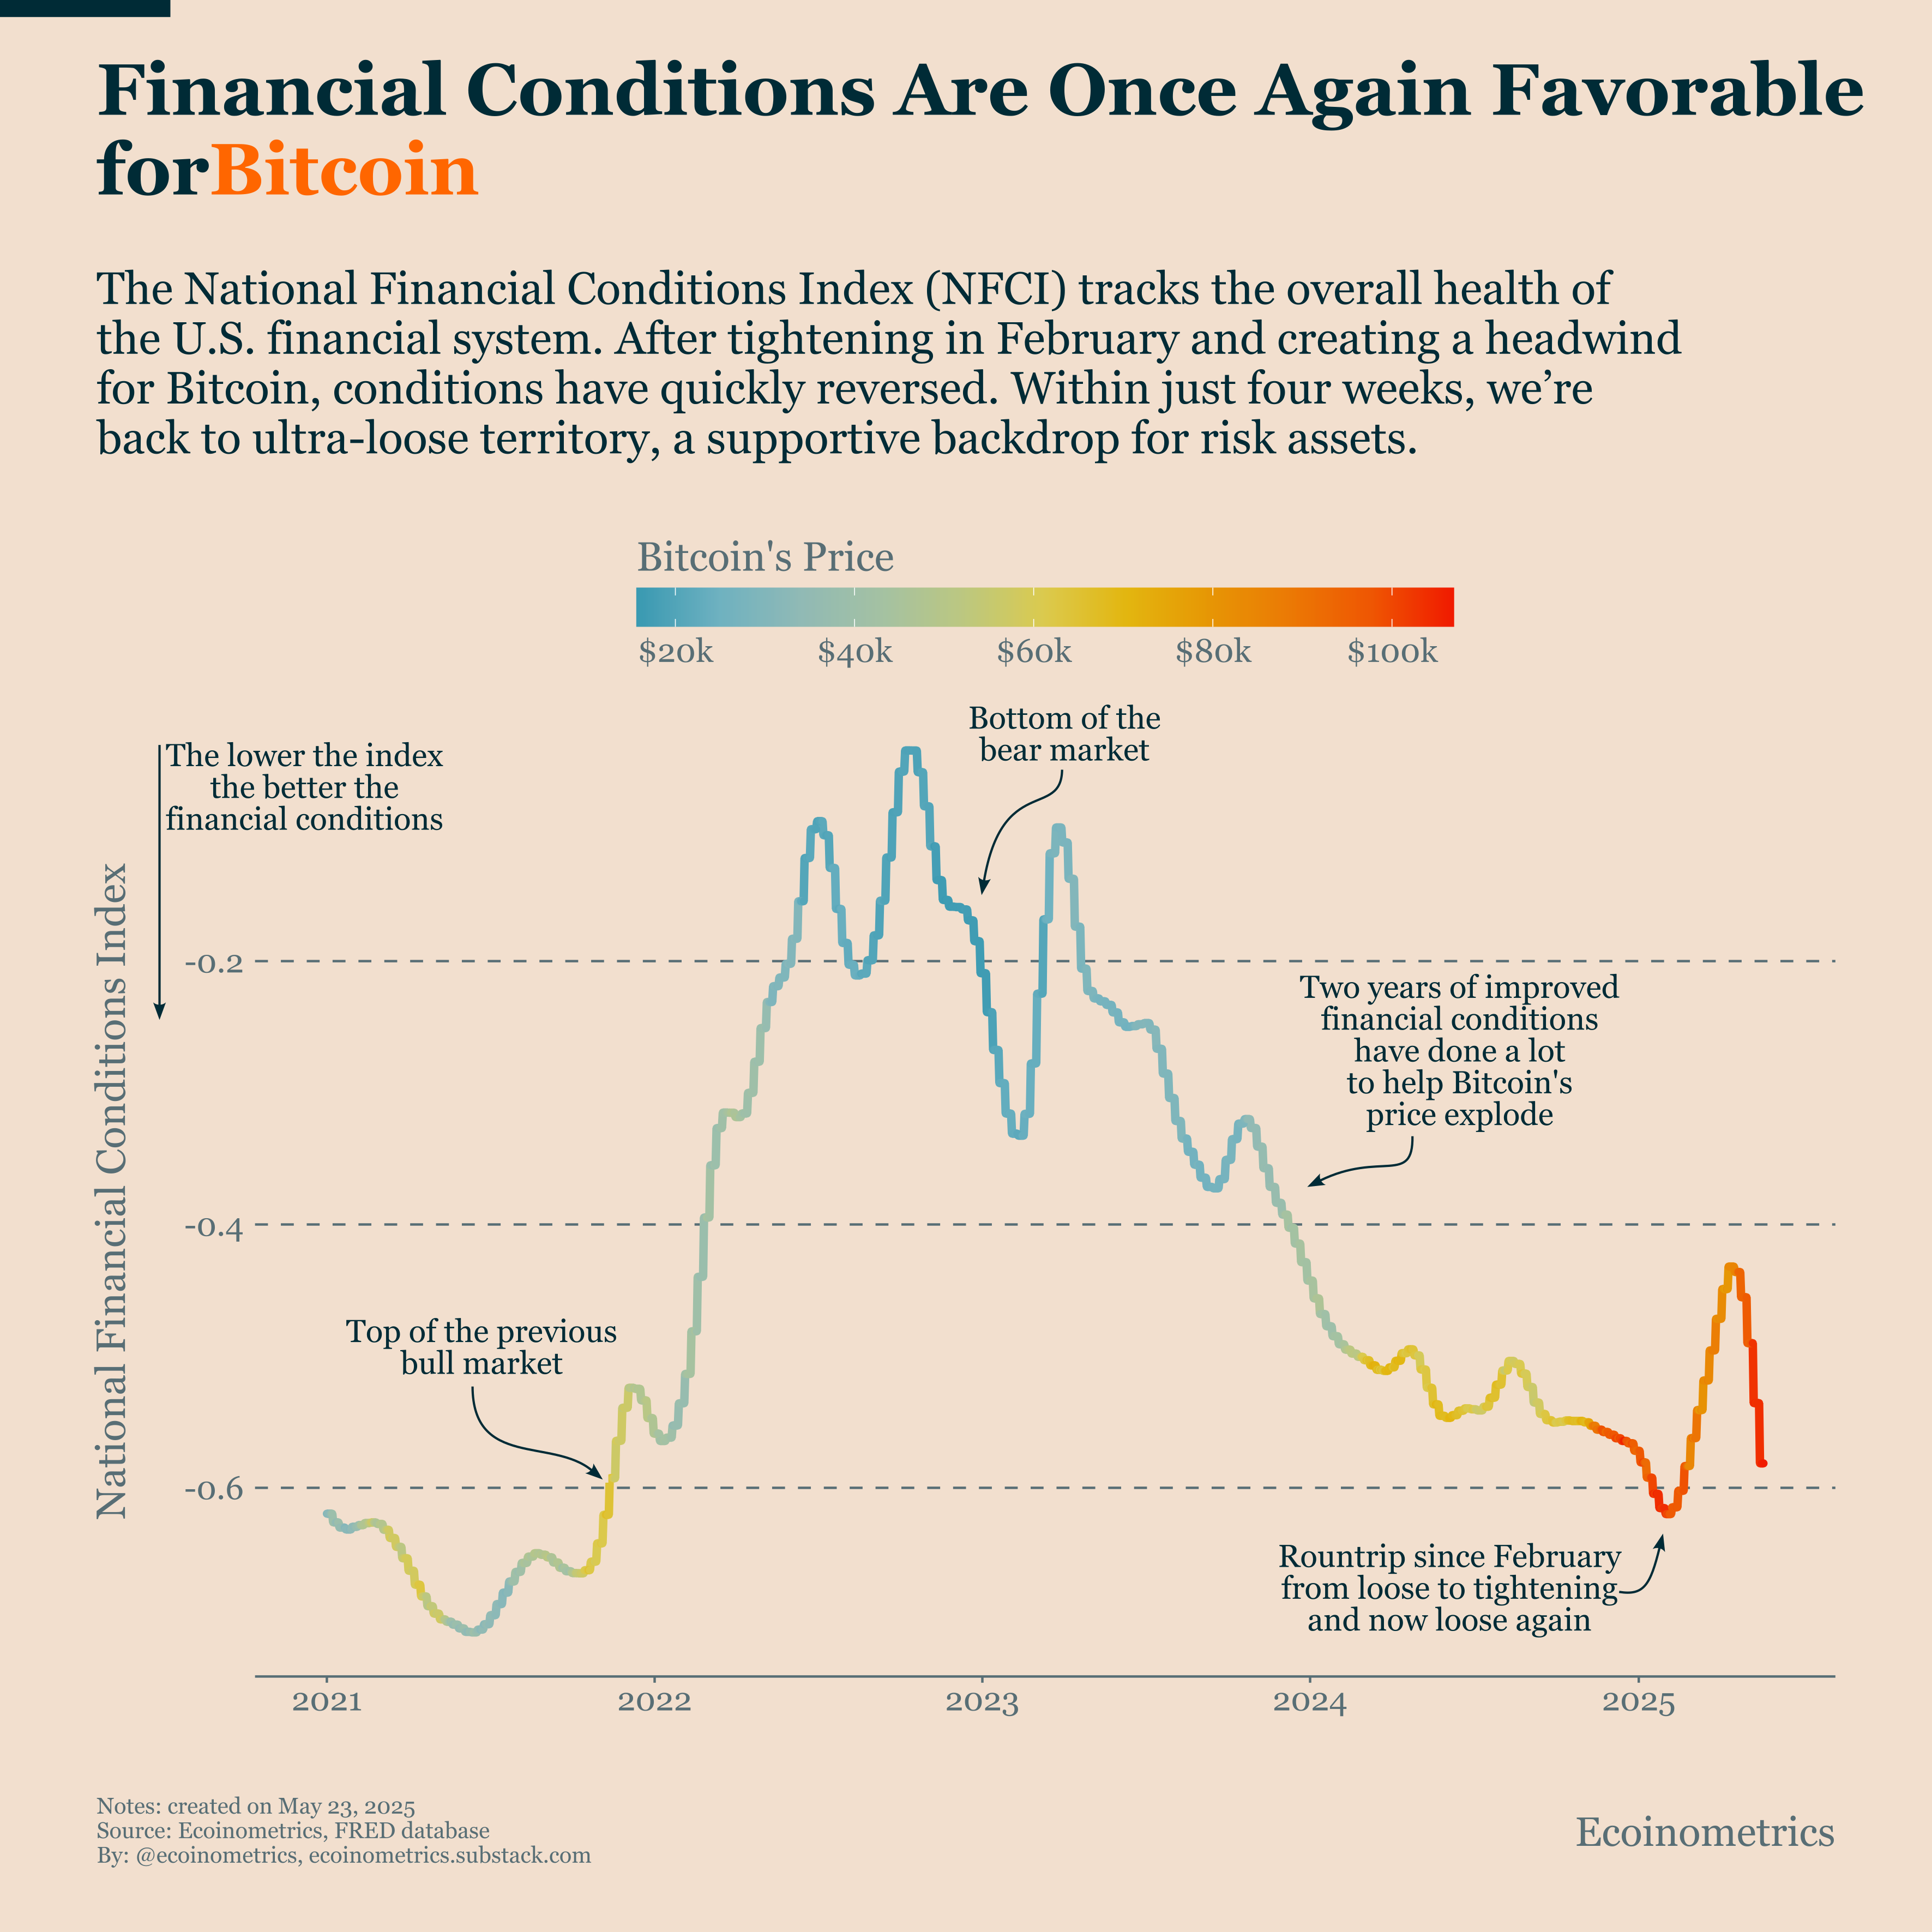
For more than two years, basically since the peak of quantitative tightening in 2022, financial conditions had been trending looser. That helped Bitcoin recover from the bear market lows.
But in February, that trend broke and it broke fast.
A mix of policy uncertainty from the Fed and the tariffs tantrum triggered the sharpest tightening in financial conditions since 2023. You can see it in the chart below, where the National Financial Conditions Index (NFCI) spiked upward.
That created a real headwind for Bitcoin. But the spike didn’t last.
Confidence returned just as fast as it left. In the span of a few weeks, financial conditions eased back toward ultra-loose territory. That’s the kind of liquidity backdrop where Bitcoin tends to do very well.
And that’s exactly what happened. Bitcoin reversed sharply and pushed through to new highs.
It’s a reminder of a basic principle: Bitcoin performs best when liquidity is abundant and financial conditions are loose, just like other risk assets.
As long as the NFCI stays down here, that macro backdrop remains supportive.
Bitcoin Moves with the Flows
Financial conditions have improved recently. That creates the backdrop for Bitcoin to climb higher.
But it doesn’t happen automatically. Looser conditions encourage investors to deploy capital into growth assets. That’s the real mechanism behind Bitcoin’s move.
And nowhere is that more visible than in the Bitcoin ETF flows.
Over the same timeframe that financial conditions turned, we’ve seen a clear regime shift in ETF flows. They’ve flipped from net outflows to inflows, and those inflows have now climbed above 60,000 BTC over the past 30 days.
That’s a critical level.
Our ETF flows-to-price model shows that once flows stay above that threshold, the probability of sustained price gains increases significantly.
The chart below illustrates this. It shows the range of prices that are consistent with the recent pace of ETF inflows based on our model.
So far, May’s flows are tracking in line with our projections. If nothing changes, the model points to a likely Bitcoin price range between $100K and $120K by the end of the month.
As we always say: if you want to make tactical decisions about Bitcoin, follow the ETF flows. You can track them daily in our Bitcoin Market Monitor. As of now, they continue to show upward pressure.
This is one of the rare moments when market structure and macro line up. The liquidity backdrop supports risk assets, and the ETF flows give us a near-real-time signal of how that liquidity is being deployed. That’s why we track it so closely.
One thing to watch: If ETF inflows slow or reverse, we’ll revise our forecast range accordingly. But for now, the signal remains strong and the model is holding up well.

The Yield Curve Twists and Bitcoin’s Thesis Strengthens
Now this Bitcoin recovery doesn’t mean all is perfectly well in the financial markets.
If we turn our eye towards the bond market, we can see that there has been a repricing of risk for the U.S. along the yield curve compared to earlier this year.
The chart below shows a snapshot of the yield curve at three different moments:
In blue: late 2024, with a clean inversion across the curve.
In orange: early 2025, when normalization seemed within reach.
In red: today’s reality, a re-inversion with new complications.
By comparison to the normal shape of the yield curve, we’re observing a number of quirks.
After months of easing tension, the curve has twisted back into an unusual sort of W shape. Short-term rates remain elevated, reflecting the Fed’s cautious stance. But yields on 2Y and 3Y notes have dropped again, a sign markets still expect policy easing ahead.
What’s more striking is what’s happening at the long end. The 10Y and 30Y yields have spiked again aggressively over the past few weeks, not because of stronger growth expectations, but because of investor concern. Concerns over rising fiscal deficits, larger Treasury issuance, and weakening demand in bond auctions have pushed long-term yields sharply higher.
This isn’t just a mechanical move, it’s a warning shot from the bond market. A reminder that even as inflation pressures cool, the structural risks tied to debt sustainability and market confidence are far from resolved.
Bitcoin might benefit from easing financial conditions, but the bigger picture shows that risk hasn’t disappeared, it’s just being repriced.
This kind of re-inversion, driven not by policy rates but by long-end stress, isn’t just a macro curiosity. It taps straight into Bitcoin’s foundational thesis.
The bond market is starting to question the long-term sustainability of U.S. debt. And that raises a familiar specter: debt monetization.
If the path out is more QE, more fiscal dominance, or more dilution of purchasing power this will for sure fuel Bitcoin’s narrative as a hedge against the debasement of the U.S. dollar.

That's it for today. Thanks for reading.
Cheers,
Nick
P.S. Every week, our team conducts extensive research analyzing market data, tracking emerging trends, and creating professional-grade charts and analysis.
Our mission: Deliver actionable macro and Bitcoin insights that help institutional investors and financial advisors make better-informed decisions.
Ready for institutional-grade research that puts you ahead of the market? Click below to access our premium insights.