


Bear market or bull market? For Bitcoin it can be hard to tell.
Also high inflation countries have nothing to lose and the housing bubble v2.

Welcome to the Friday edition of the Ecoinometrics newsletter.
Every week we bring you the three most important charts on the topics of macroeconomics, Bitcoin and digital assets.
Today we'll cover:
Bear market or bull market? For Bitcoin and Ethereum it can be hard to tell.
Countries that are experiencing hyperinflation might as well try crypto.
Are we seeing a clear setup for the version 2 of a US housing bubble?
Each topic comes with a small explanation and one big chart. So let’s dive in.
In case you missed it, here are the other topics we covered this week:
If you aren’t subscribed yet, hit the subscribe button, to receive this email every week directly in your inbox:
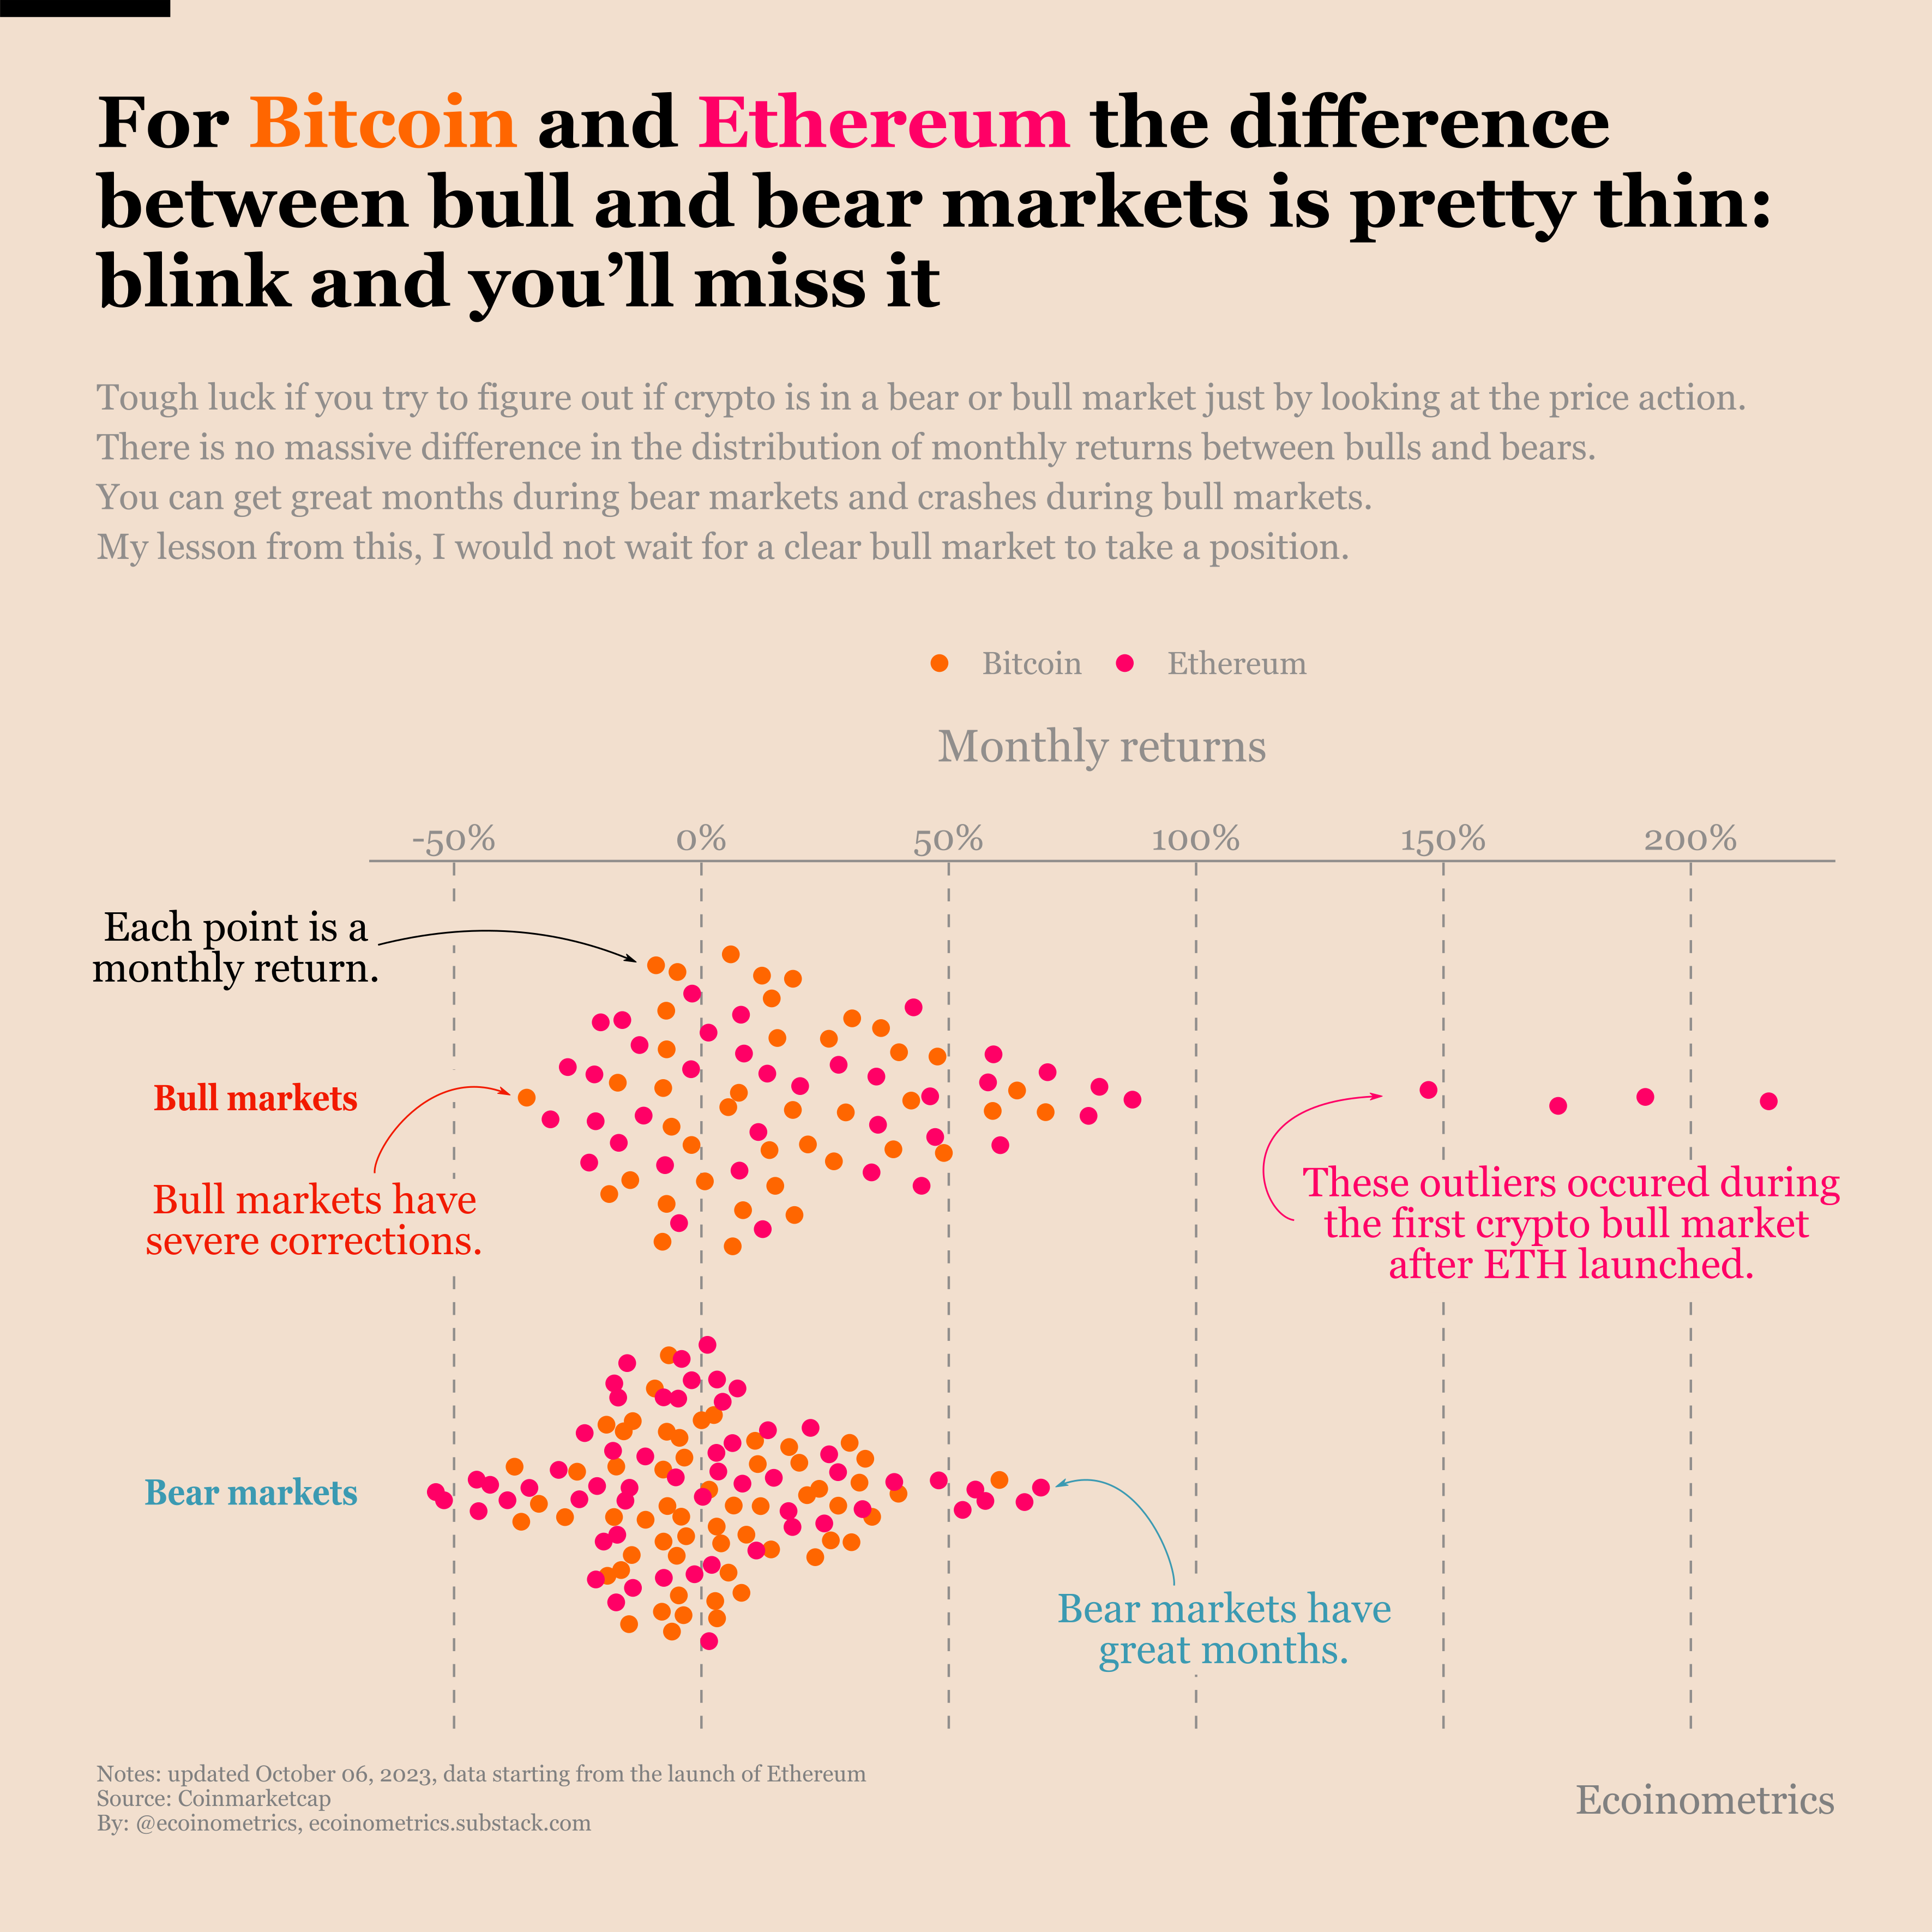
Can you tell if Bitcoin (or Ethereum) is in a bull or a bear market?
How easy is it to spot the transition between a bull market and a bear market for crypto?
Turns out if you are looking only at the monthly returns this is really damn tough. You can visualize that in the chart below where we have plotted the distribution of the monthly returns of BTC and ETH during the bull and the bear markets.
The main difference between a bull and a bear is the ratio of positive months to negative months.
Otherwise you can find bad months during bull market and great months during bear markets. Which means that if you only have a few months to work with it is not possible to decide with any certainty.
So one lesson from that is the fact that the price action is not a great indicator of the market regime. You are better off looking at other metrics to try to figure this out.
The second less is that trying to time the bull market is probably a bad idea. By the time you have enough data to confirm that you really are in a bull market you have already missed the train.
The superior process is to assess the price at which Bitcoin or Ethereum offer a good reward to risk ratio according to your investment goals.
Then buy as soon as this price target is reached and wait for time to do its thing.
Countries experiencing hyperinflation have nothing to lose
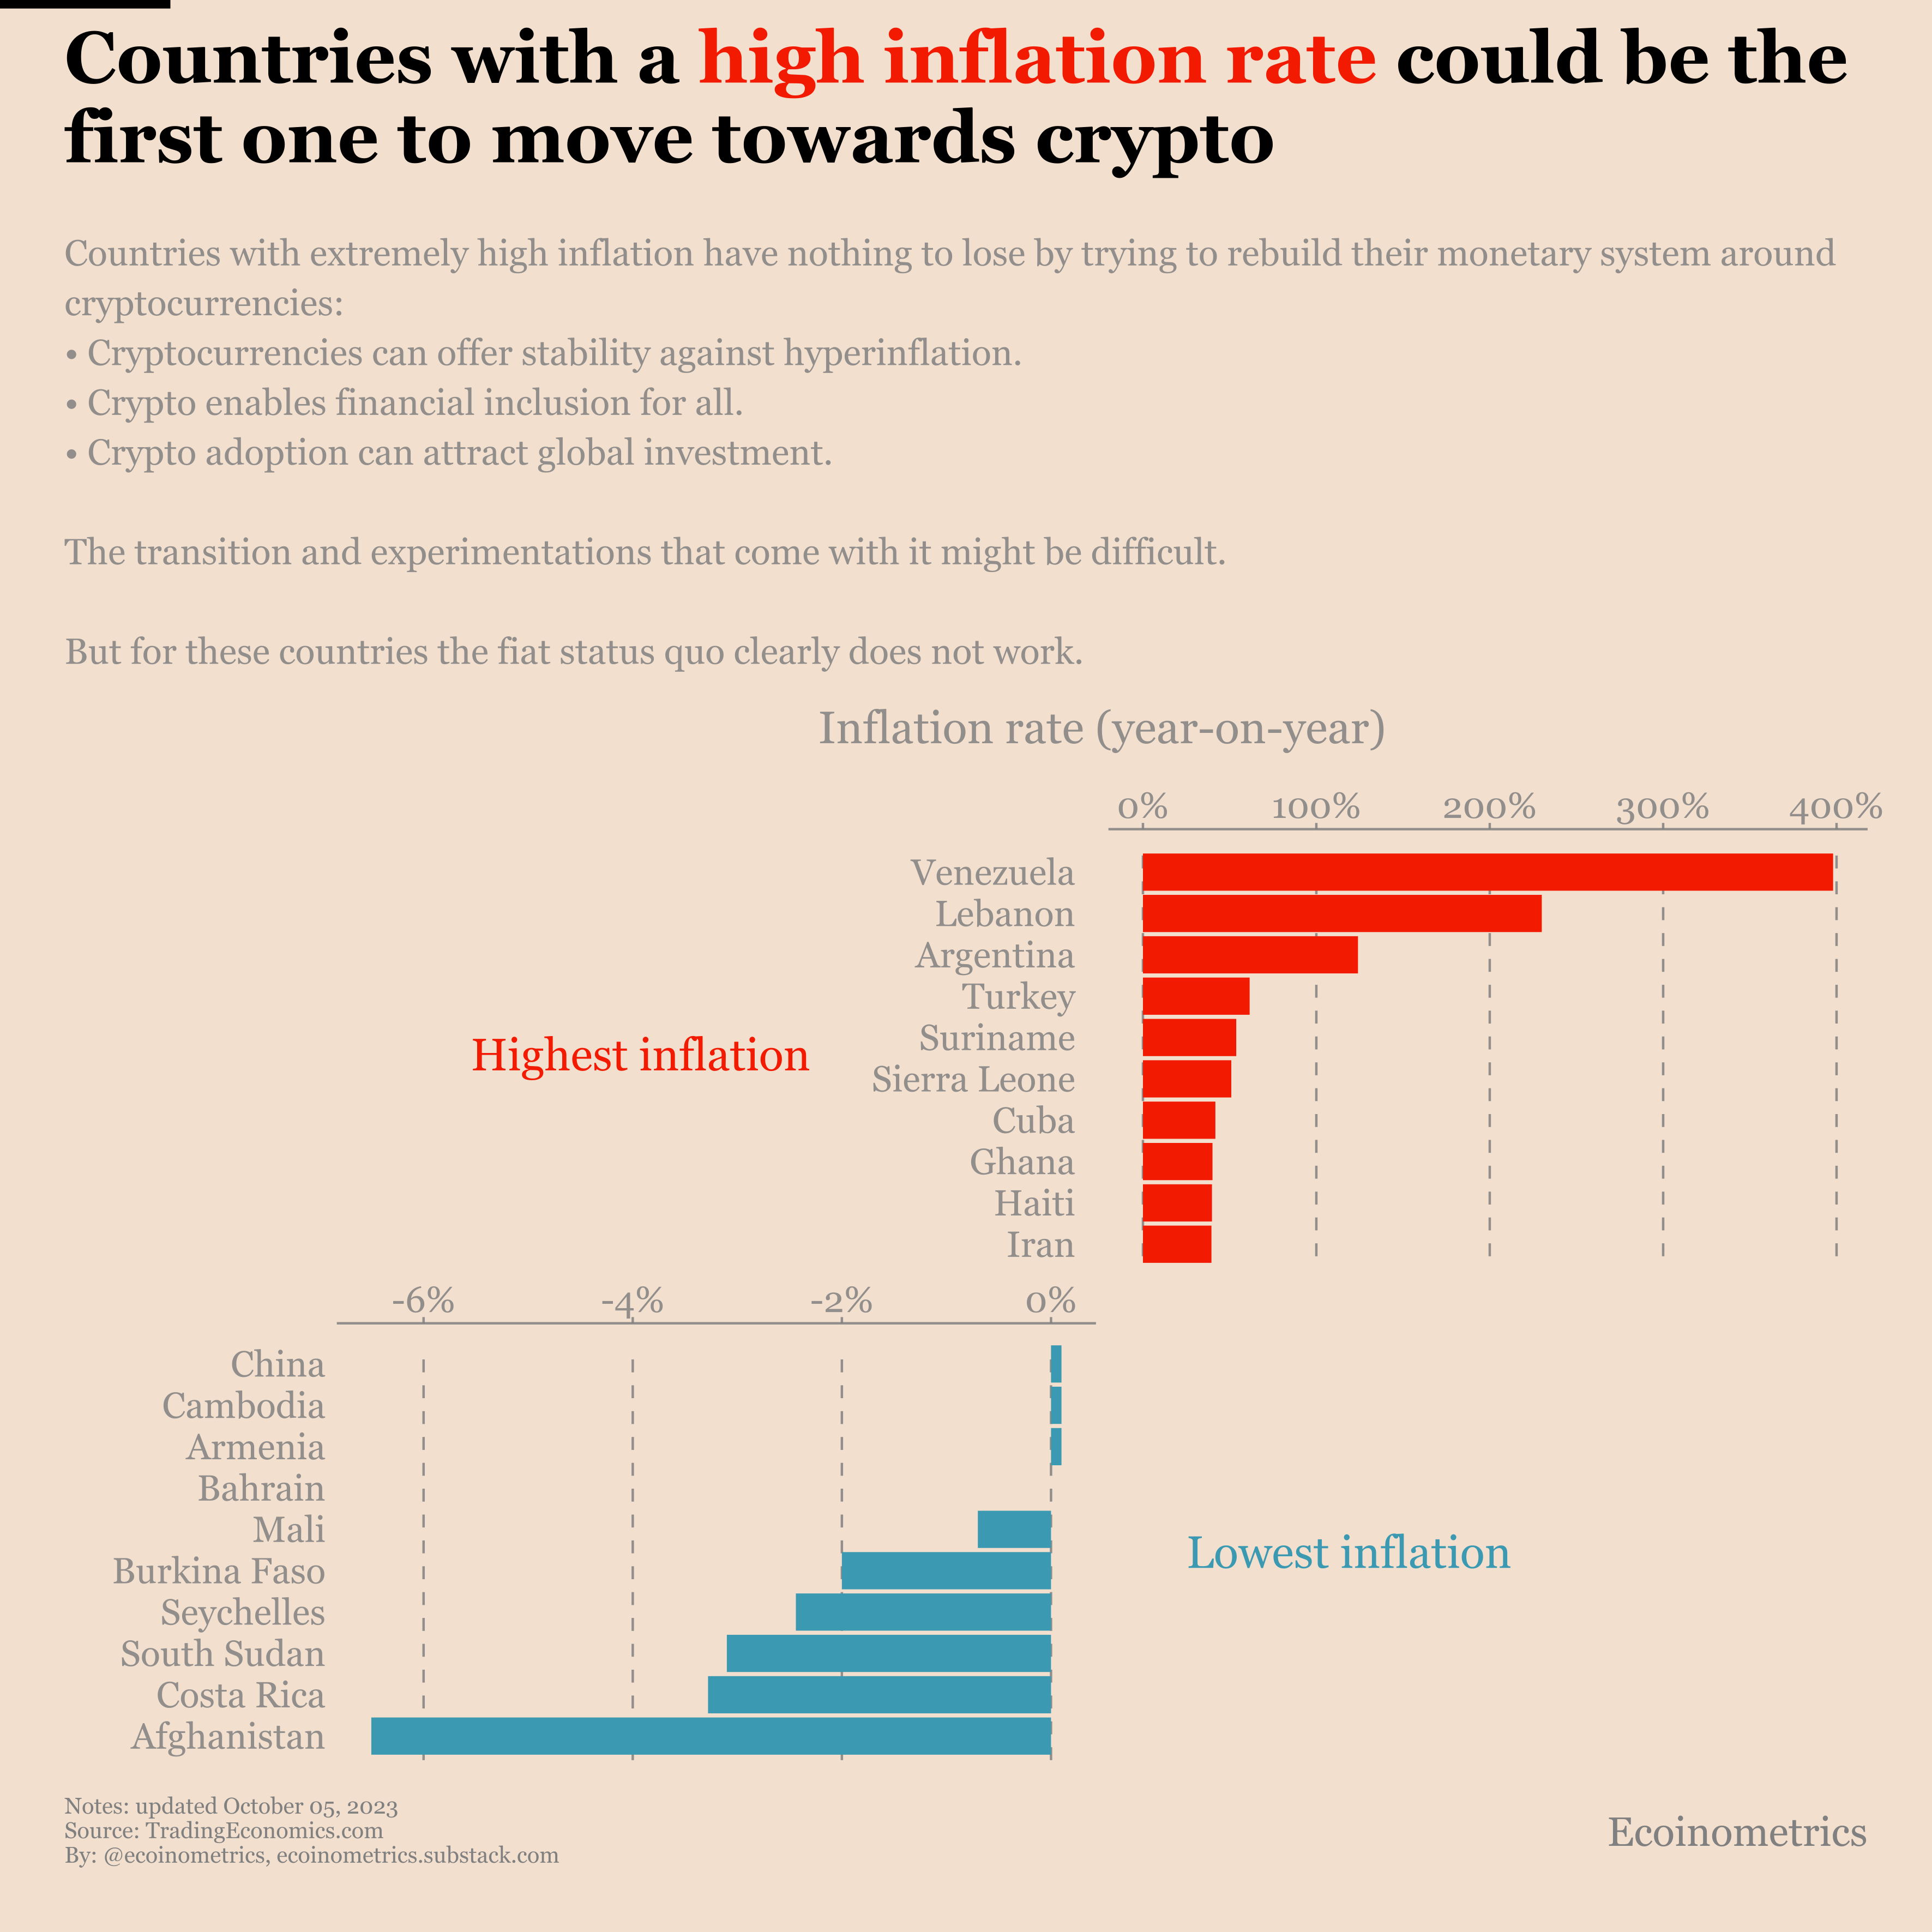
If your country is running on a monetary system that’s producing a consistent 35%+ inflation rate what do you have to lose by rebuilding it around crypto?
If you are based in a G20 country with a high single digit inflation rate you have already felt the pinch over the last couple of years. But when the inflation rate is at 35%+ the purchasing power of your savings is basically halved every 18 months.
This is what countries like Venezuela, Lebanon, Argentina or Turkey are experiencing.
In that case what do the people really have to lose by experimenting with crypto based monetary systems.
In theory:
Cryptocurrencies can offer stability against hyperinflation.
Crypto can enable financial inclusion for all.
Crypto adoption can attract global investments.
Of course it isn’t that simple. The transition and experimentations that come with it might be difficult. But for these countries the fiat status quo clearly does not work.
Now the real challenge is that the people at the top in these countries benefit from this status quo. They have no incentive to change. But it is a good thing that the decentralized nature of crypto allow from movements to start from the ground up. Let’s see what will come out of it.
Housing bubble v2: the setup for a crash
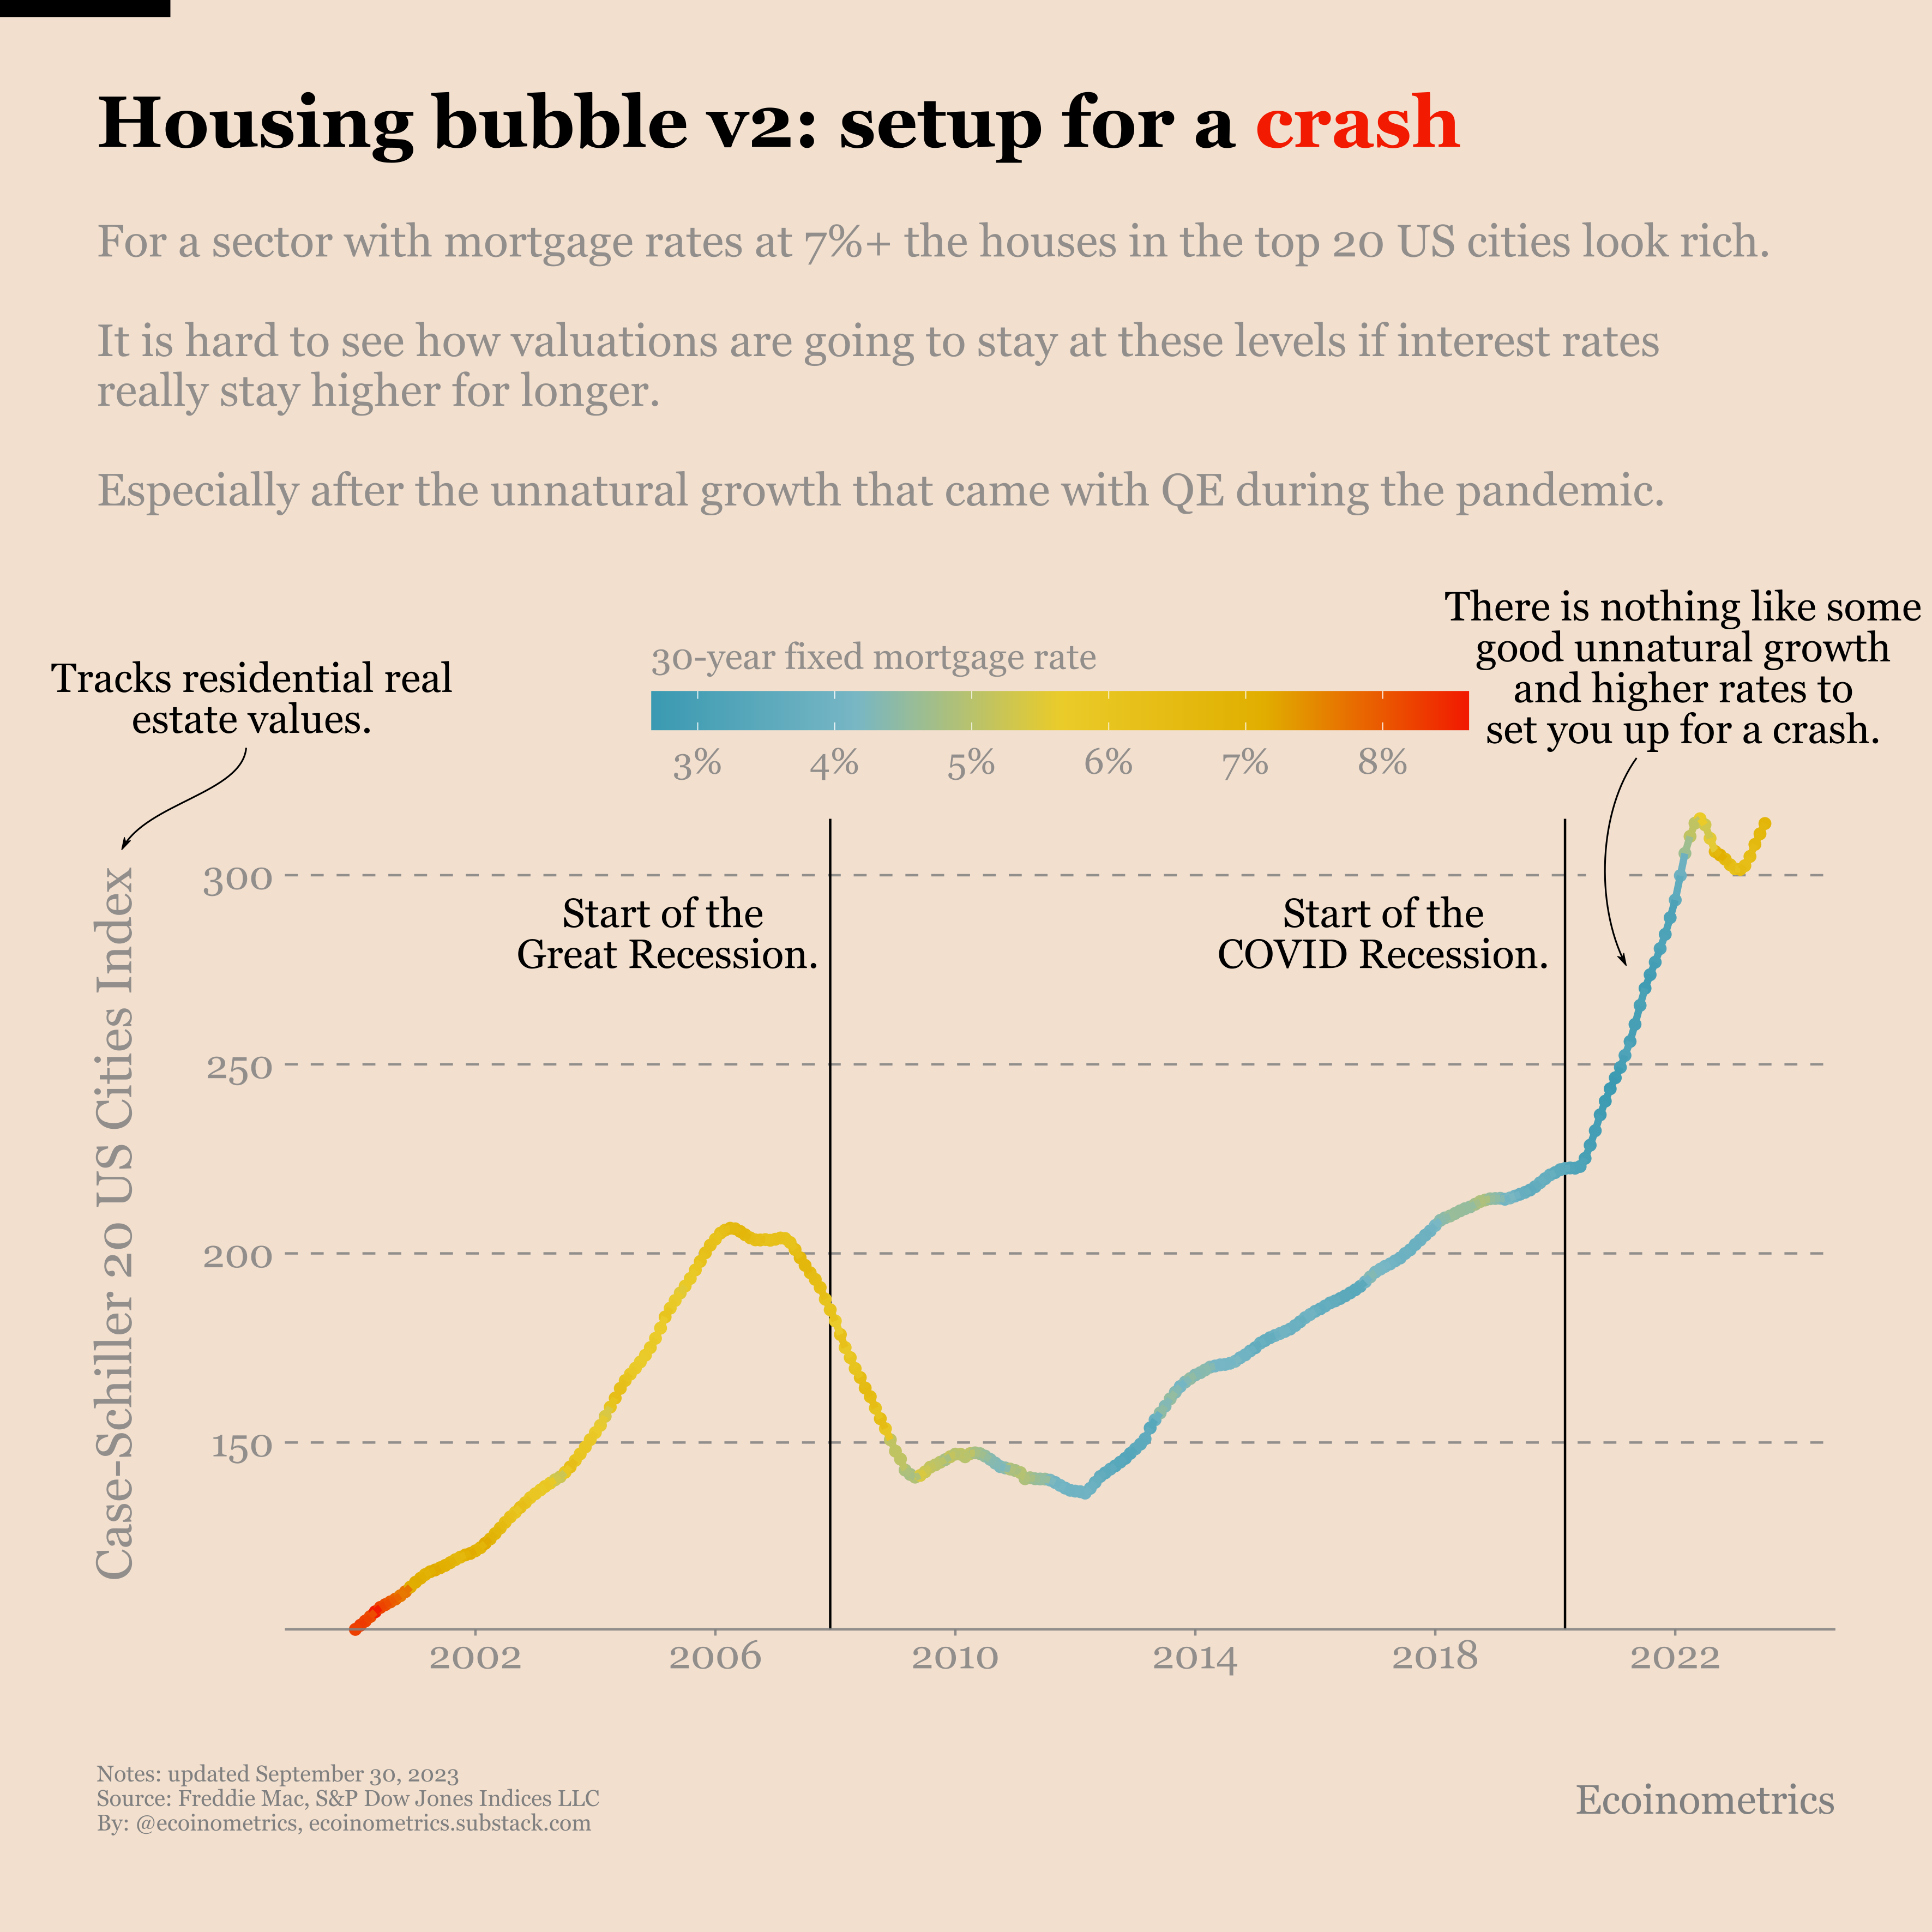
Hear me out. The housing market in the US is in a bubble. And the setup for a crash is already there.
Here is my case.
The period of Quantitative Easing that followed the COVID crash has artificially pumped the value of residential real estate. Rates were too low. There was too much liquidity. Valuations got out of hands.
The Federal Reserve raising rates has put a stop to this unnatural growth. Basically the rate hike sequence marked the top of the bubble. But house prices haven’t yet come back down to earth.
At this point in time your 30-year fixed mortgage rate is at 7%+ which means that refinancing or getting a new mortgage is not viable.
The result is that new buyers cannot afford to buy and sellers cannot afford to take a hit on their properties. This is where we stand out right now.
If interest rates stay higher for longer then the sellers are the weak link. As soon as a few start to lower their prices everyone gets marked down and the residential real estate comes. This is bound to happen.
Maybe the correction won’t be as large as during the Great Recession. But just to get back to the historical trend line we are talking a 25%+ correction. If you add a recession on top of that it could be worse.
Definitely something to keep an eye on.
That’s it for today. I hope you enjoyed this. We’ll be back next week with more charts.
Cheers,
Nick
P.S. We spend the entire week, countless hours really, doing research, exploring data, surveying emerging trends, looking at charts and making infographics.
Our objective? Deliver to you the most important insights in macroeconomics, Bitcoin and digital assets.
That also means we want more people to see these charts.
So here is a gentleman’s agreement, we provide these Friday charts free of charge and if you find them interesting then you spread the word by either:
Sharing this issue of the newsletter
Or if you are on X/Twitter by commenting and retweeting the thread at the link below
Thank you for your help 🤝