
Bitcoin Is Not A Fringe Asset
Also Bitcoin Below The Halving Range & Financial Conditions Keep Getting Looser

Welcome to the Friday edition of the Ecoinometrics newsletter.
Every week we bring you the three most important charts on the topics of macroeconomics, Bitcoin and digital assets.
Today we'll cover:
Bitcoin Is Not A Fringe Asset
Bitcoin Below The Halving Range
Financial Conditions Keep Getting Looser
Each topic comes with a small explanation and one big chart. So let’s dive in.
In case you missed it, here are the other topics we covered this week:


Checkout the Bitcoin Market Monitor to understand what’s driving the market in just five charts:

Read the Bitcoin Market Forecast for the probabilities of key scenarios and the essential risk metrics to manage your portfolio:

If you aren’t subscribed yet, hit the subscribe button, to receive this email every week directly in your inbox:
Bitcoin Is Not A Fringe Asset
Some investors still consider Bitcoin a "fringe asset." They compare investing in Bitcoin to trading Pokemon cards or other esoteric, risky ventures.
The numbers tell a different story.
Bitcoin has a $2 trillion market cap, making it equivalent to the sixth-largest company in the world.
Bitcoin's spot ETFs have been remarkably successful. In just one year, they've attracted $41 billion in net inflows, one of the most successful ETF product launches ever.
Three Bitcoin ETFs have already reached the top 100 ETFs by assets under management. The largest one, BlackRock's ETF, manages $60 billion in assets. That's approaching the size of GLD, the largest gold ETF, which manages $78 billion. The key difference? Bitcoin reached this scale in one year, while gold took twenty years.
The conclusion is clear: Bitcoin is deeply integrated into the global financial system. Its size and institutional adoption have essentially eliminated regulatory risk. For those who haven't invested yet, there's no reason to keep waiting.

Bitcoin Below The Halving Range
Here's our regular update comparing Bitcoin's performance to previous halving cycles.
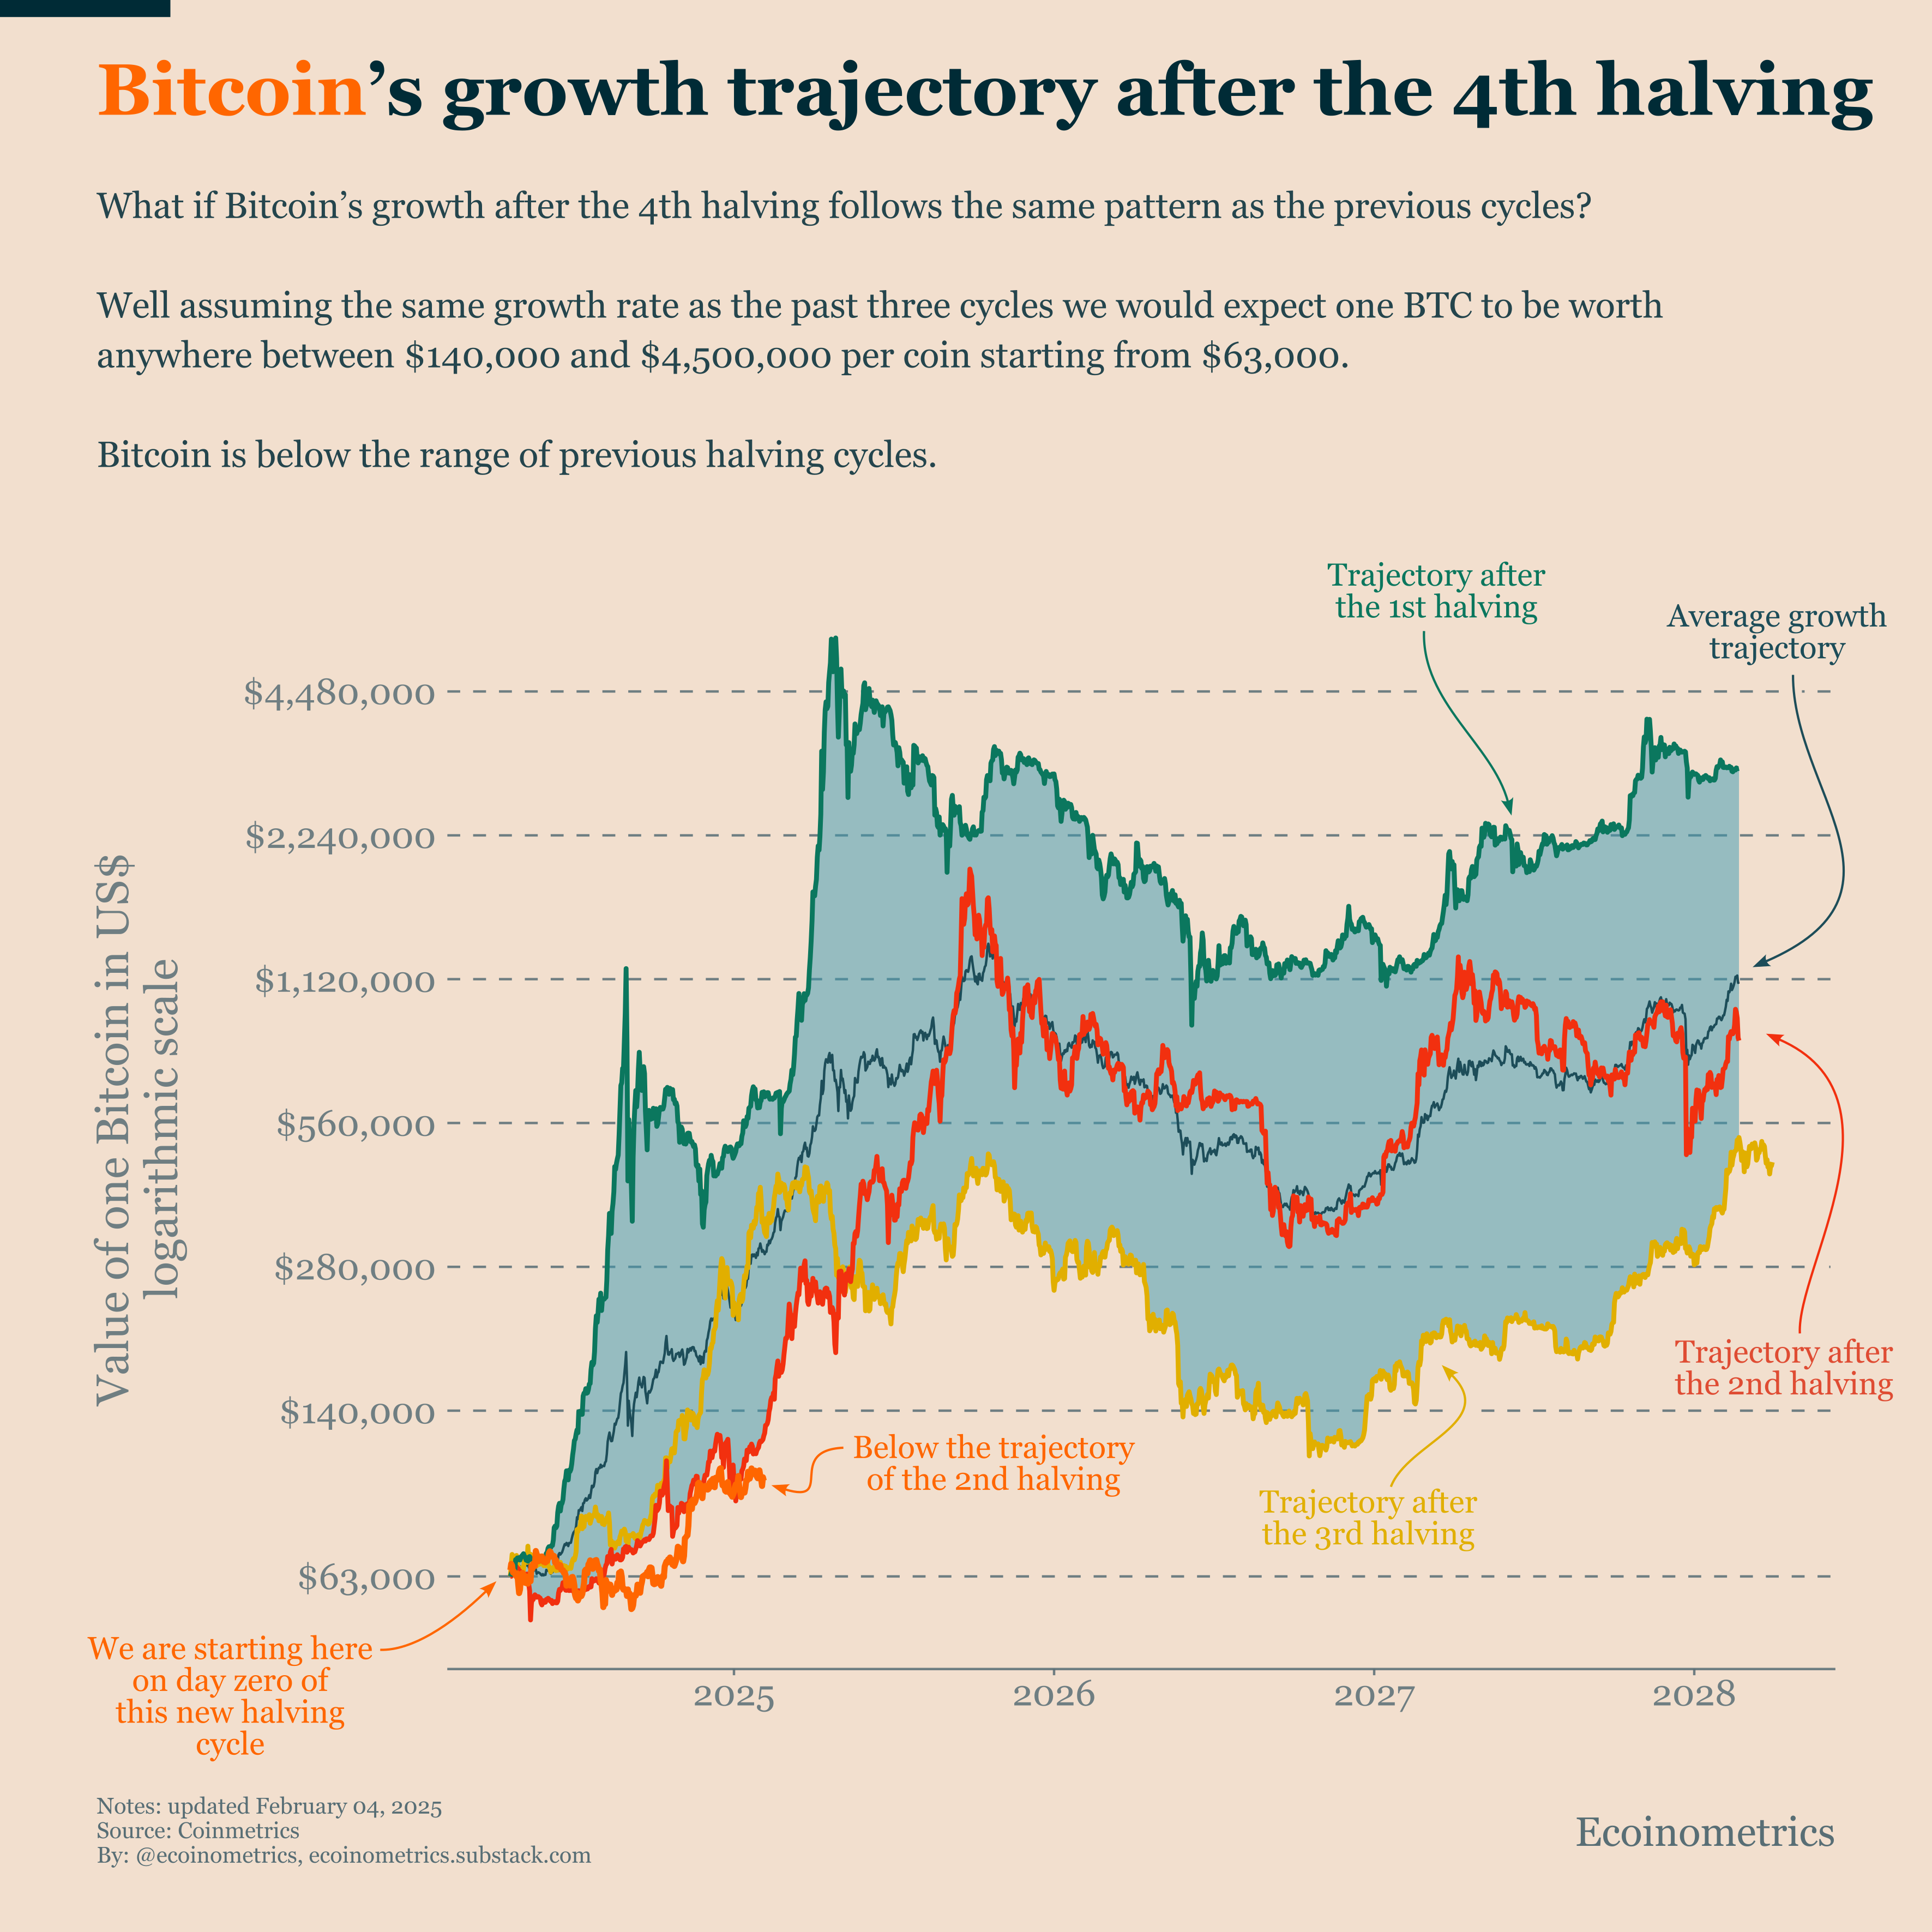
As shown in the chart below, Bitcoin remains below the historical range, though not by much. Over the past few months, this fourth halving cycle has mostly followed the trajectory of the second halving.
But Bitcoin needs to make a significant move soon to keep pace with historical patterns. Typically, most growth in a cycle occurs during the first year. The fourth halving happened in April last year. Based on previous cycles, we should be seeing stronger growth by now.
This more modest growth pattern might actually signal market maturity. While previous cycles were marked by dramatic parabolic moves at this stage, the current cycle shows more restrained price action. This suggests a maturing market that's becoming less prone to extreme volatility, a positive sign for long-term adoption.
There's a reason why growth tends to spike every four years after a halving: the global liquidity cycle roughly follows the same timing.
Since late last year, risk assets have been running ahead of the liquidity cycle. Whether Bitcoin experiences another parabolic move will depend on global liquidity conditions. We'll continue monitoring this relationship.
Financial Conditions Keep Getting Looser
Here's a paradox.
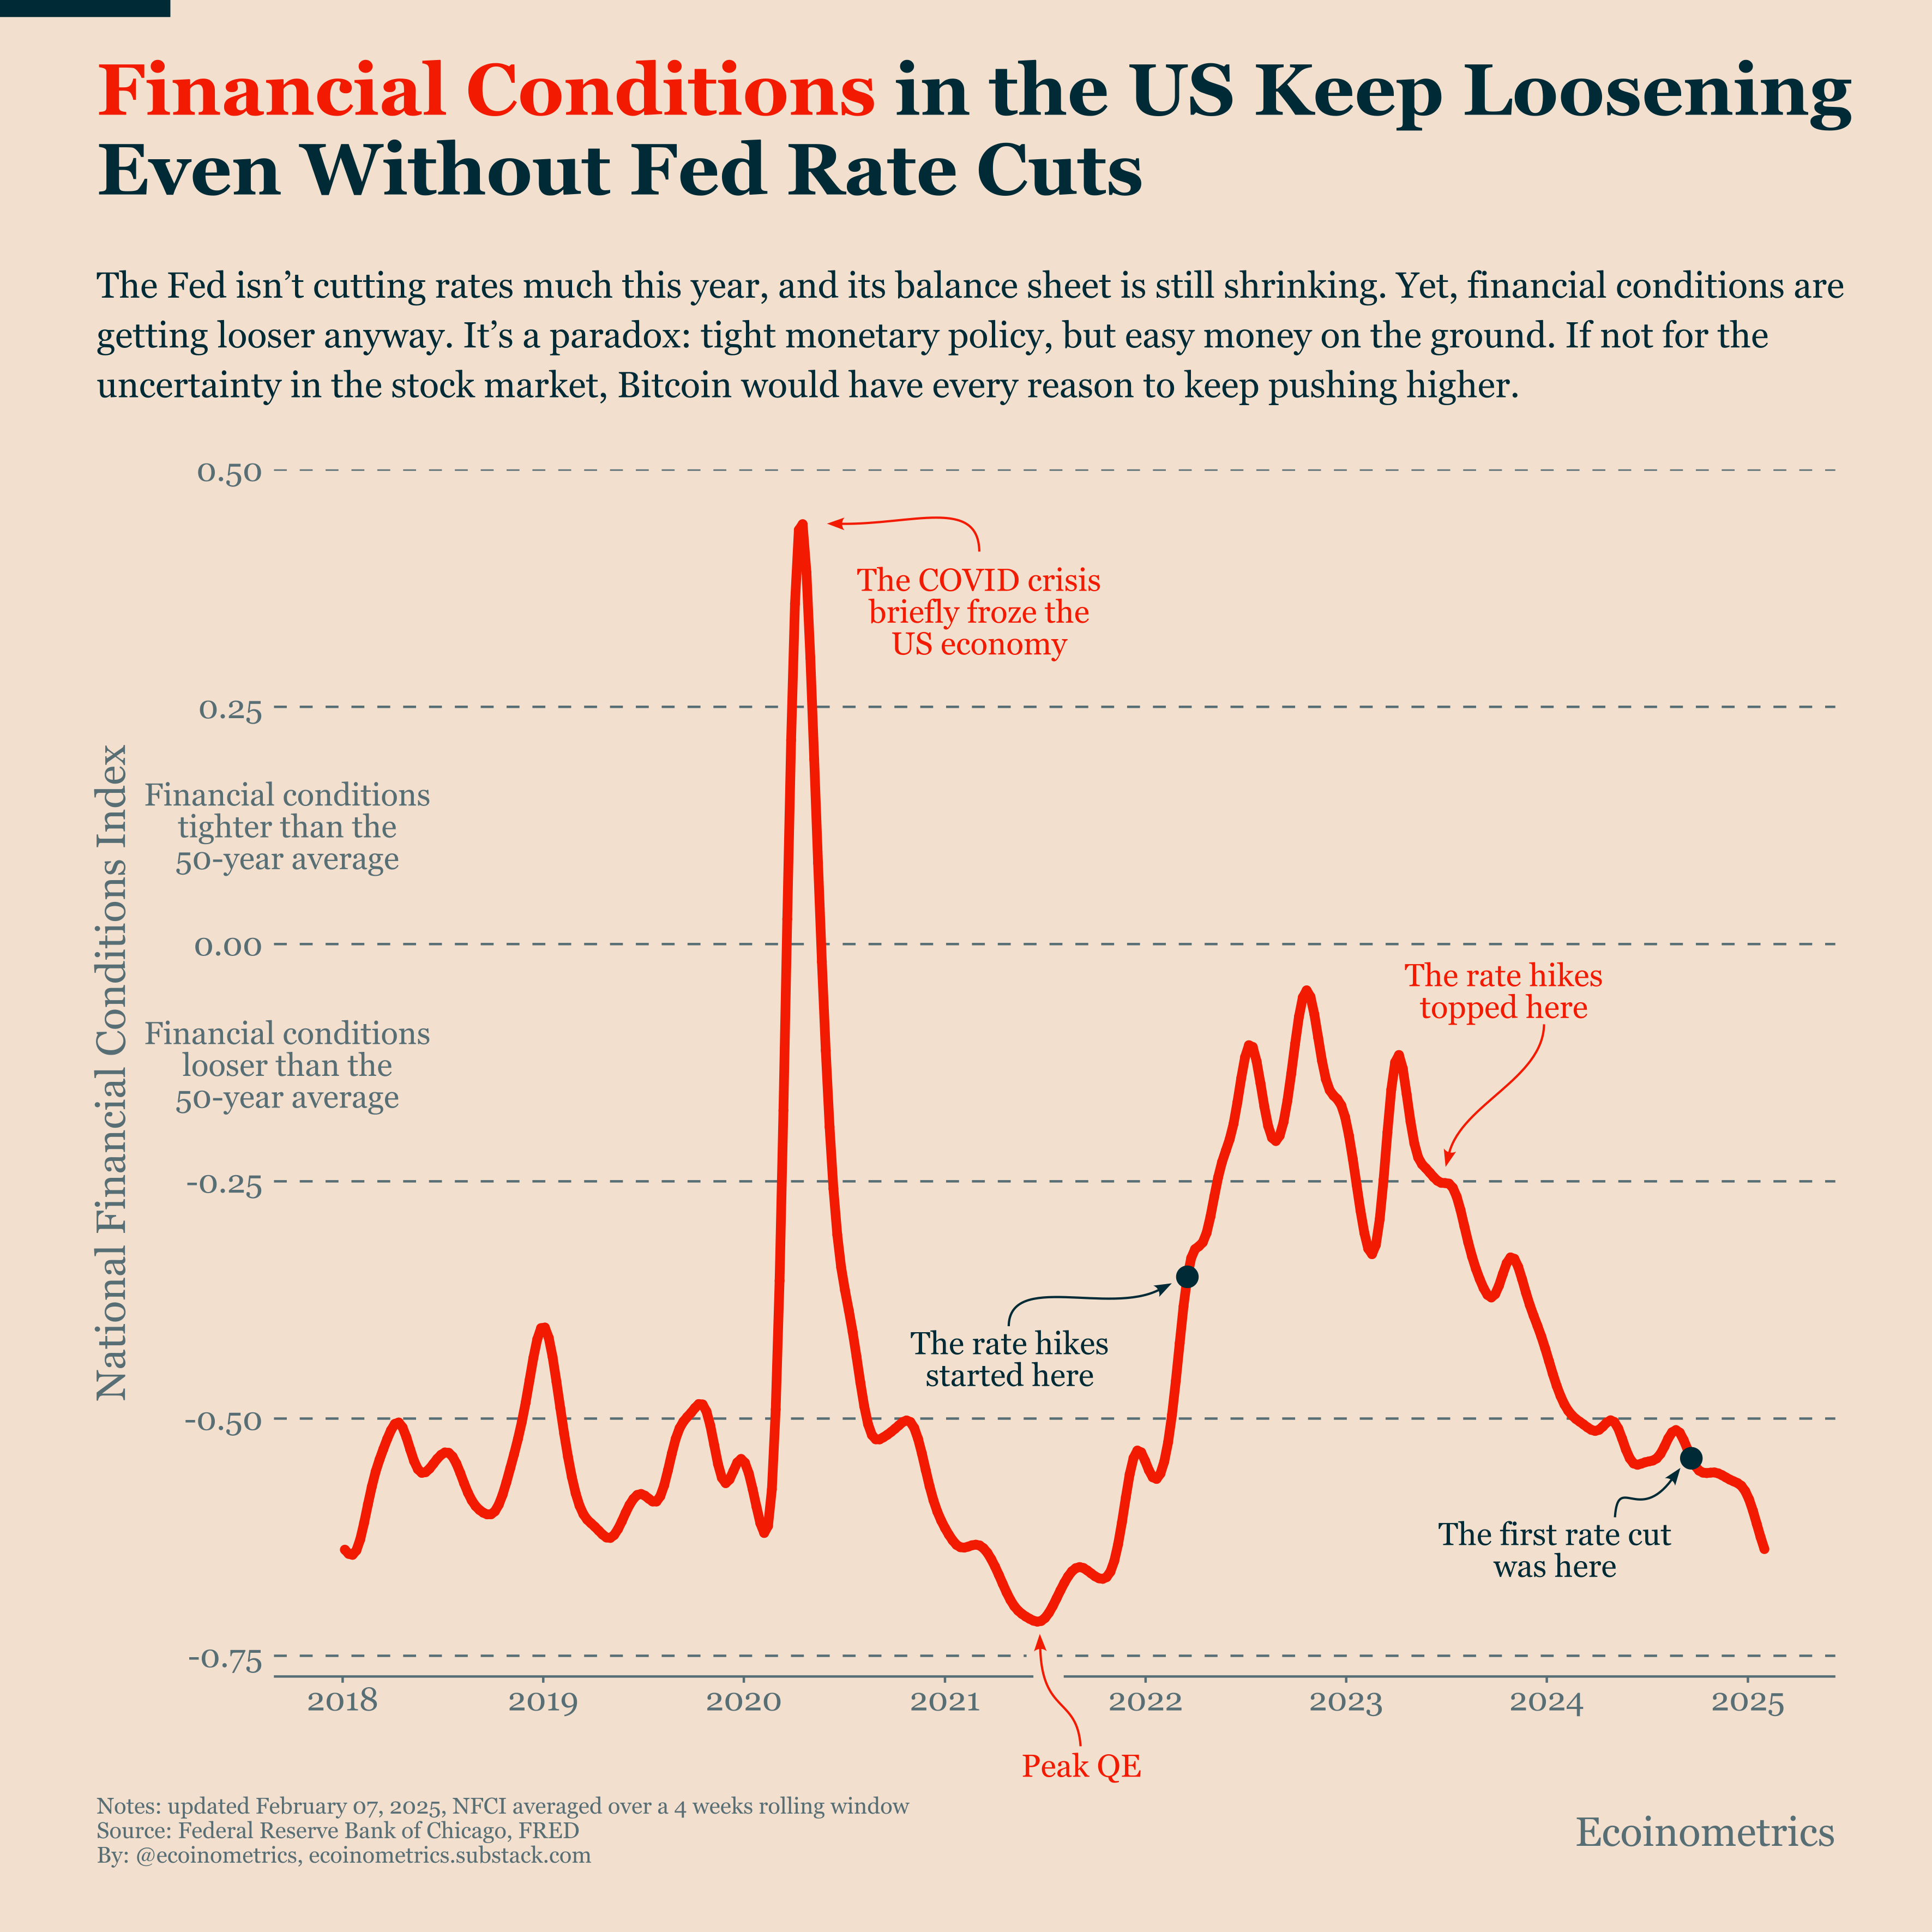
The Federal Reserve has been conservative with rate cuts. They cut rates only modestly last year and plan even fewer cuts this year. Their balance sheet continues to shrink. Yet, financial conditions in the US keep getting looser.
This trend connects to our earlier observation about financial assets anticipating the return of global liquidity before it actually materializes. Financial conditions can ease despite tight monetary policy because market participants are pricing in future policy changes and showing increased risk appetite. Banks are lending more freely, credit spreads are narrowing, and market volatility is decreasing, all contributing to looser conditions even without Fed action.
This disconnect between Fed policy and financial conditions isn't unusual. Market psychology typically moves faster than policy changes, creating opportunities for investors who can handle short-term volatility.
This creates both opportunity and risk. If the expected monetary easing doesn't materialize, we could see a market reversal. However, if you look past the stock market uncertainty that's been holding Bitcoin back, there's room for continued upward movement.
The current market indicators don't suggest we're heading into a bear market for risk assets, particularly Bitcoin. The smart approach now is to view any dips caused by fear, uncertainty, and doubt as buying opportunities. This is what institutional investors are likely to do.
That’s it for today. I hope you enjoyed this. We’ll be back next week with more charts.
Cheers,
Nick
P.S. We spend the entire week, countless hours really, doing research, exploring data, surveying emerging trends, looking at charts and making infographics.
Our objective? Deliver to you the most important insights in macroeconomics, Bitcoin and digital assets.
Armed with those insights you can make better investment decisions.
Are you a serious investor? Do you want to get the big picture to get on the big trades? Then click on the button below.