Bitcoin Rallies as Gold Extends Its Macro Edge
Also ETFs and Public Companies Are Driving Structural Bitcoin Accumulation & GDP Slipped, but Underlying U.S. Growth Remains Strong
Welcome to Ecoinometrics' Friday edition.
Each week, we analyze the three most critical market signals impacting Bitcoin and macro assets, delivering institutional-grade insights through data-driven charts and analysis.
Today we'll cover:
Bitcoin Rallies as Gold Extends Its Macro Edge
ETFs and Public Companies Are Driving Structural Bitcoin Accumulation
GDP Slipped, but Underlying U.S. Growth Remains Strong
Today’s charts show a clear picture of where we stand: Bitcoin is recovering lost ground with the help of ETF inflows, while Ethereum struggles to keep up. Behind the scenes, ETFs and public companies are now holding a significant chunk of the Bitcoin supply, a sign that institutional adoption is becoming structural. And despite a negative GDP headline, the real strength of the U.S. economy remains intact, keeping risk assets on solid footing.
In case you missed it, here are the other topics we covered this week:
Essential Decision-Making Tools
Bitcoin Market Monitor - Key Drivers in Five Charts:
Bitcoin Market Forecast - Probability Scenarios & Risk Metrics:
Get these professional-grade insights delivered to your inbox:
Bitcoin Rallies as Gold Extends Its Macro Edge
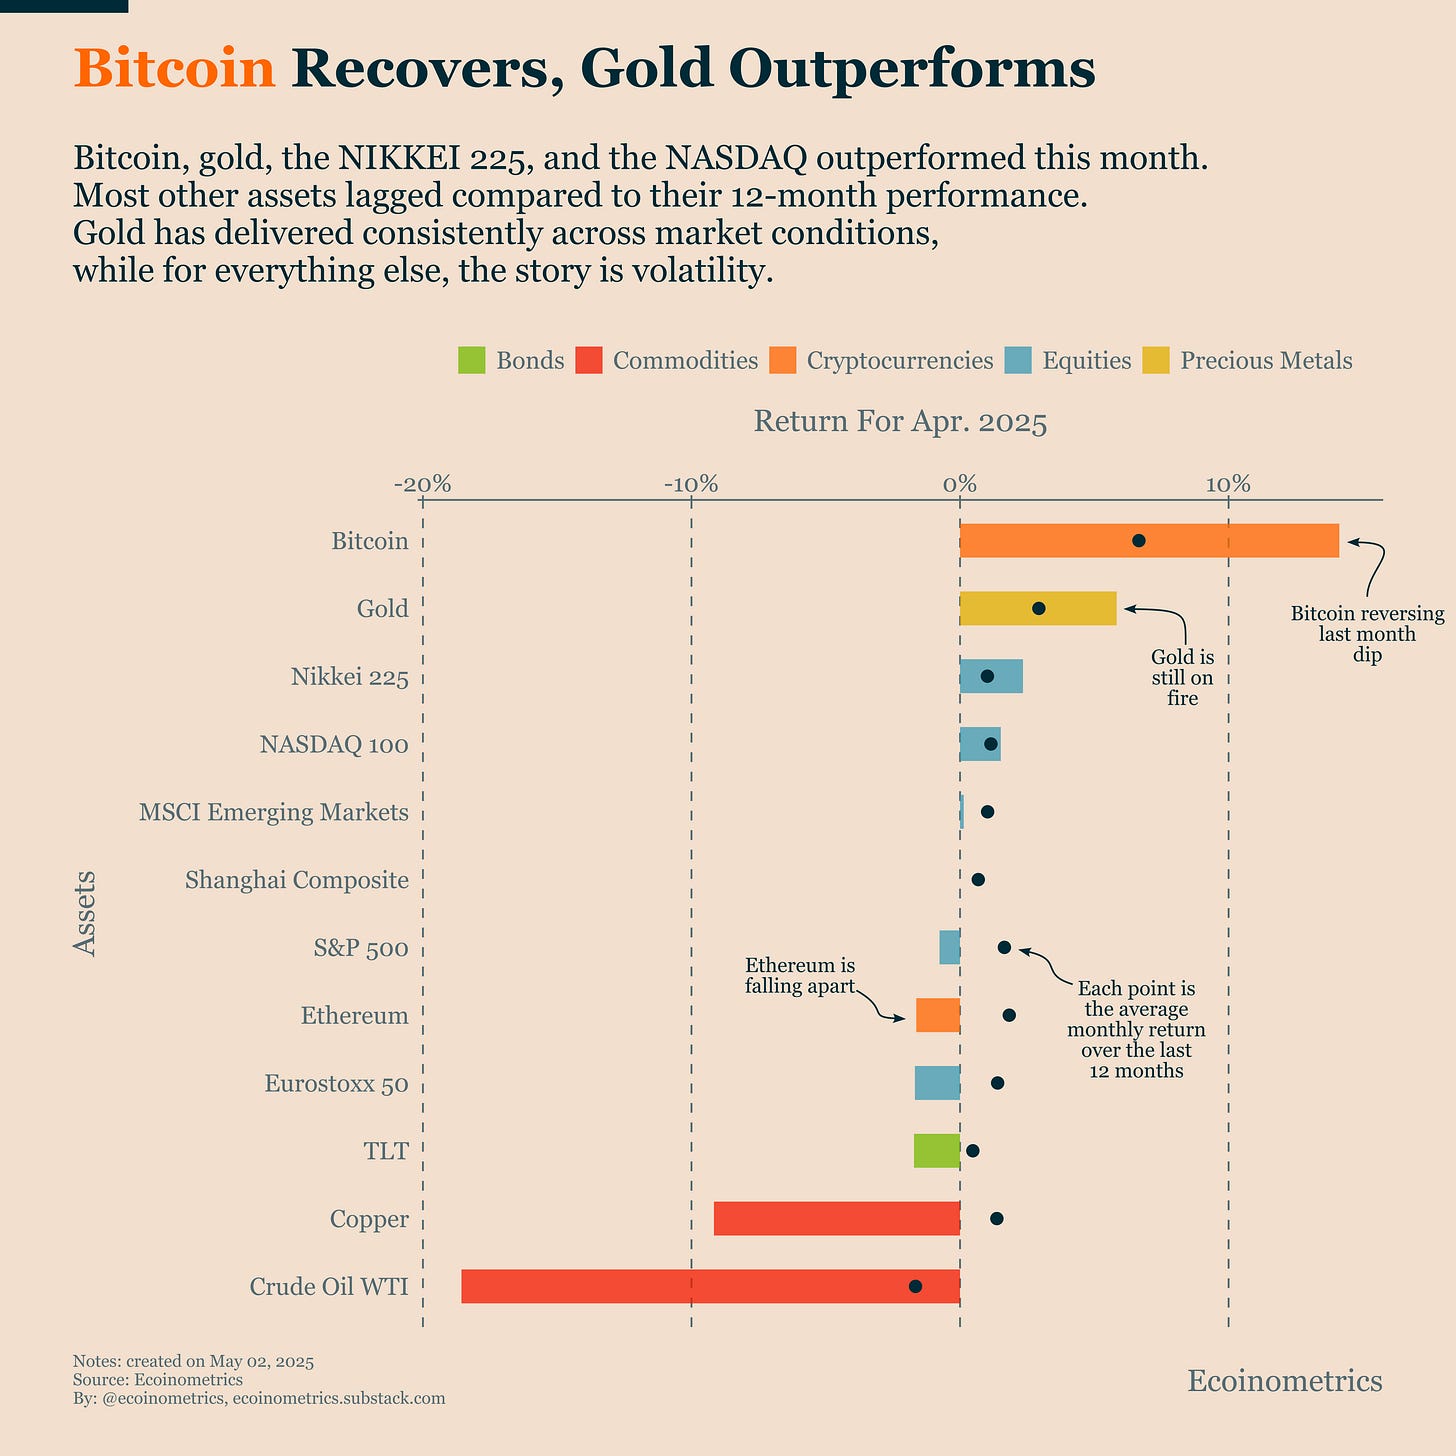
The chart shows April returns for a range of assets. The bars are this month’s returns; the dots represent each asset’s average monthly return over the past 12 months.
Gold continues its strong run. For nearly two years, it has delivered consistently, and April was no exception. In contrast, most other assets have been volatile, lacking any clear direction in the last few months.
Bitcoin rebounded sharply, recovering the losses from March. And that bounce was helped by a softer tone on trade tensions from Trump and a rebound in the NASDAQ 100. Ethereum, however, is falling further behind. The divergence between Bitcoin and Ethereum is becoming more structural. This is likely driven by the difference in narrative clarity and institutional adoption. Institutions are piling into Bitcoin through ETFs, while Ethereum is not seeing the same dynamic and is lacking narrative momentum.
Right now, the Bitcoin ETFs are showing strong inflows, which continues to drive price action. At the same time, the NASDAQ 100 is attempting to reclaim its 200-day moving average, a potential signal that risk appetite is stabilizing.
We might be entering another positive phase, though the risk of policy-driven volatility remains high. As we noted in the Bitcoin Market Monitor, current ETF flows provide enough fuel for Bitcoin to push toward $100K.

ETFs and Public Companies Are Driving Structural Bitcoin Accumulation
The past year has marked a major leap in institutional adoption of Bitcoin.
The launch of spot Bitcoin ETFs in the U.S. opened the floodgates for capital from traditional finance. At the same time, we’ve seen a growing number of public companies adopt Bitcoin as a treasury asset.
These two sources of demand have developed in parallel.
On the ETF side, if we trace their history back to the Grayscale Bitcoin Trust (GBTC), it was the primary accumulation vehicle for nearly a decade. During the 2020–2021 bull market, GBTC saw a surge in inflows and played a major role in supporting prices.
Then came 2024. With the approval of spot ETFs, GBTC converted and new entrants like BlackRock and Fidelity joined the market. Within just one year, ETFs have accumulated 5.5% of the total Bitcoin supply.
The trend among public companies is similar. MicroStrategy led the way in 2020, and for years, it was effectively alone. That changed at the end of 2024. Now, a mix of Bitcoin mining companies and other public companies have joined in, turning what was once a solo effort into a broader, more sustained flow of demand.
For now, MicroStrategy still dominates public company holdings by a wide margin. But if this trend continues, public company adoption could become another long-term support for Bitcoin’s growth.

GDP Slipped, but Underlying U.S. Growth Remains Strong
The U.S. economy has been growing steadily for the past few years, low unemployment, solid consumer demand, and resilient business investment. So why did real GDP contract by 0.3% in Q1 2025?
Tariffs, or more precisely, the anticipation of tariffs.
As the Trump administration floated new trade restrictions, businesses rushed to front-load imports before they took effect. But because imports are subtracted from GDP, this surge mechanically dragged the number into negative territory.
That doesn’t mean the core of the U.S. economy is weakening.
When you strip out the trade noise and focus on internal activity, measured by Real Final Sales to Private Domestic Purchasers, Q1 growth was right in line with historical norms. This metric captures consumer spending, residential investment, and business investment. And it’s still solid.
In other words, this was a technical contraction, a temporary distortion, not a signal of economic trouble (at least for now). That’s why markets, including Bitcoin, have largely shrugged it off.
The bigger question is what happens next. As long as the economy stays strong, the Fed has little incentive to change course. It will likely wait to see how the actual implementation of tariffs affects inflation before adjusting policy. So overall the situation hasn’t changed much.

That's it for today. Thanks for reading.
Cheers,
Nick
P.S. Every week, our team conducts extensive research analyzing market data, tracking emerging trends, and creating professional-grade charts and analysis.
Our mission: Deliver actionable macro and Bitcoin insights that help institutional investors and financial advisors make better-informed decisions.
Ready for institutional-grade research that puts you ahead of the market? Click below to access our premium insights.


