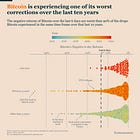
Bitcoin’s Performance Reshuffling
Also Beware of Correlations and are the Rate Cuts Useless?
Welcome to the Friday edition of the Ecoinometrics newsletter.
Every week we bring you the three most important charts on the topics of macroeconomics, Bitcoin and digital assets.
Today we'll cover:
Bitcoin’s Performance Reshuffling.
Beware of Correlations.
Are the Rate Cuts Useless?
Each topic comes with a small explanation and one big chart. So let’s dive in.
In case you missed it, here are the other topics we covered this week:
If you aren’t subscribed yet, hit the subscribe button, to receive this email every week directly in your inbox:
Bitcoin’s Performance Reshuffling
We recently witnessed an unwinding of the Yen carry trade and leveraged tech stock positions, which had widespread effects across markets. Bitcoin was not immune to this correction, experiencing a significant drop. At one point, the one-week decline ranked among the top 5% of corrections in the past decade.
Since then, Bitcoin has rebounded, as have most other assets. But did this correction reshuffle the performance rankings?
Not significantly. The chart below illustrates the year-to-date performance of major large-cap assets, broken down by month:
Nvidia remains the clear outlier, maintaining its position as the year's top performer by a wide margin.
Bitcoin continues to lead the rest of the large-cap pack, neck-and-neck with Meta.
Most other assets have maintained their relative positions.
Ethereum, however, was hit particularly hard by the correction and is struggling to recover.
In essence, this correction hasn't fundamentally altered market dynamics. We're likely to see more of the same trend continue. At least that’s if the US economy does not slide into a recession.
Beware of Correlations
In theory, improving risk-adjusted returns involves diversifying your portfolio with uncorrelated assets. This works because when one asset declines, others may rise or stay stable, potentially reducing overall portfolio volatility while maintaining returns.
But here's the catch. During exceptional events, typical correlations often break down.
We've seen this with:
The COVID-19 crash in 2020
The liquidity squeeze of 2022
Last week's market corrections
During these periods, we typically see:
Large market swings
Assets becoming either highly correlated or inversely correlated
Essentially, one dominant trade across the market
So when you need diversification most, your carefully balanced portfolio of typically non-correlated assets might behave quite differently than expected.
This highlights why it's important to understand the broader market drivers and study exceptional cases. While an uncorrelated portfolio is valuable during normal conditions, it's even more crucial to have a strategy for when the market hits turbulence.
The chart below shows Bitcoin's correlation with the NASDAQ and gold over the past year. Despite some fluctuations, Bitcoin has generally maintained low correlation with both assets, rarely exceeding 0.5 or falling below -0.5. This demonstrates Bitcoin's potential for portfolio diversification under normal circumstances. But remember these relationships can shift dramatically during market crises.
Are the Rate Cuts Useless?
Many investors have been eagerly anticipating rate cuts from the Federal Reserve for months. But will these cuts actually make a significant difference?
Hear me out.
The National Financial Conditions Index measures the overall tightness of financial conditions in the US economy. Looking at this index, we can see that financial conditions tightened considerably in 2022 when the Federal Reserve implemented its rate hike sequence.
However, since the Fed Funds rates peaked, financial conditions have been steadily loosening. In fact, they've continued to ease to the point where they're now as loose as they were before the Fed started hiking rates.
This raises an important question: If financial conditions are already this relaxed, how much impact can a 25 basis point cut really have on the market? To see substantial effects, we might need much more aggressive cuts. Unless we enter a recession, it's unlikely that such dramatic action is part of the Federal Reserve's current plan.
That’s it for today. I hope you enjoyed this. We’ll be back next week with more charts.
Cheers,
Nick
P.S. We spend the entire week, countless hours really, doing research, exploring data, surveying emerging trends, looking at charts and making infographics.
Our objective? Deliver to you the most important insights in macroeconomics, Bitcoin and digital assets.
Armed with those insights you can make better investment decisions.
Are you a serious investor? Do you want to get the big picture to get on the big trades? Then click on the button below.


