
Bitcoin’s Price Weakness Is Affecting ETF Flows
Also A Repeat of February’s Drawdown & Downside Bias

Welcome to Ecoinometrics’ Friday edition.
Each week, we analyze the three most critical market signals impacting Bitcoin and macro assets, delivering institutional-grade insights through data-driven charts and analysis.
Today we’ll cover:
Bitcoin’s Price Weakness Is Affecting ETF Flows
A Repeat of February’s Drawdown
Downside Bias
Taken together, these signals describe a market in transition. Institutional flows are turning cautious, the price pattern echoes earlier corrections, and rising equity volatility continues to weigh on sentiment. The next few weeks will reveal whether this remains a mid-cycle pullback or evolves into something deeper.
In case you missed it, here are the other topics we covered this week:


Bitcoin Market Monitor - Key Drivers in Ten Charts:

Get these professional-grade insights delivered to your inbox:
Bitcoin’s Price Weakness Is Affecting ETF Flows
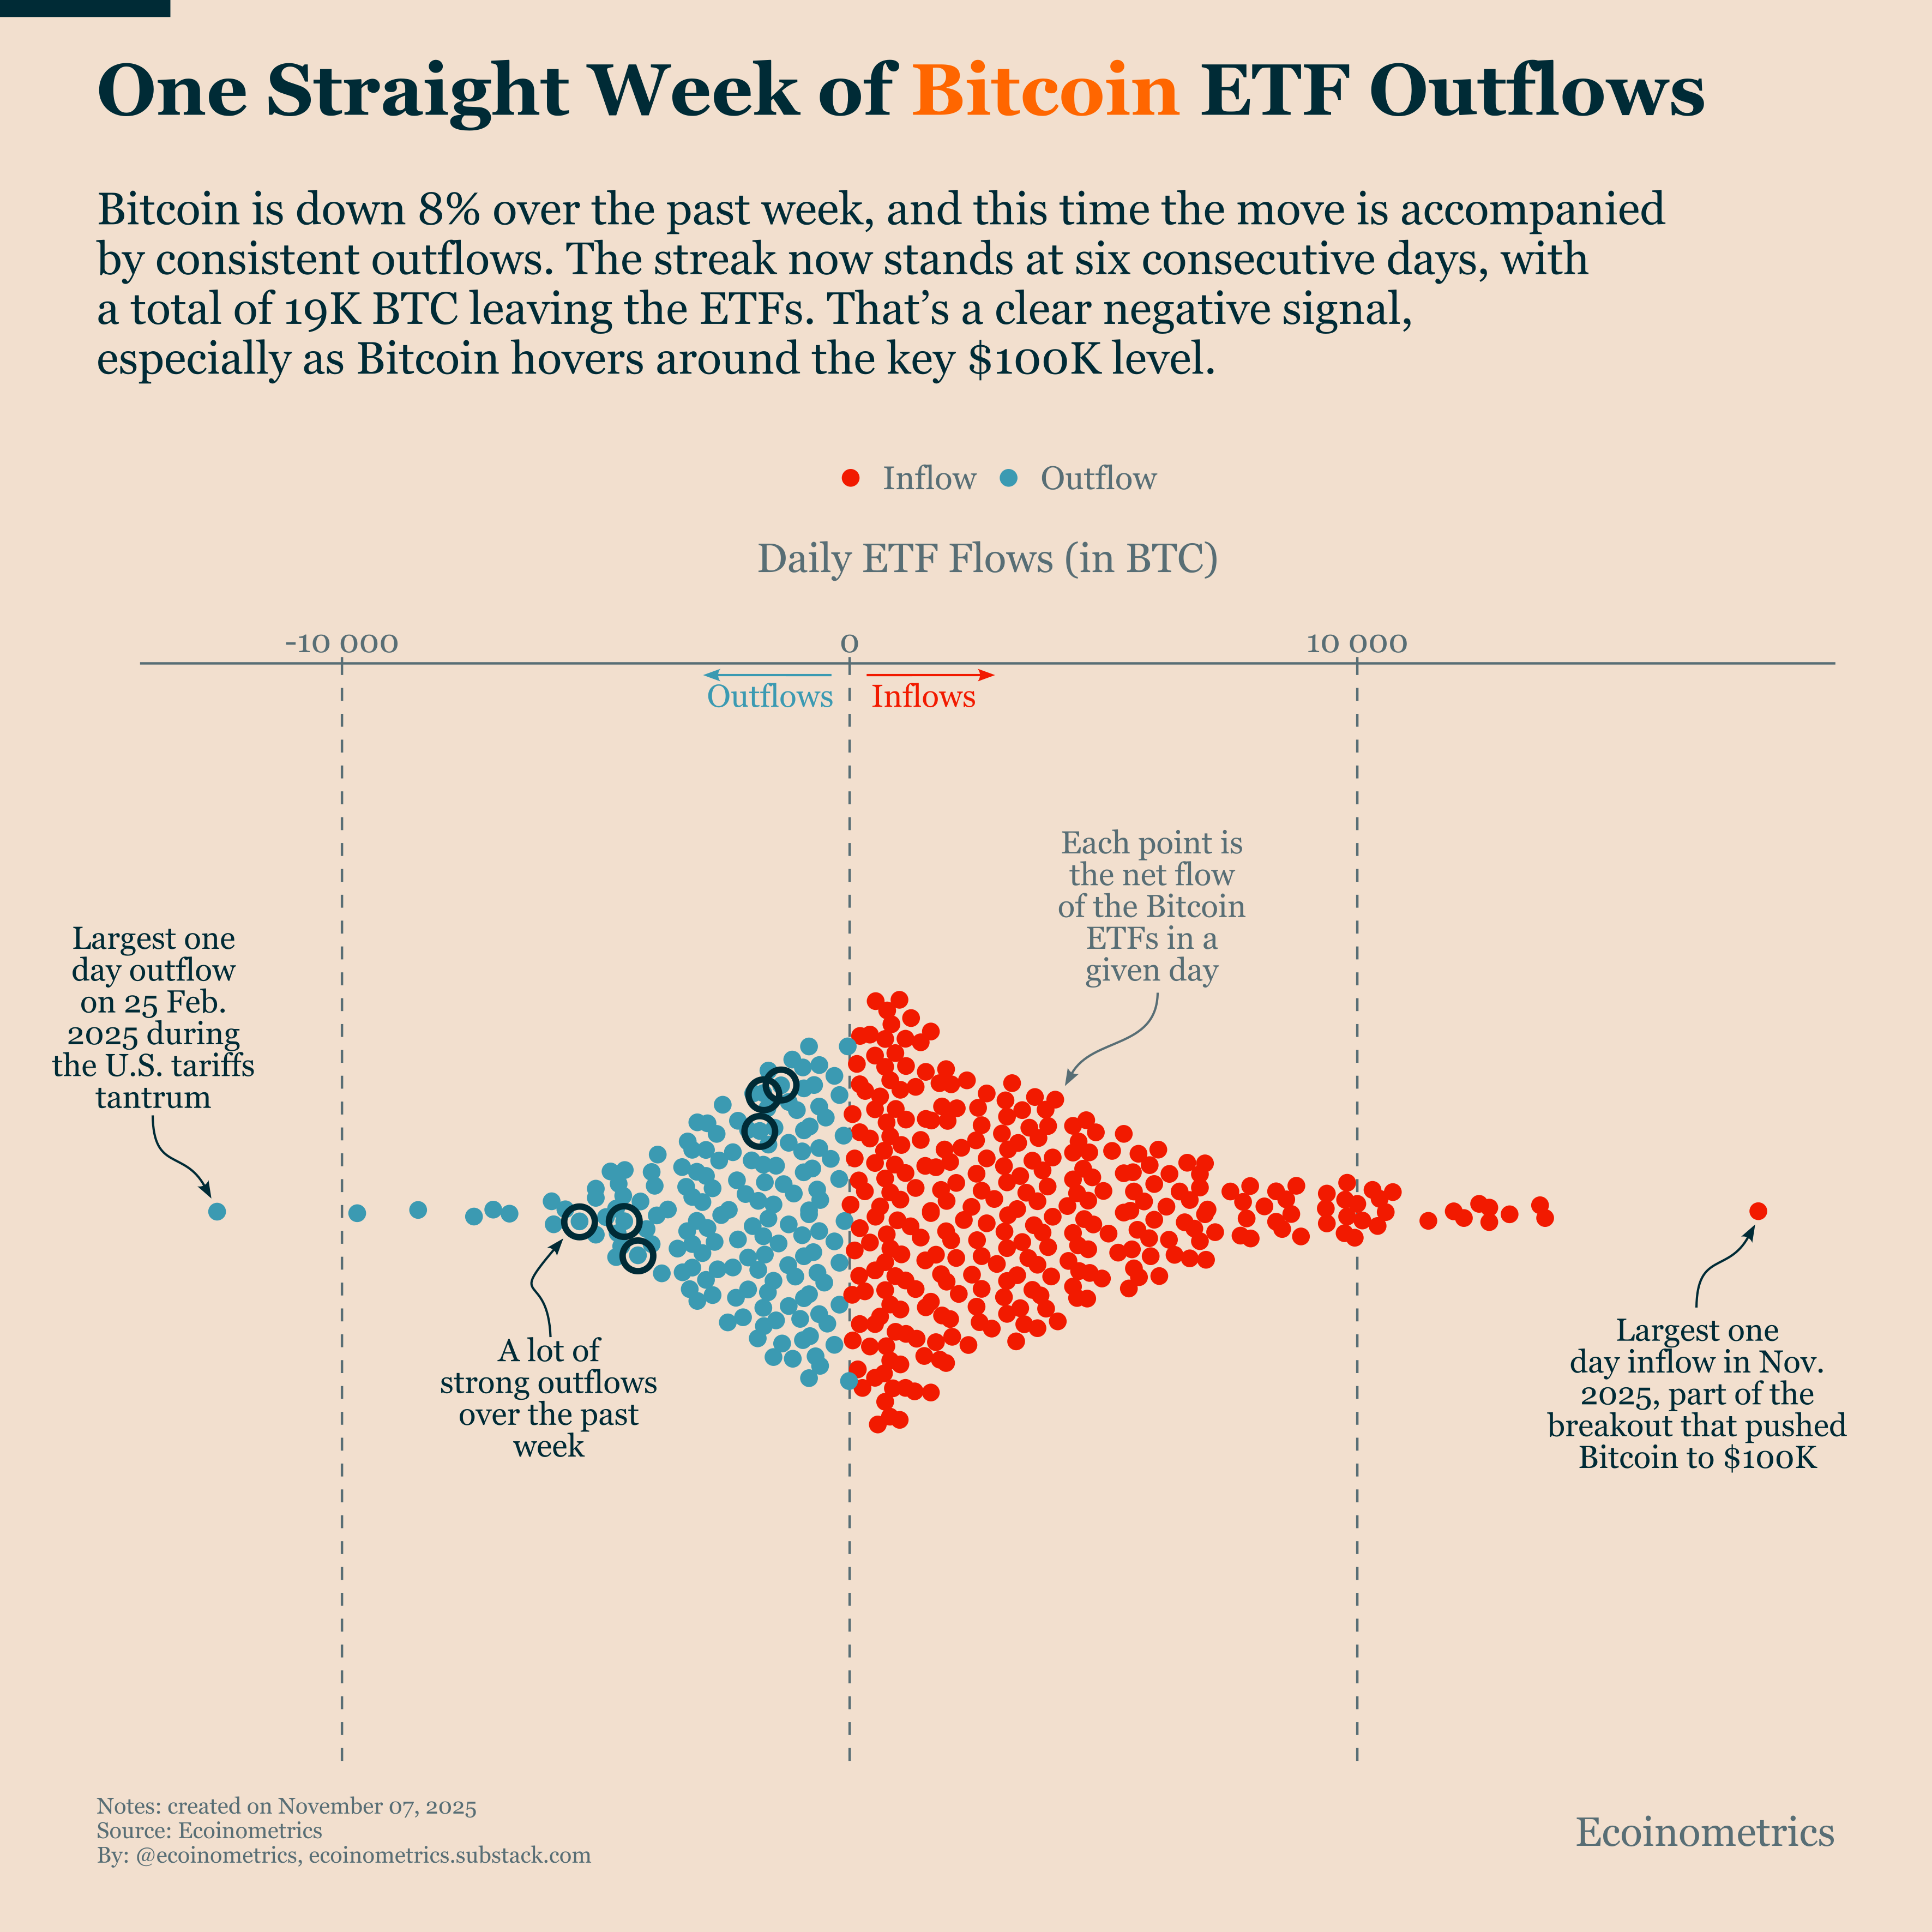
For most of October, Bitcoin traded quietly around $110K while ETF flows stayed positive and steady. That was a good sign, institutions weren’t selling even as price momentum faded.
But over the past week, that dynamic has flipped.
The chart below shows the distribution of daily Bitcoin ETF flows since launch. The last six days (circled) are outflows and half of them are large. This is the first time we’ve seen sustained redemptions in a while, signalling a change in investor behaviour.
As price weakness sets in, ETF holders are beginning to redeem shares, creating a feedback loop: selling drives redemptions, and redemptions drive more selling. That’s the risk we highlighted in this month’s ETF Flows Report, where our simulations model tilt towards negative flows.
So far, the data are tracking closer to the bearish scenarios in those simulations. The question now is how far this pattern extends:
Rolling 30-day net flows are around –700 BTC.
The bearish scenario points to 44K BTC of outflows by December 1.
The neutral scenario has flows roughly flat by that date.
The next few sessions will be key. If flows turn positive again near the $100K level, it would suggest institutional buyers are still willing to defend that price zone. But if redemptions persist, our model hints at Bitcoin’s only stabilizing between $80K and $95K.
A Repeat of February’s Drawdown
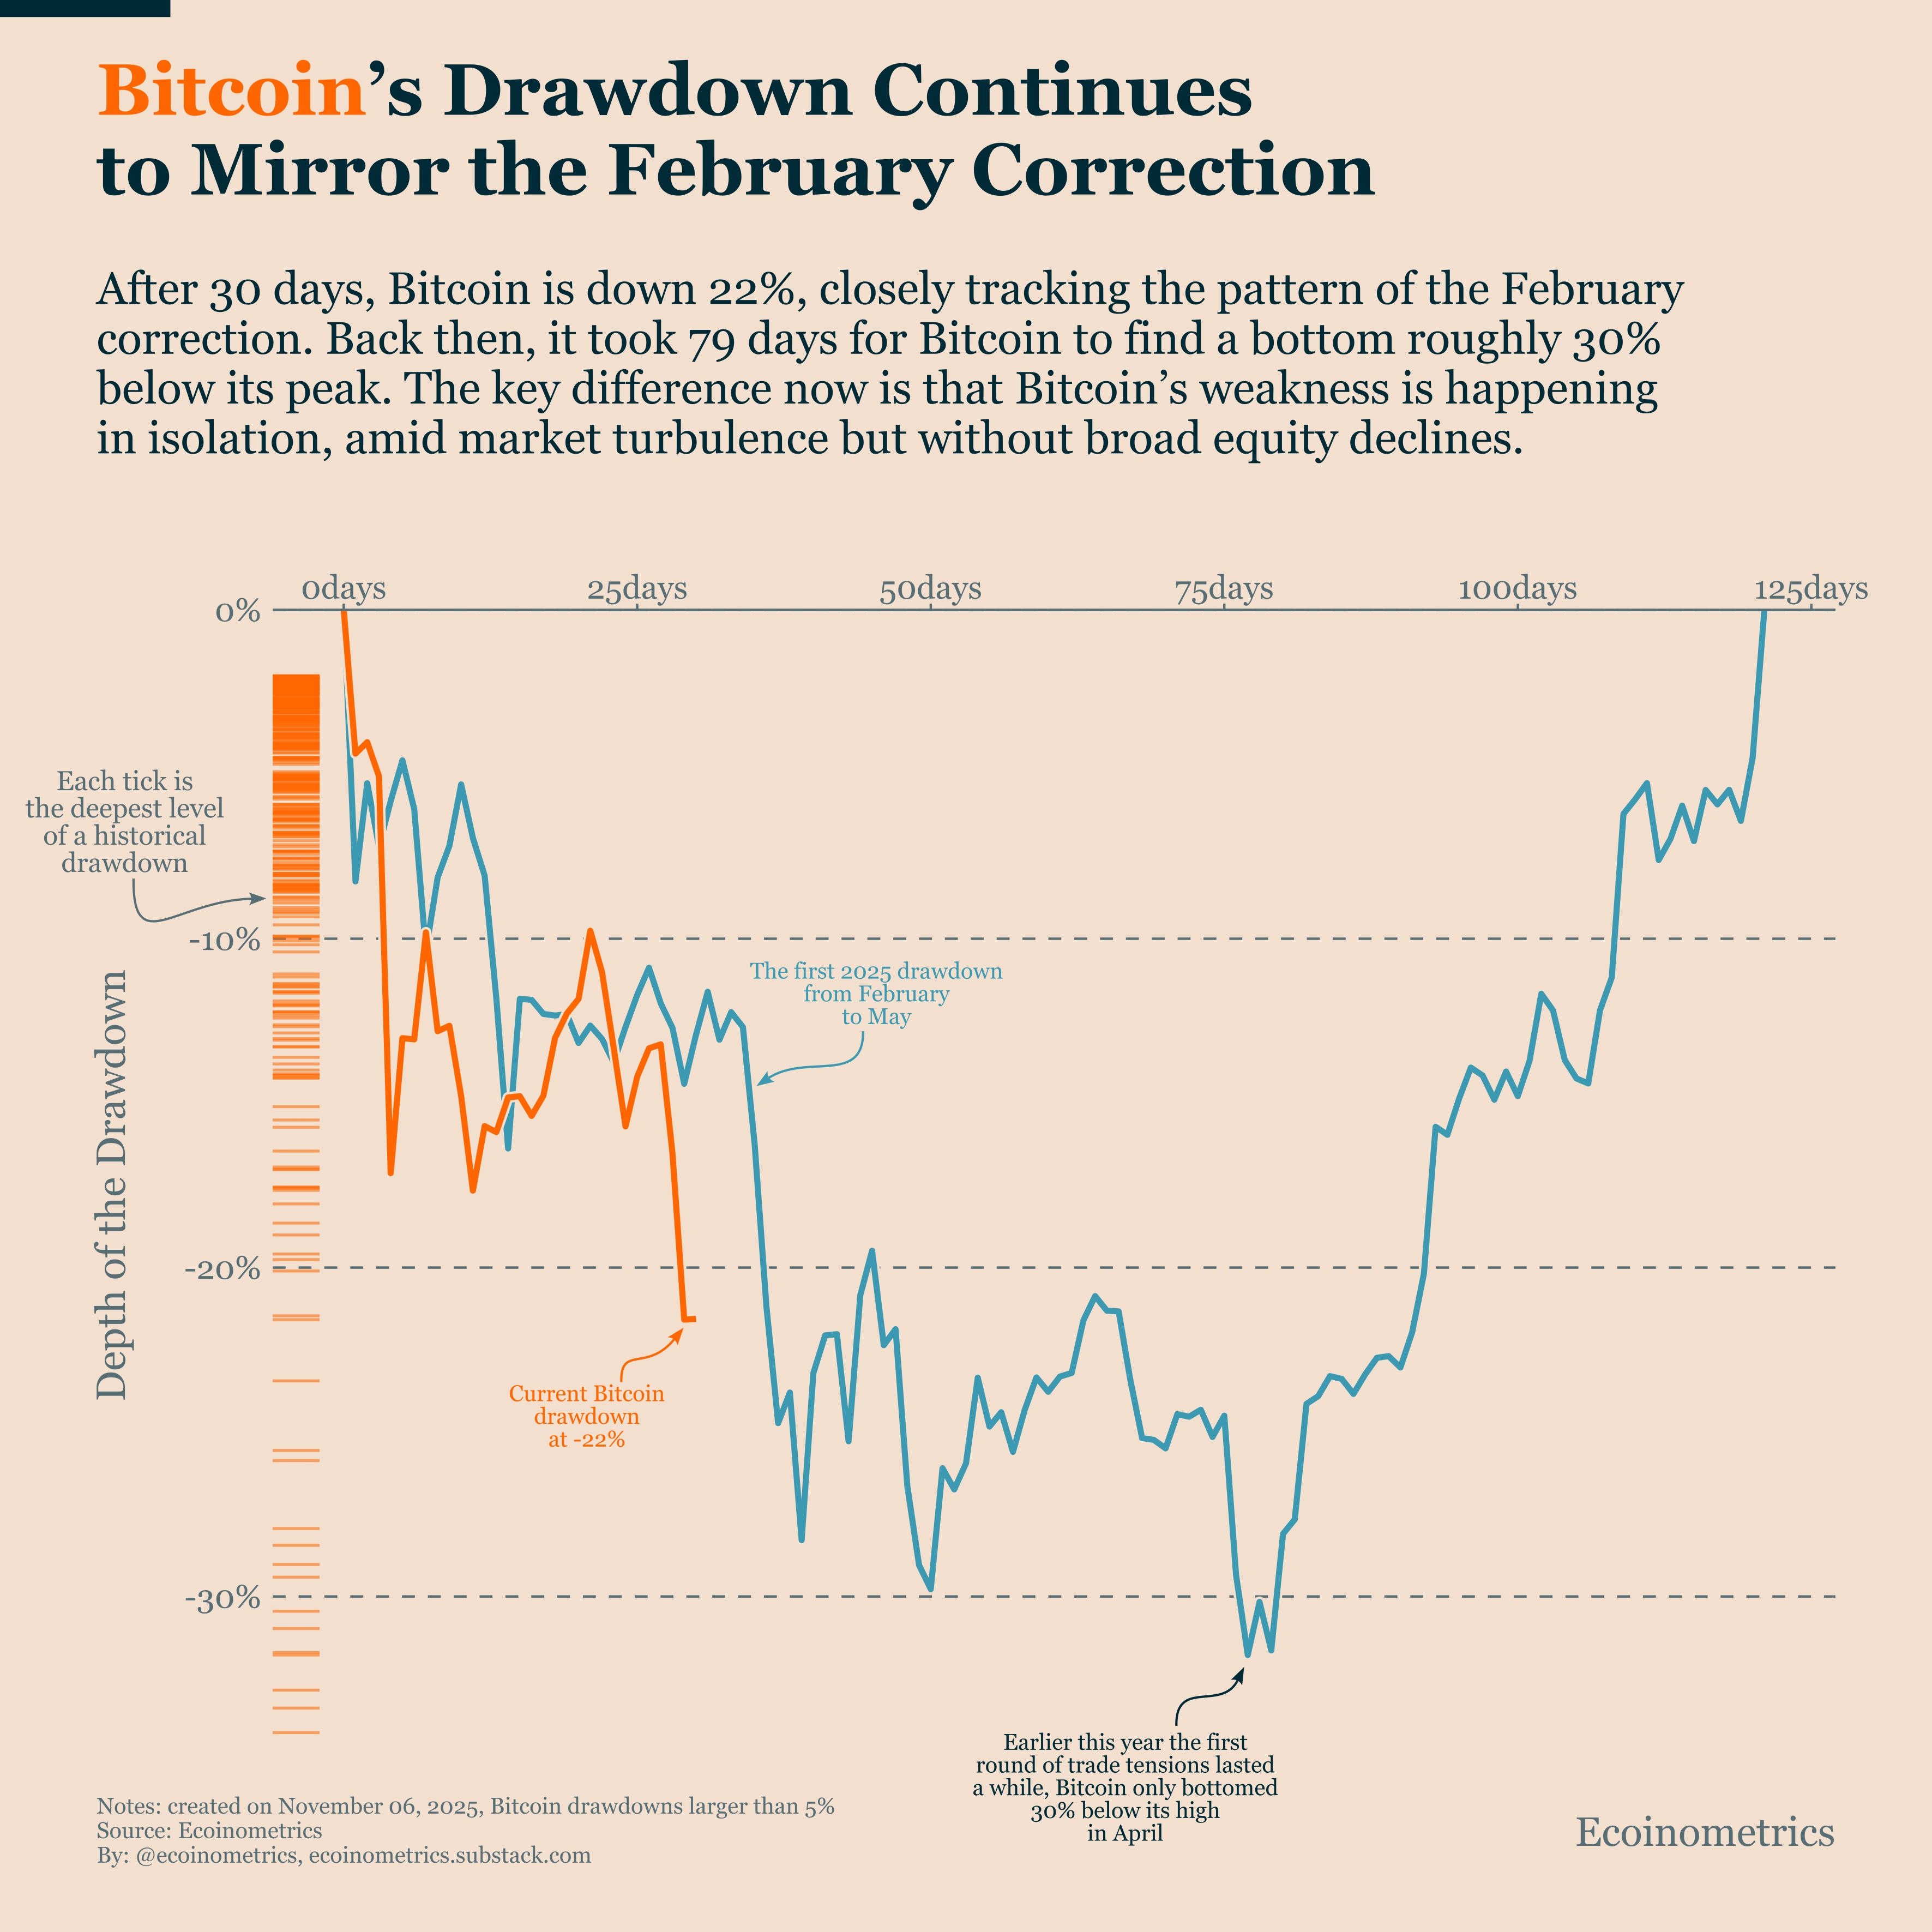
Bitcoin is down about 22% after just over a month in drawdown, and the pattern looks strikingly similar to the correction we saw from February to May. Back then, it took 79 days for Bitcoin to bottom roughly 30% below its peak and the path there included multiple sharp dips tied to U.S. tariff headlines.
This time, history seems to be rhyming.
But there’s one crucial difference. The February drawdown unfolded while the Nasdaq 100 and other risk-on assets were also sliding. In contrast, today’s pullback is happening without stocks being also in a deep drawdown. The Nasdaq is down about 4% from its new high, a new high that it made while Bitcoin was sliding.
Bitcoin is lagging, it is failing to capture the upside in risk assets while still reacting to downside volatility. In other words, the market turbulence is asymmetric: Bitcoin takes the hit on bad days but doesn’t benefit on good ones.
A calmer backdrop could help. Less fear, the end of the U.S. government shutdown, and a return to regular economic data releases might give Bitcoin the breathing room it needs to find support and rebuild from there.
And as we noted in Monday’s edition, the macro setup still doesn’t resemble the conditions that marked the start of past Bitcoin bear markets.
Downside Bias
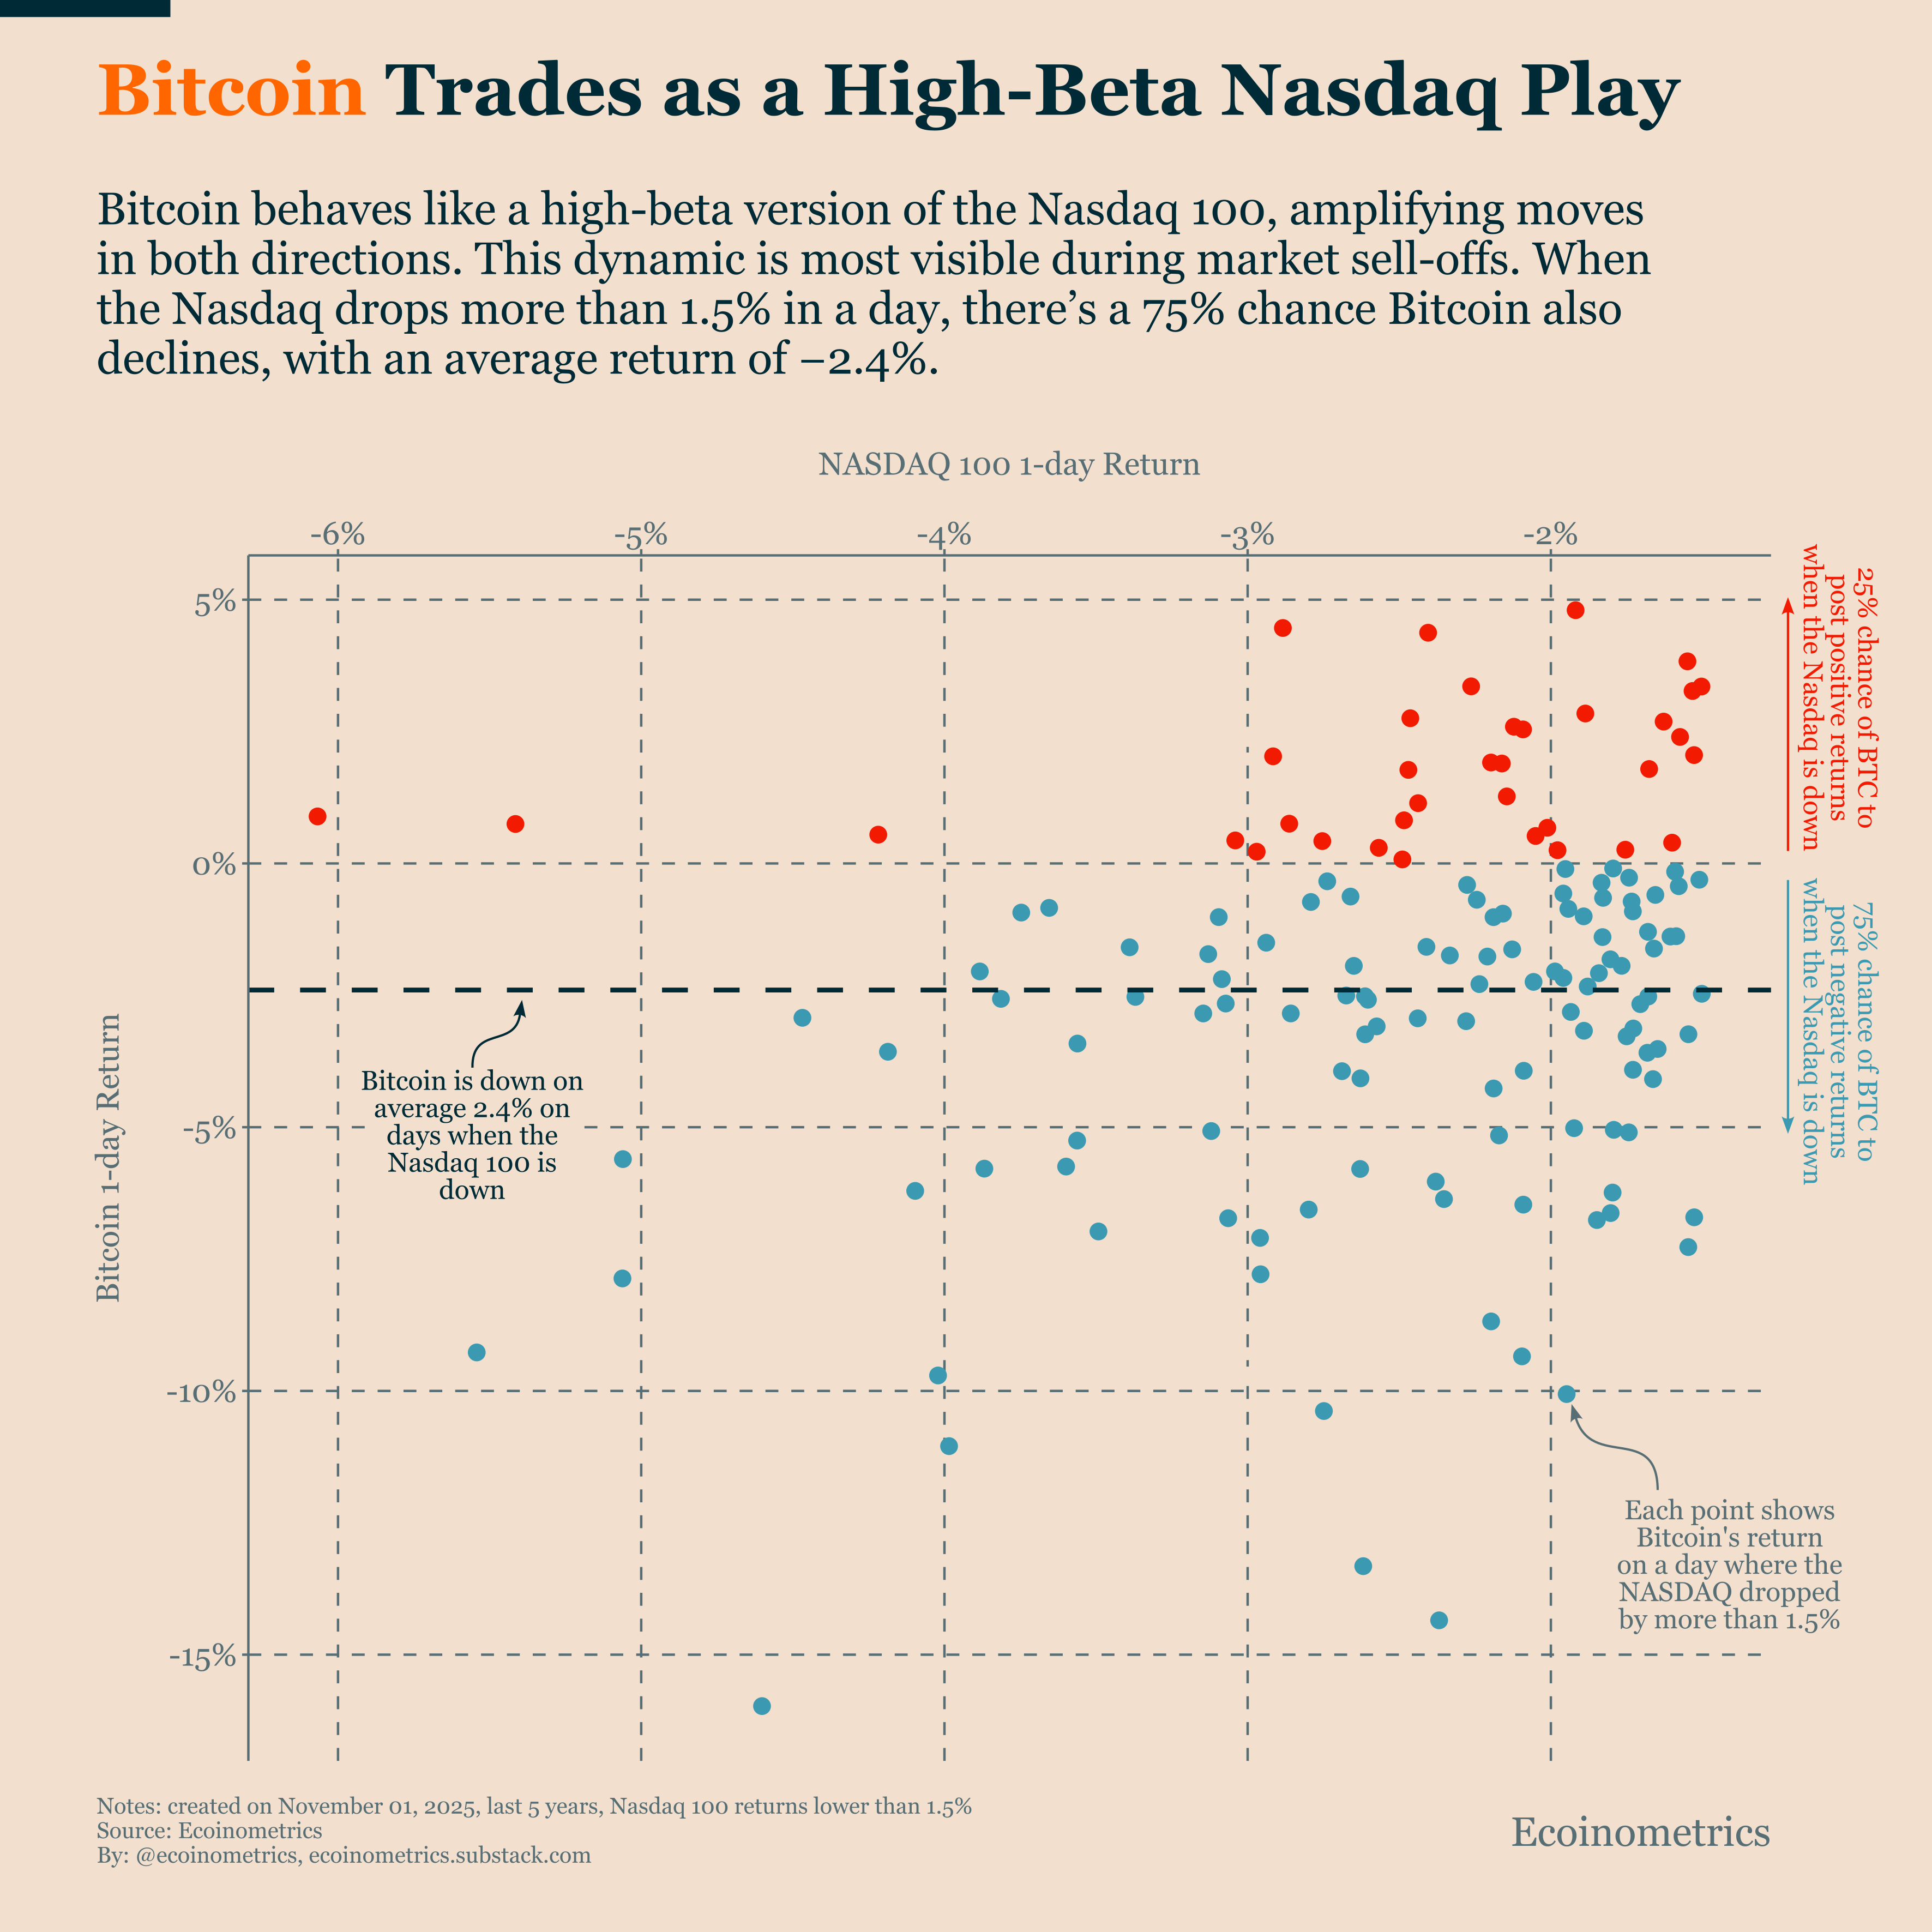
To understand why volatility in U.S. equities spills over to Bitcoin, it helps to remember that Bitcoin behaves like a high-beta version of the Nasdaq 100. The two assets move together most of the time, but the relationship becomes especially tight during market sell-offs.
When the Nasdaq drops more than 1.5% in a single day, there’s a 75% chance Bitcoin also declines and on those days, its average loss is around 2.4%. In other words, Bitcoin amplifies equity moves, particularly on the downside.
That means periods of heightened equity volatility are usually bad news for Bitcoin. Big swings in the Nasdaq, whether triggered by macro headlines, earnings shocks, or geopolitical events tend to drag Bitcoin lower even when the news has nothing to do with crypto.
This is what it means for Bitcoin to trade as part of the risk-on complex.
Less turbulence in U.S. equities, not necessarily better crypto fundamentals, would help Bitcoin stabilize in the near term. The takeaway for investors is that short-term Bitcoin volatility often reflects cross-asset sentiment rather than on-chain fundamentals. Until the current correlation regime breaks, equity market calm is Bitcoin’s best friend.
That’s it for today. Thanks for reading.
Cheers,
Nick
P.S. Every week, our team conducts extensive research analyzing market data, tracking emerging trends, and creating professional-grade charts and analysis.
Our mission: Deliver actionable macro and Bitcoin insights that help institutional investors and financial advisors make better-informed decisions.
Ready for institutional-grade research that puts you ahead of the market? Click below to access our premium insights.