

Ecoinometrics - Coinbase's performance
Ecoinometrics - Coinbase's performance
July 26, 2021

It might feel like a lifetime but Coinbase’s direct listing was only three months ago. The date of the listing itself was great if you were one of those selling the stock.
For the rest of us, well… it has been a rough ride. So where are we now?
The Ecoinometrics newsletter decrypts Bitcoin’s place in the global financial system. If you want to get an edge in understanding the future of finance you only have to do one thing, click on the subscribe button right below:
Done? Thanks! That’s great! Now let’s dive in.
Coinbase’s performance
Do you remember the day of Coinbase’s direct listing?
I do: April 14, 2021.
And you know what happened on that day?
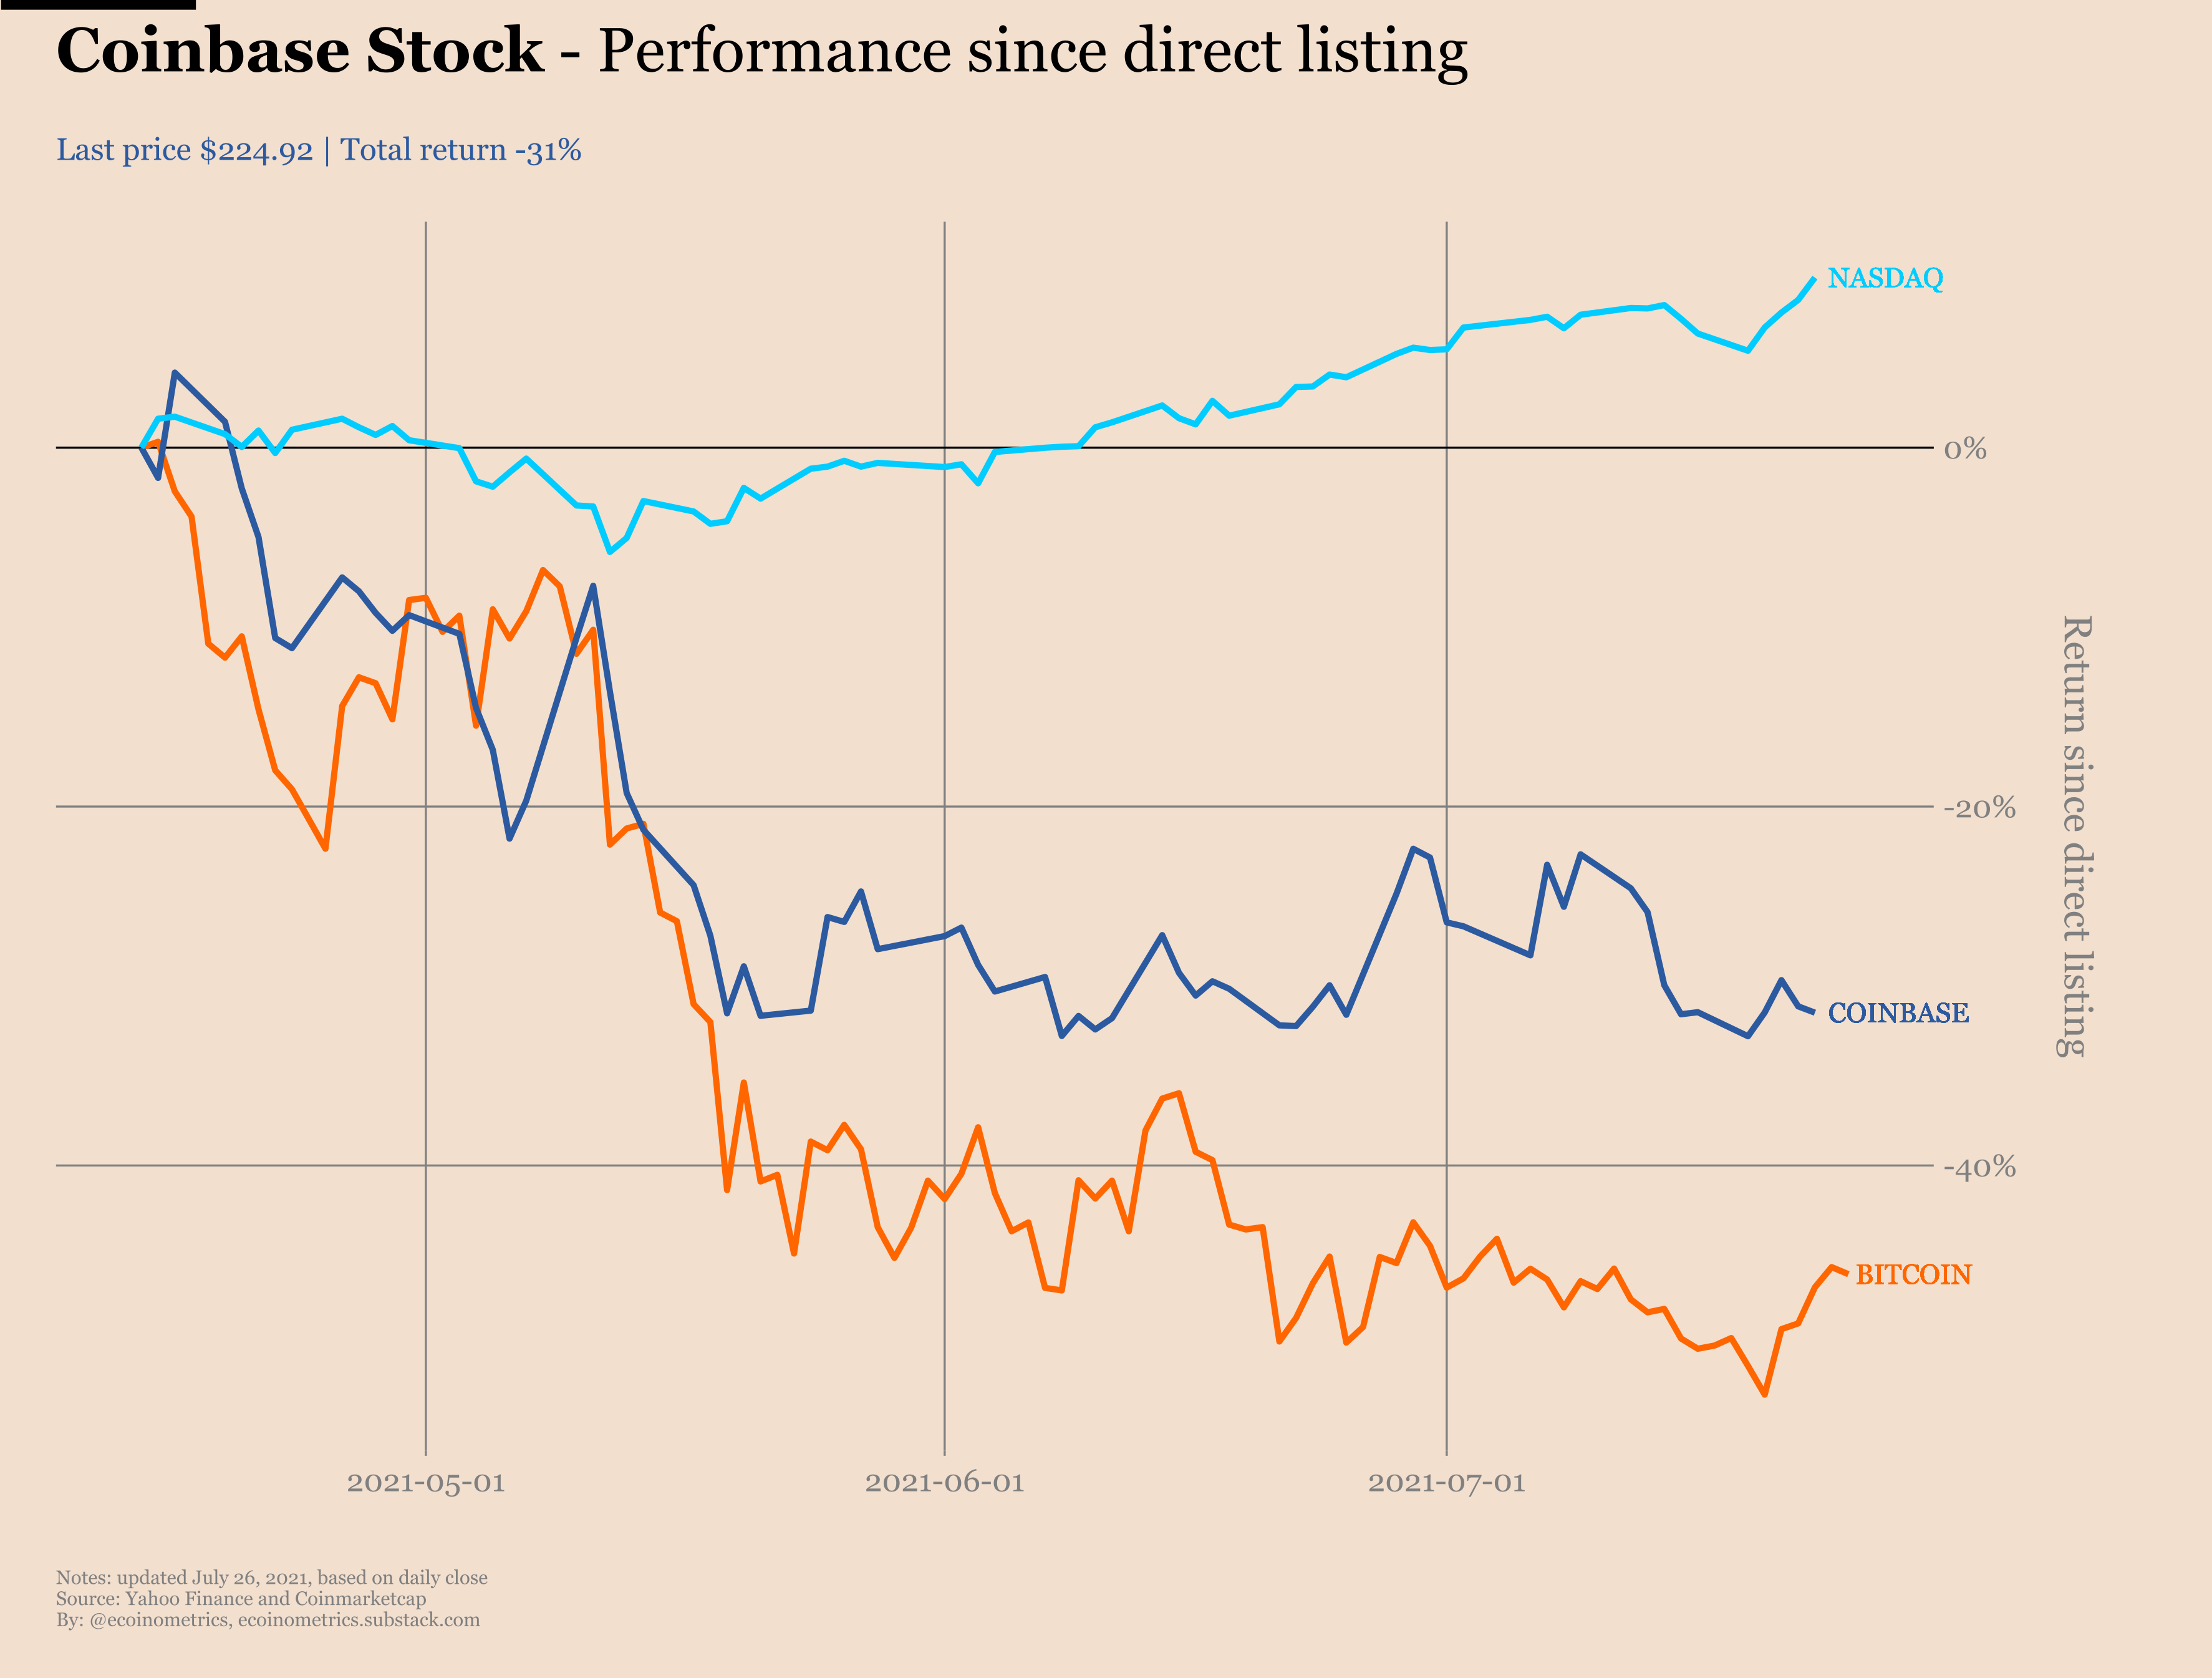
Bitcoin reached its all-time high somewhere near $64,900 per coin. It also happens to coincide with COIN reaching its all-time high at $429 per share.
It has all been downhill from there.
Bitcoin has been stuck in a massive drawdown for more than 3 months with a bottom -55% below its all-time high. Same thing for Coinbase with a drawdown -52% below the all-time high of its first trading day.
Overall COIN is -31% below its IPO price but at least things have stabilized for now.
Clearly the situation isn’t great, but it turns out Coinbase isn’t the worst performing asset from the Bitcoin Treasuries Index over the same period.
Take a look.
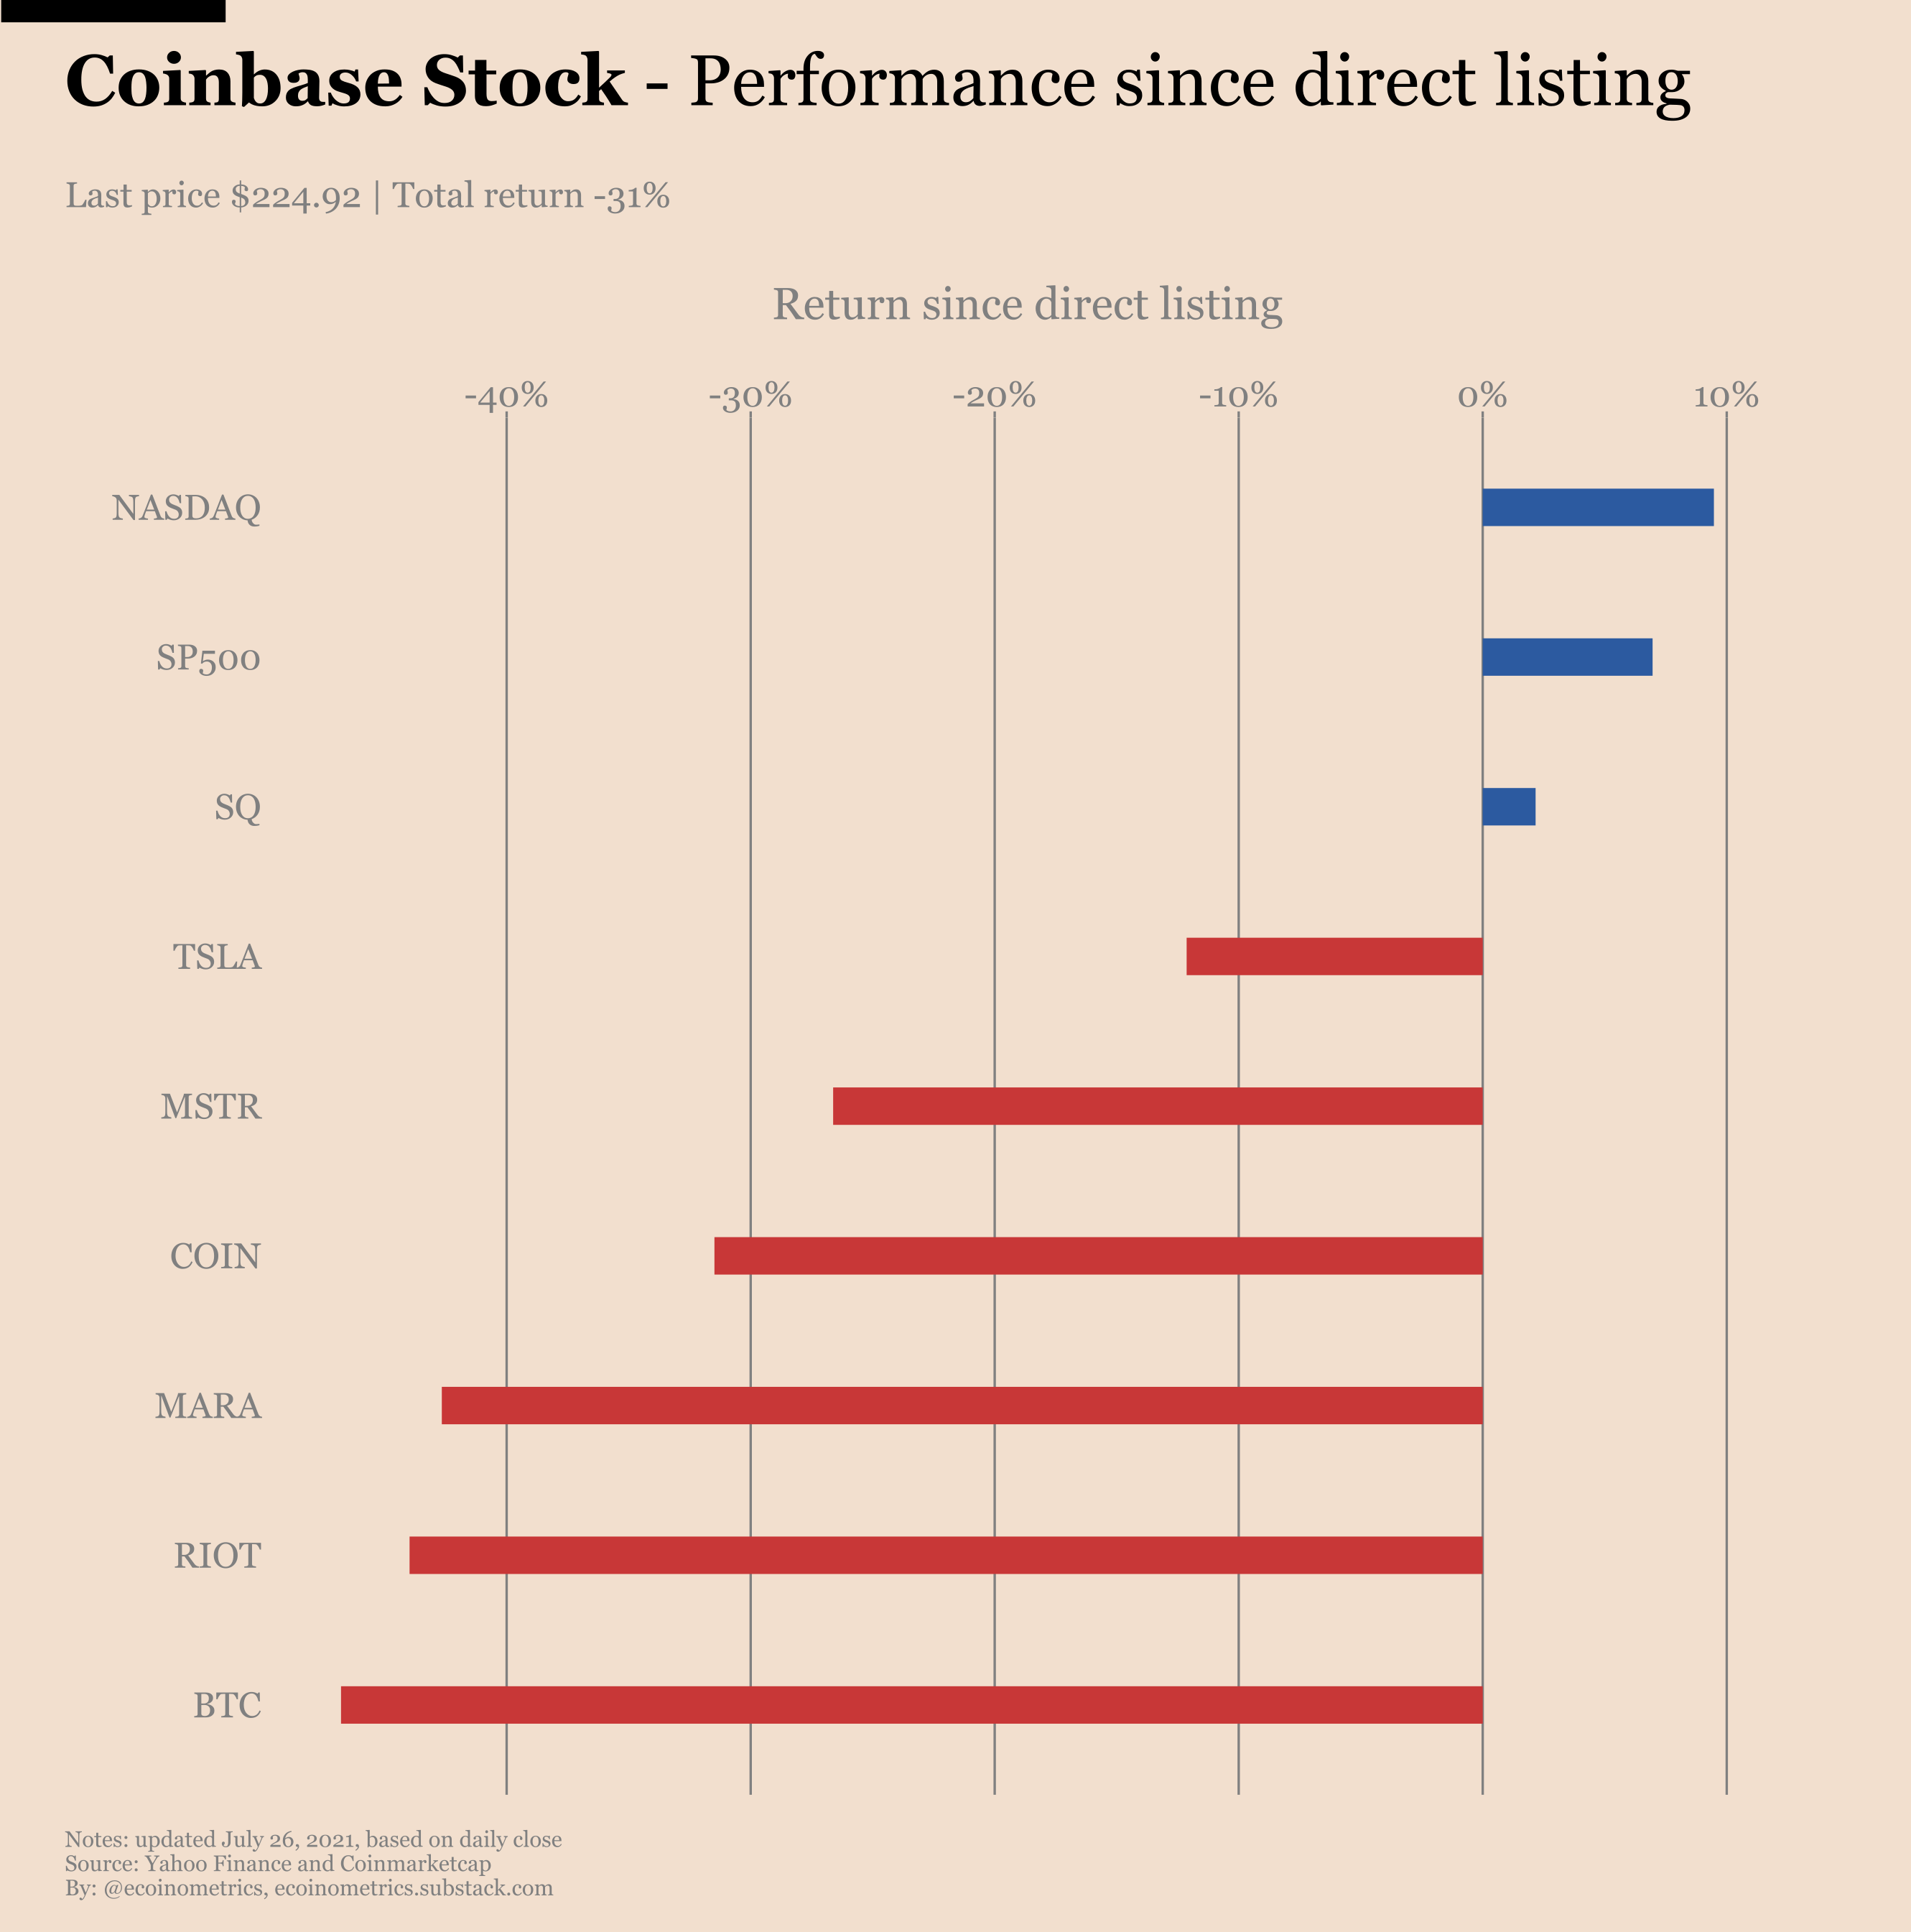
Some miners have dropped significantly more since the Coinbase IPO. But that’s not the most interesting thing to me.
Checkout MicroStrategy. I mean maybe you won’t see that as a significant difference, but MSTR is down less than Coinbase since April 14.
If you had asked me to guess which stock would have been hit harder by the Bitcoin drop I would have said:
First, MicroStrategy. After all MSTR is a pseudo-ETF for Bitcoin, so it might have been the closest in tracking BTC.
Second, the miners such as MARA, RIOT or HUT8. Those tend to be smaller stocks and potentially more volatile. Plus their revenue is directly tied to the valuation of Bitcoin itself.
Third, Coinbase.
Why third? Because Coinbase revenues are tied to Bitcoin in a very different way.
Yes, Coinbase holds some BTC (around 4,500). But they are an exchange. That means their business model is that of a casino. You are betting on your favourite digital assets and Coinbase is there to take a cut.
How much Bitcoin is worth isn’t the thing that influences their revenues the most. What really matters to them is how much trading volume is going through their platform.
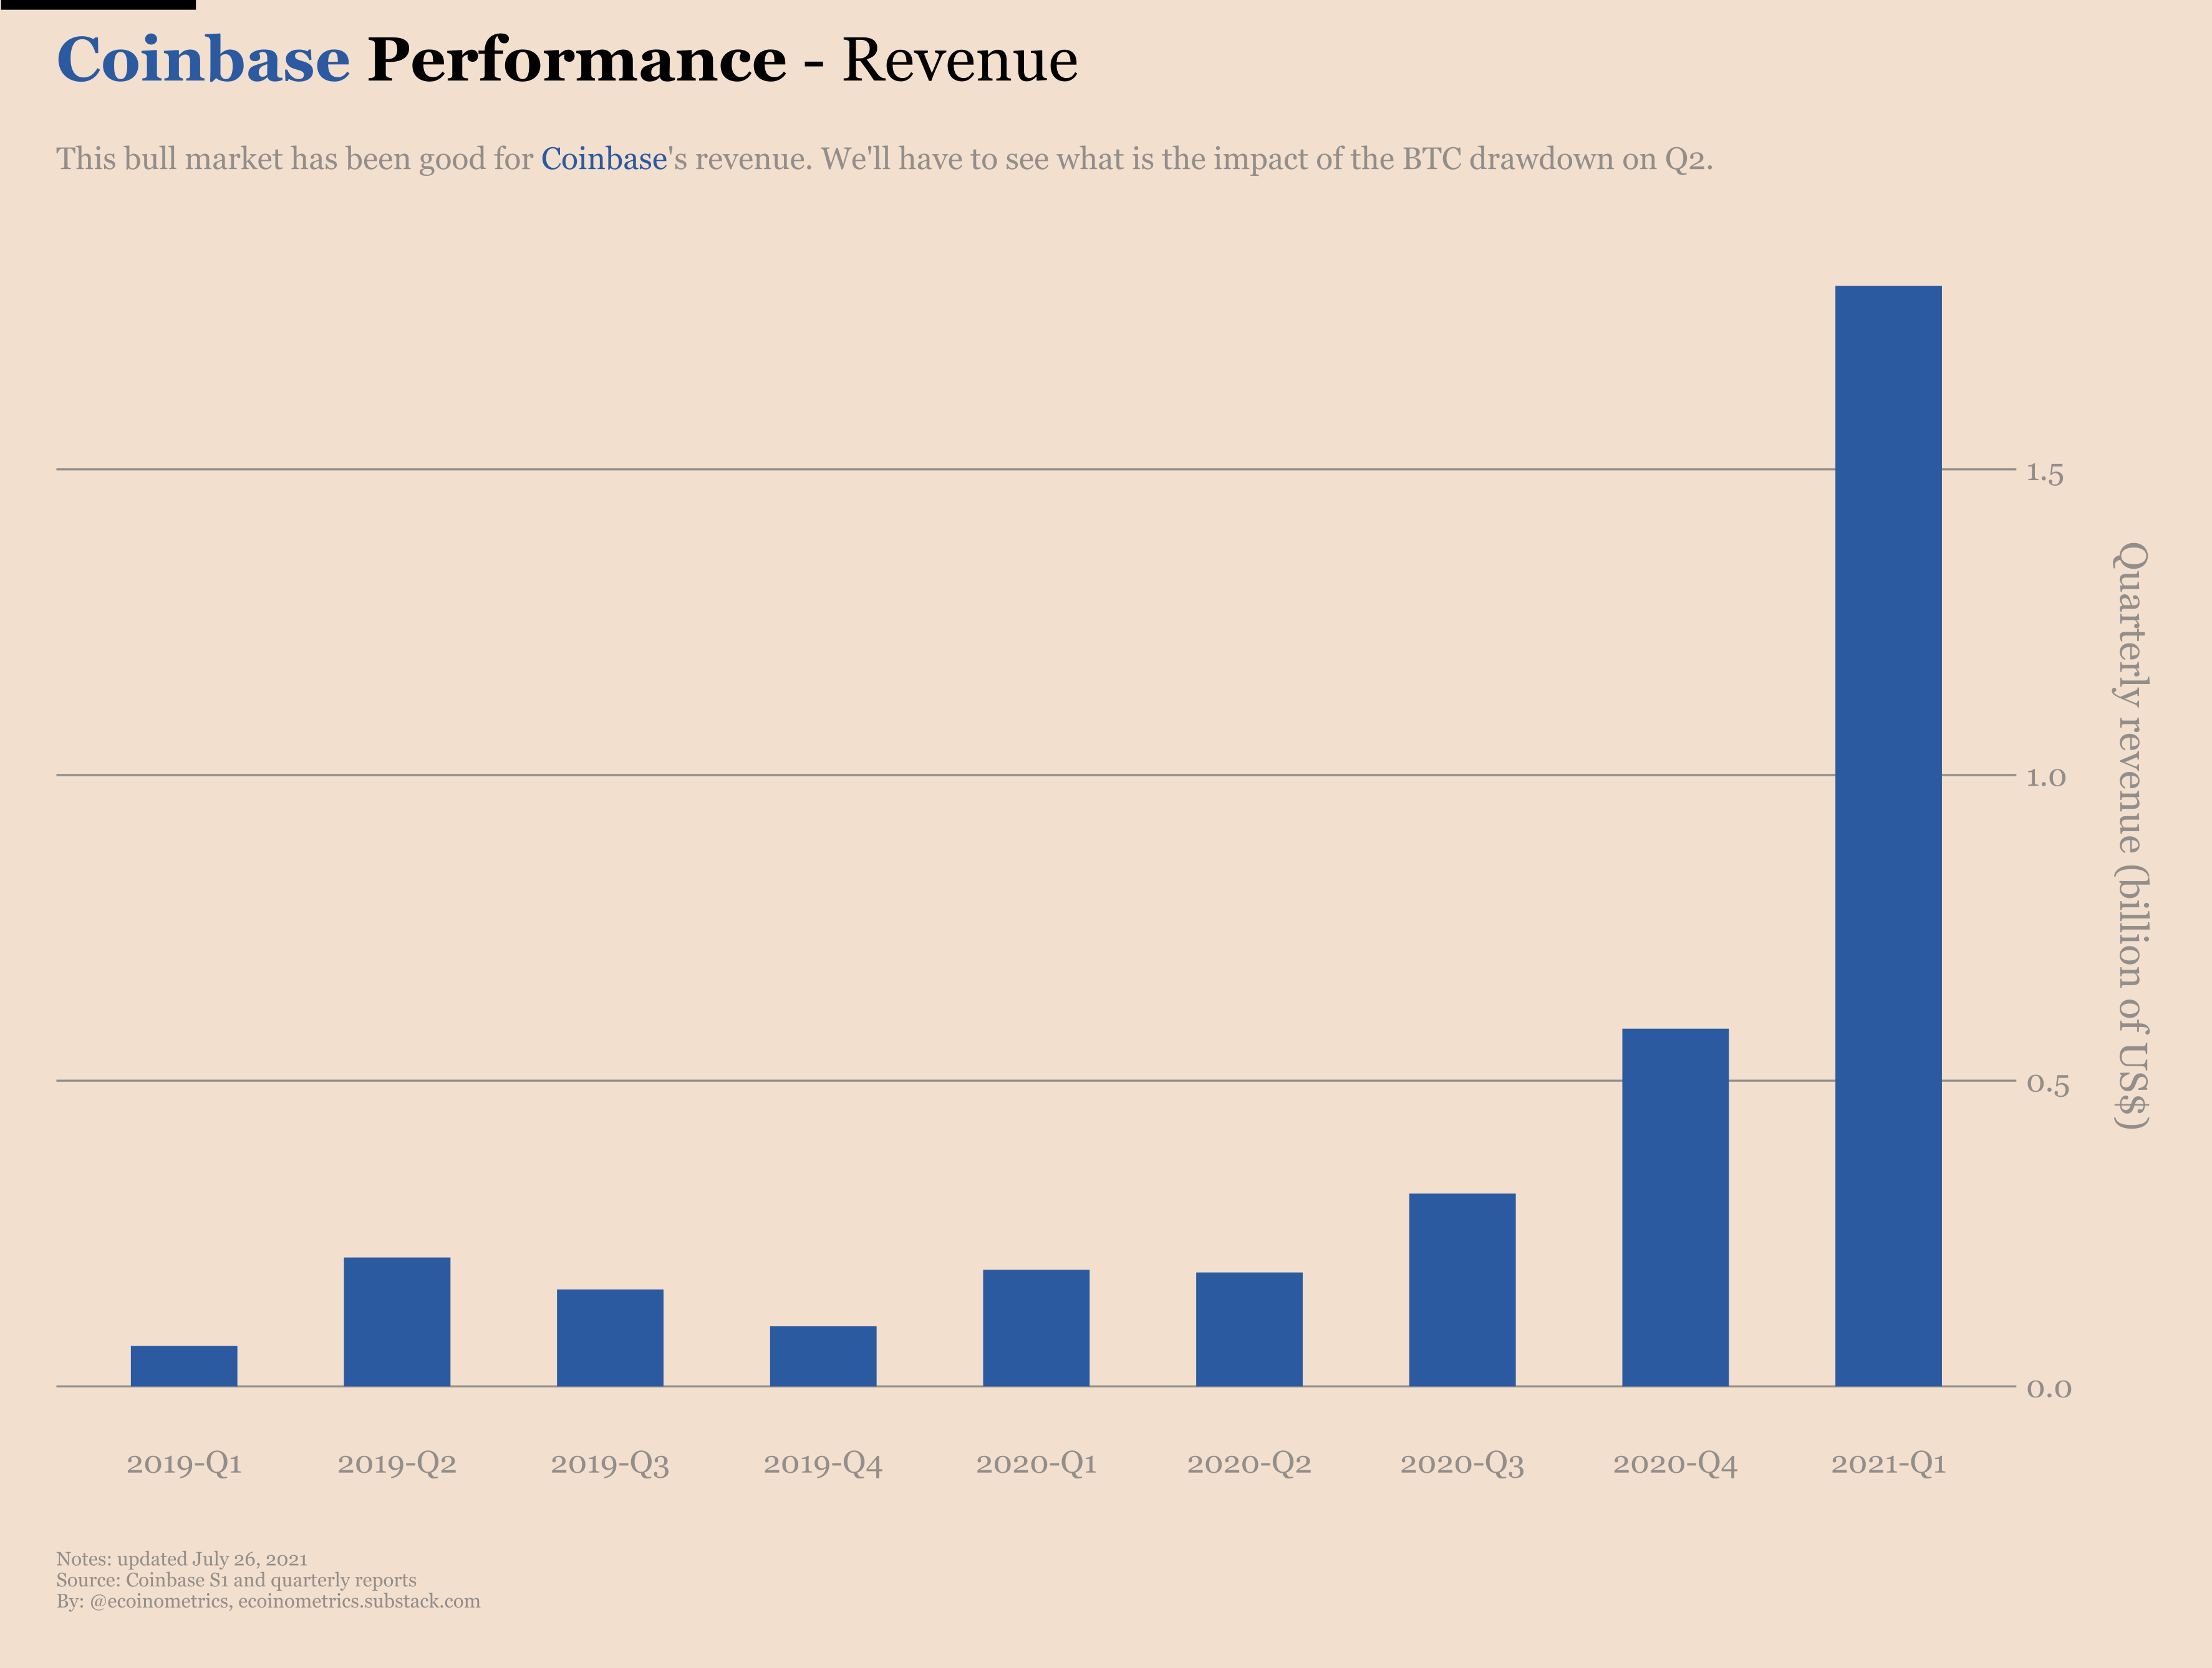
And the formula is pretty simple. According to the financial data released in their S1, Coinbase keeps about 0.7% of the traded volume as revenue.
That means every time Coinbase is processing roughly $150 billion of volume, they make $1 billion in revenue.
With the surge in volume during the first quarter of this year, you can imagine they did pretty well.
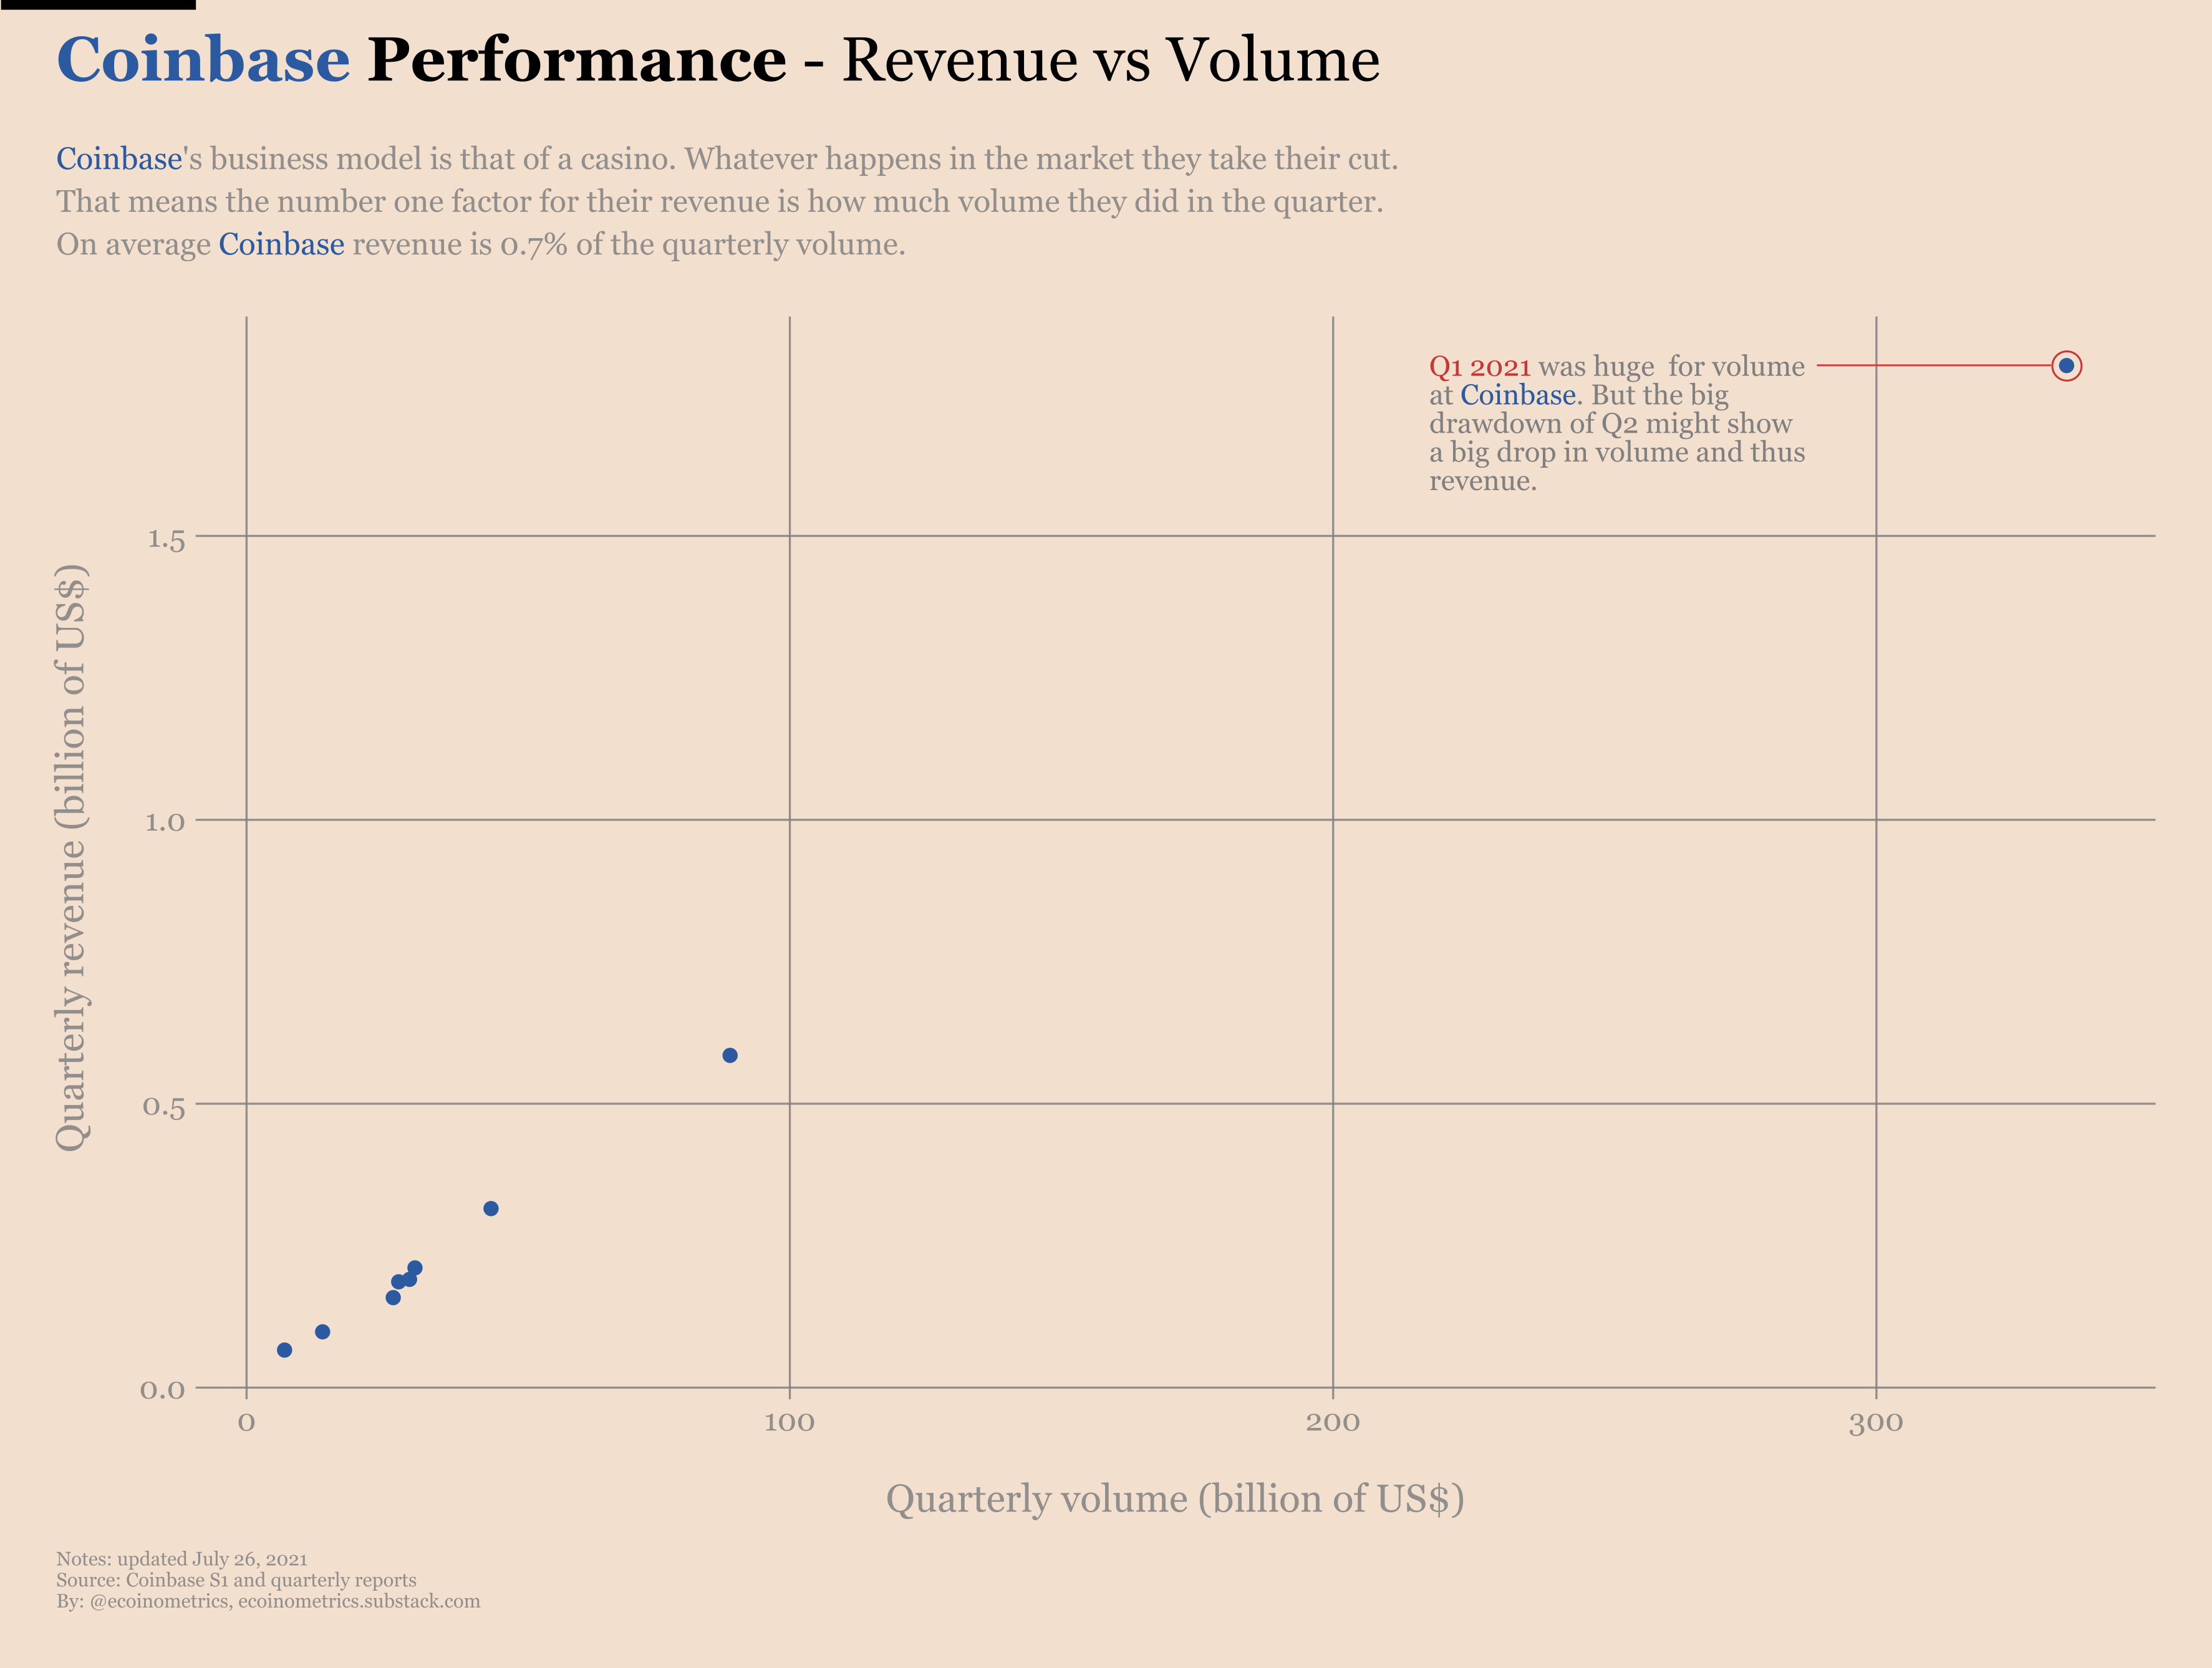
So the price of Bitcoin isn’t directly influencing Coinbase’s performance. How much trading activity happens in any given quarter is what really matters.
The big question then is how much the drawdown is affecting the trading volume seen by Coinbase?
My thinking is: not that much because of volatility!
Full disclosure, I have not made any analysis of the correlation between trading activity and volatility. But my guess is that everything else being equal, the more volatility, the more traded volume in the exchanges.
I don’t think the market composition is much different between Q1 and Q2 this year. And at the same time BTC is in the same order of magnitude in terms of price.
So the hypothesis of everything else being equal in the last two quarters is reasonable.
Let’s take a look at the volatility then.
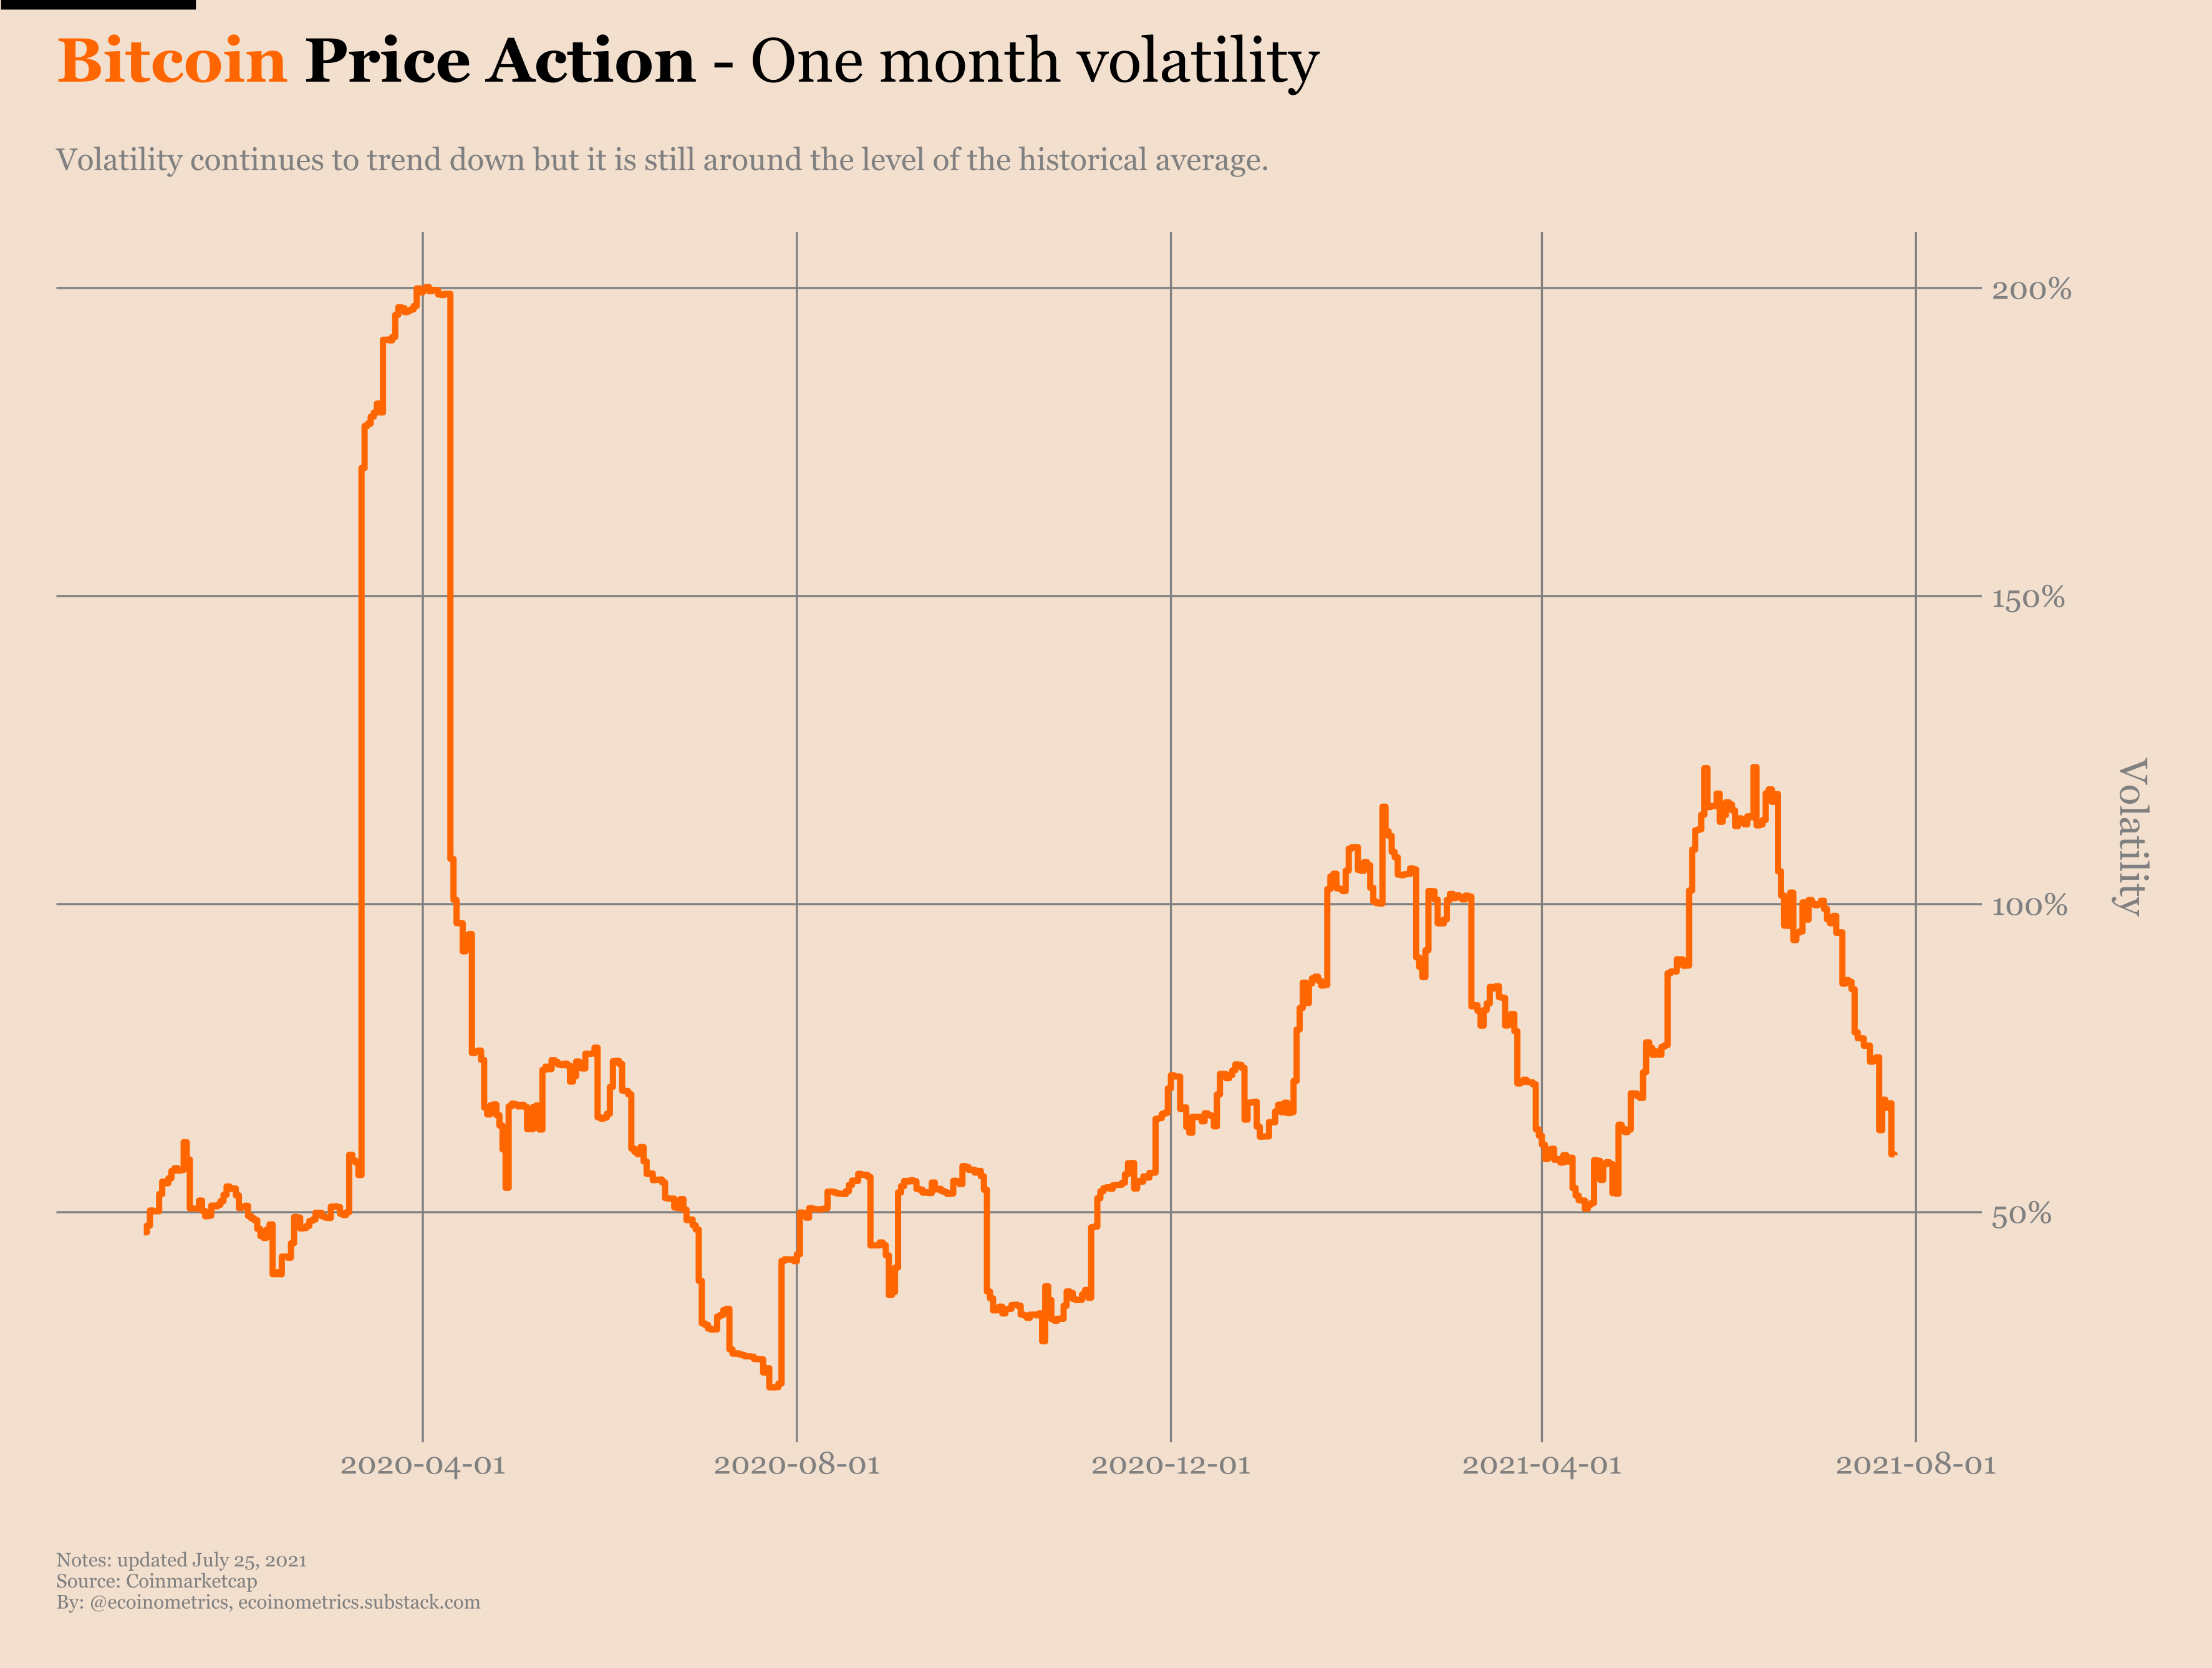
Well the volatility seems to also be in the same range for the past two quarters.
Conclusion: it is reasonable to expect that Coinbase has seen a similar amount of volume in Q1 and Q2 which should translate to similar revenues.
So if you judge Coinbase’s value based on what matters, i.e. its revenue, there is no reason for COIN to be cheaper just because Bitcoin’s value dropped.
Thus if Coinbase is showing solid revenue in their next quarterly report at the same time as Bitcoin is recovering we could see COIN’s price take off or at least catch up to its direct listing level.
Coinbase will announce their financial results for the second quarter of 2021 on August 10 so we’ll take a look at this again in a few weeks.
Bottoming hash rate
It seems nobody cares about this story anymore so let me give a quick refresher.
In recent months China has decided to crack down pretty hard on Bitcoin mining. Most miners heard the message and unplugged their mining rigs to look for better opportunities elsewhere.
The result was a big drop in the hash rate of the network that we covered here.
Fast forward to now and it looks like the unplugging process is over.
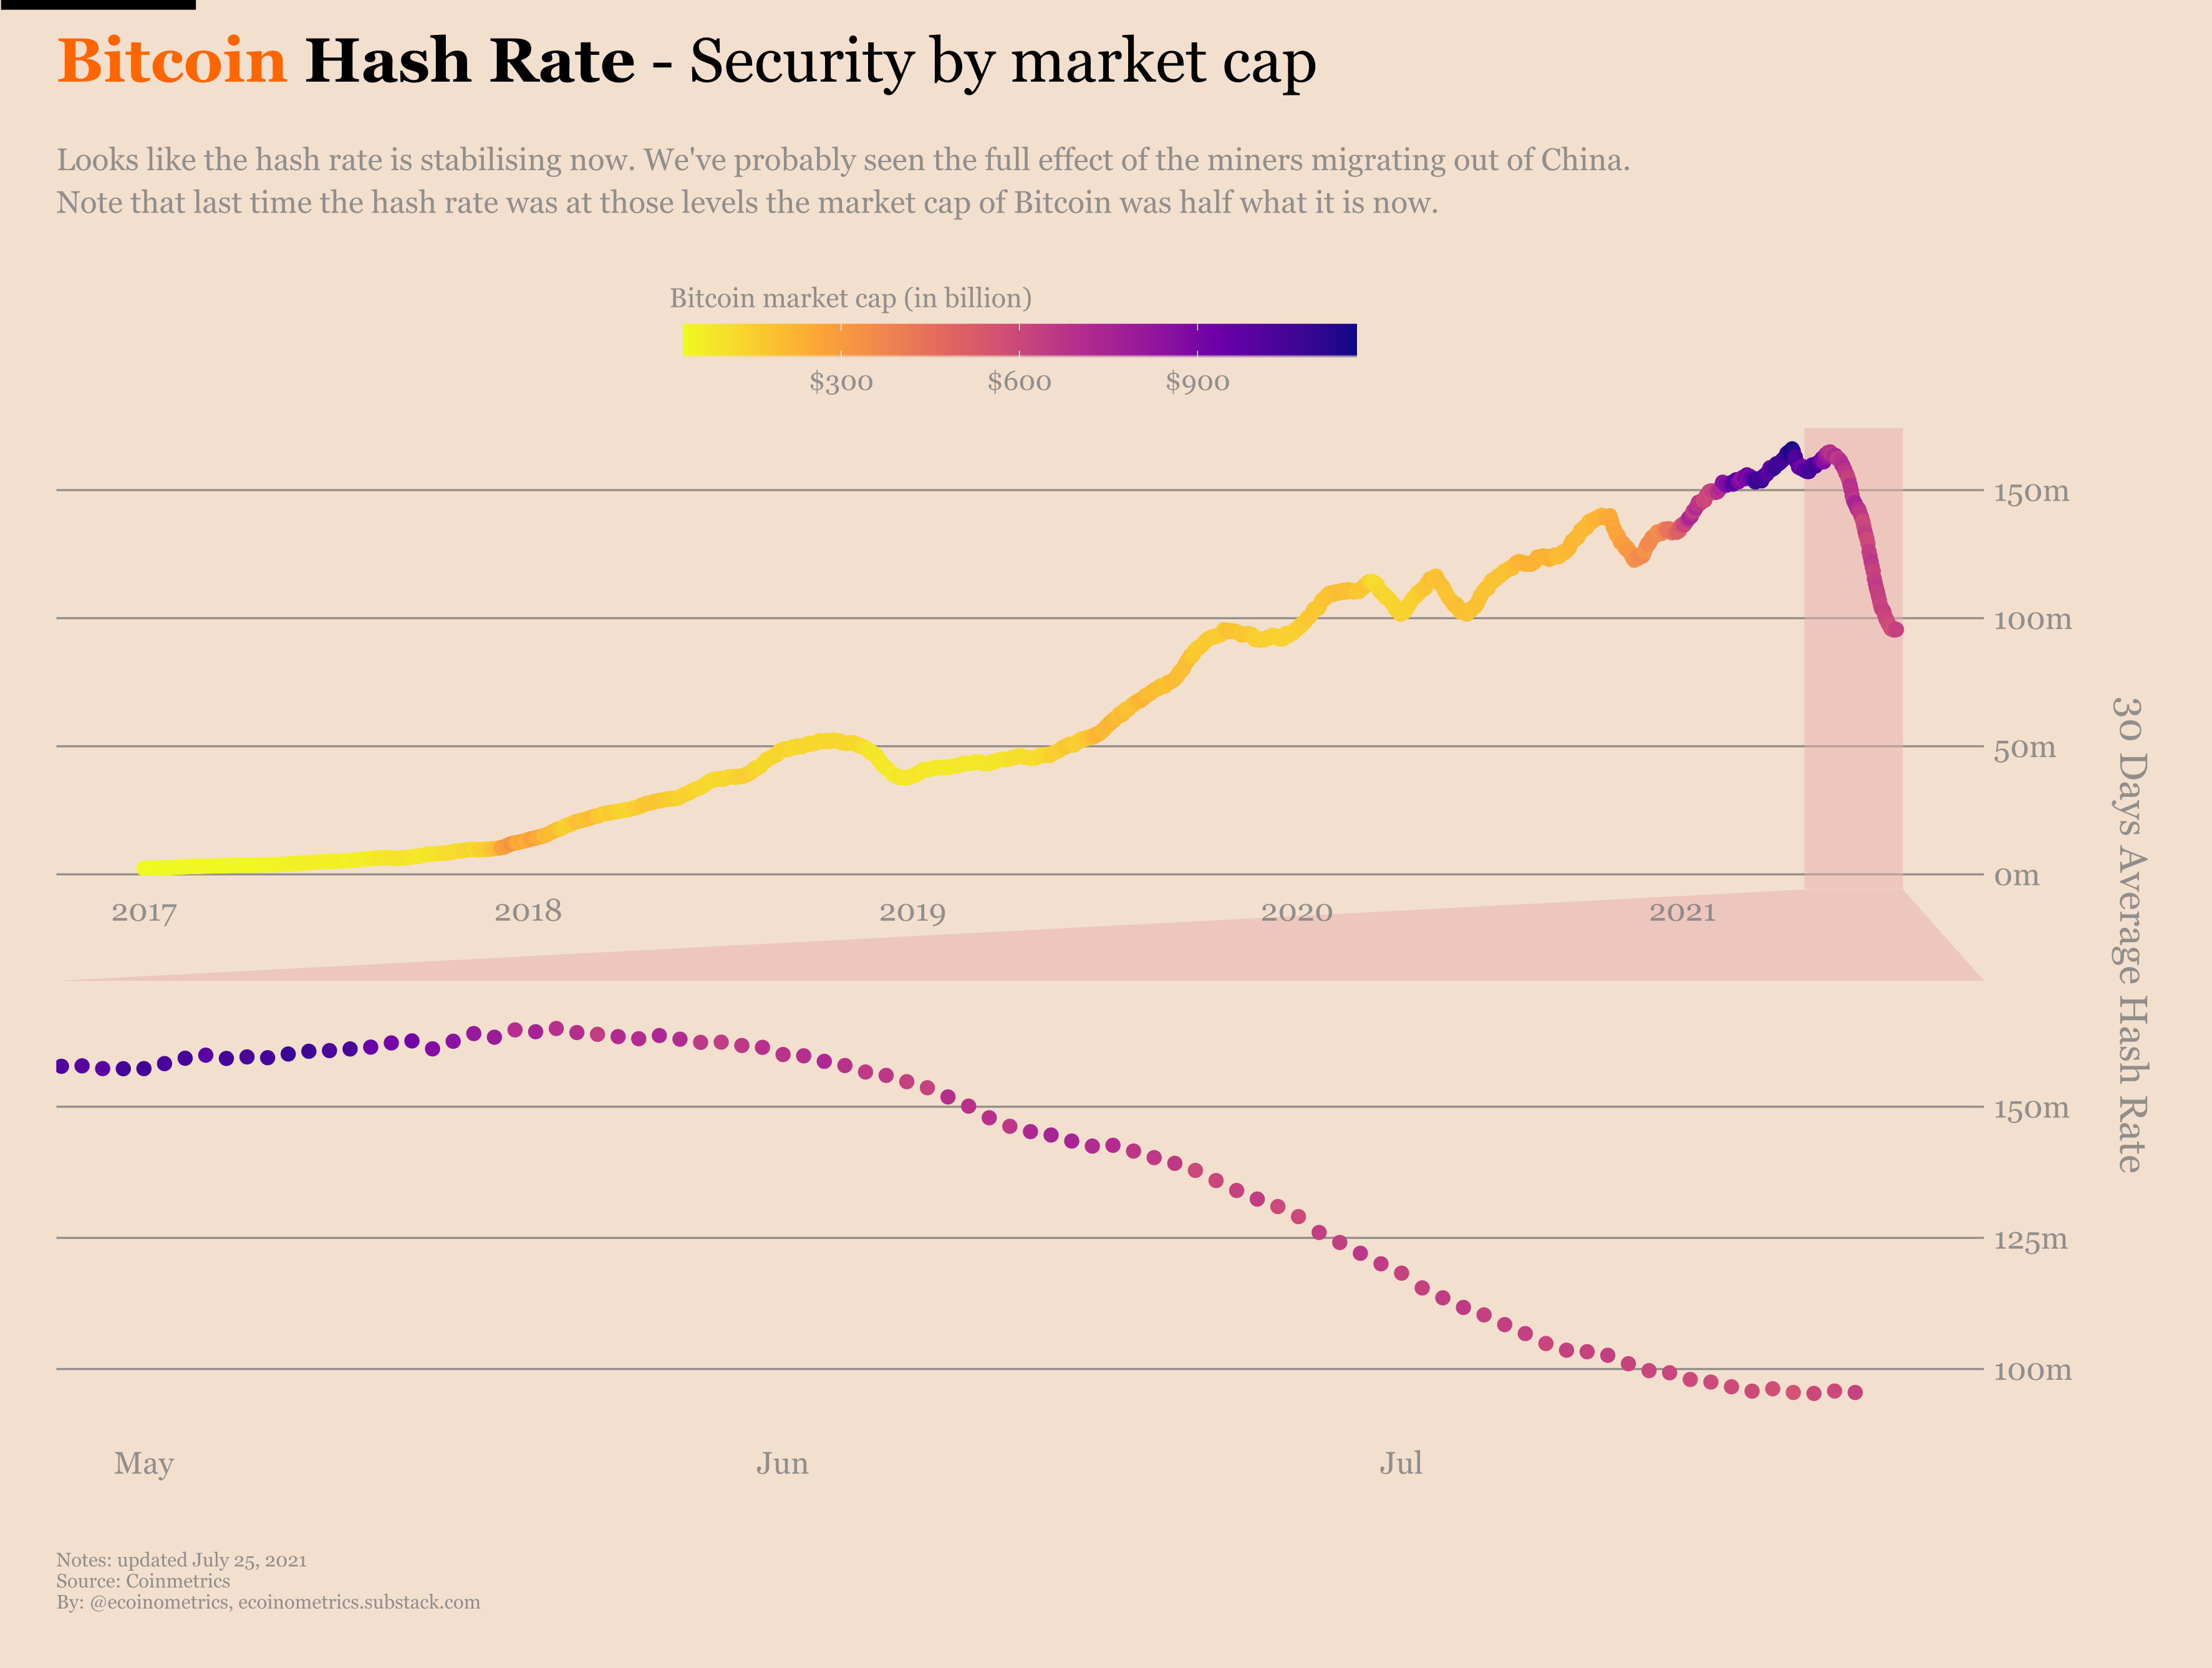
Surely we’ll see the hash rate climb again when the Chinese miners start to relocate their operations to other countries. But for now we are settling at a hash rate level last seen in the middle of 2020, when BTC was worth half of what it is worth now.
Someone asked me a good question regarding the relationship between the hash rate and the price: how correlated are these two?
Well if you plot a log-log chart of the price versus the hash rate it seems pretty clear that when you zoom out, the more valuable Bitcoin gets the more hash rate on the network.

That makes sense. If BTC is more valuable it attracts more miners which see mining Bitcoin as a profitable activity. Hence the pattern we see on the chart.
But the question of the correlation is slightly different. We are asking, over a given period of time, how is the change in BTC value related to the change in hash rate?
To look into that I’ve calculated the change in BTC value and mean hash rate on a month-to-month basis. Then I’ve taken the one-year running correlation of those values.
Here is the result.
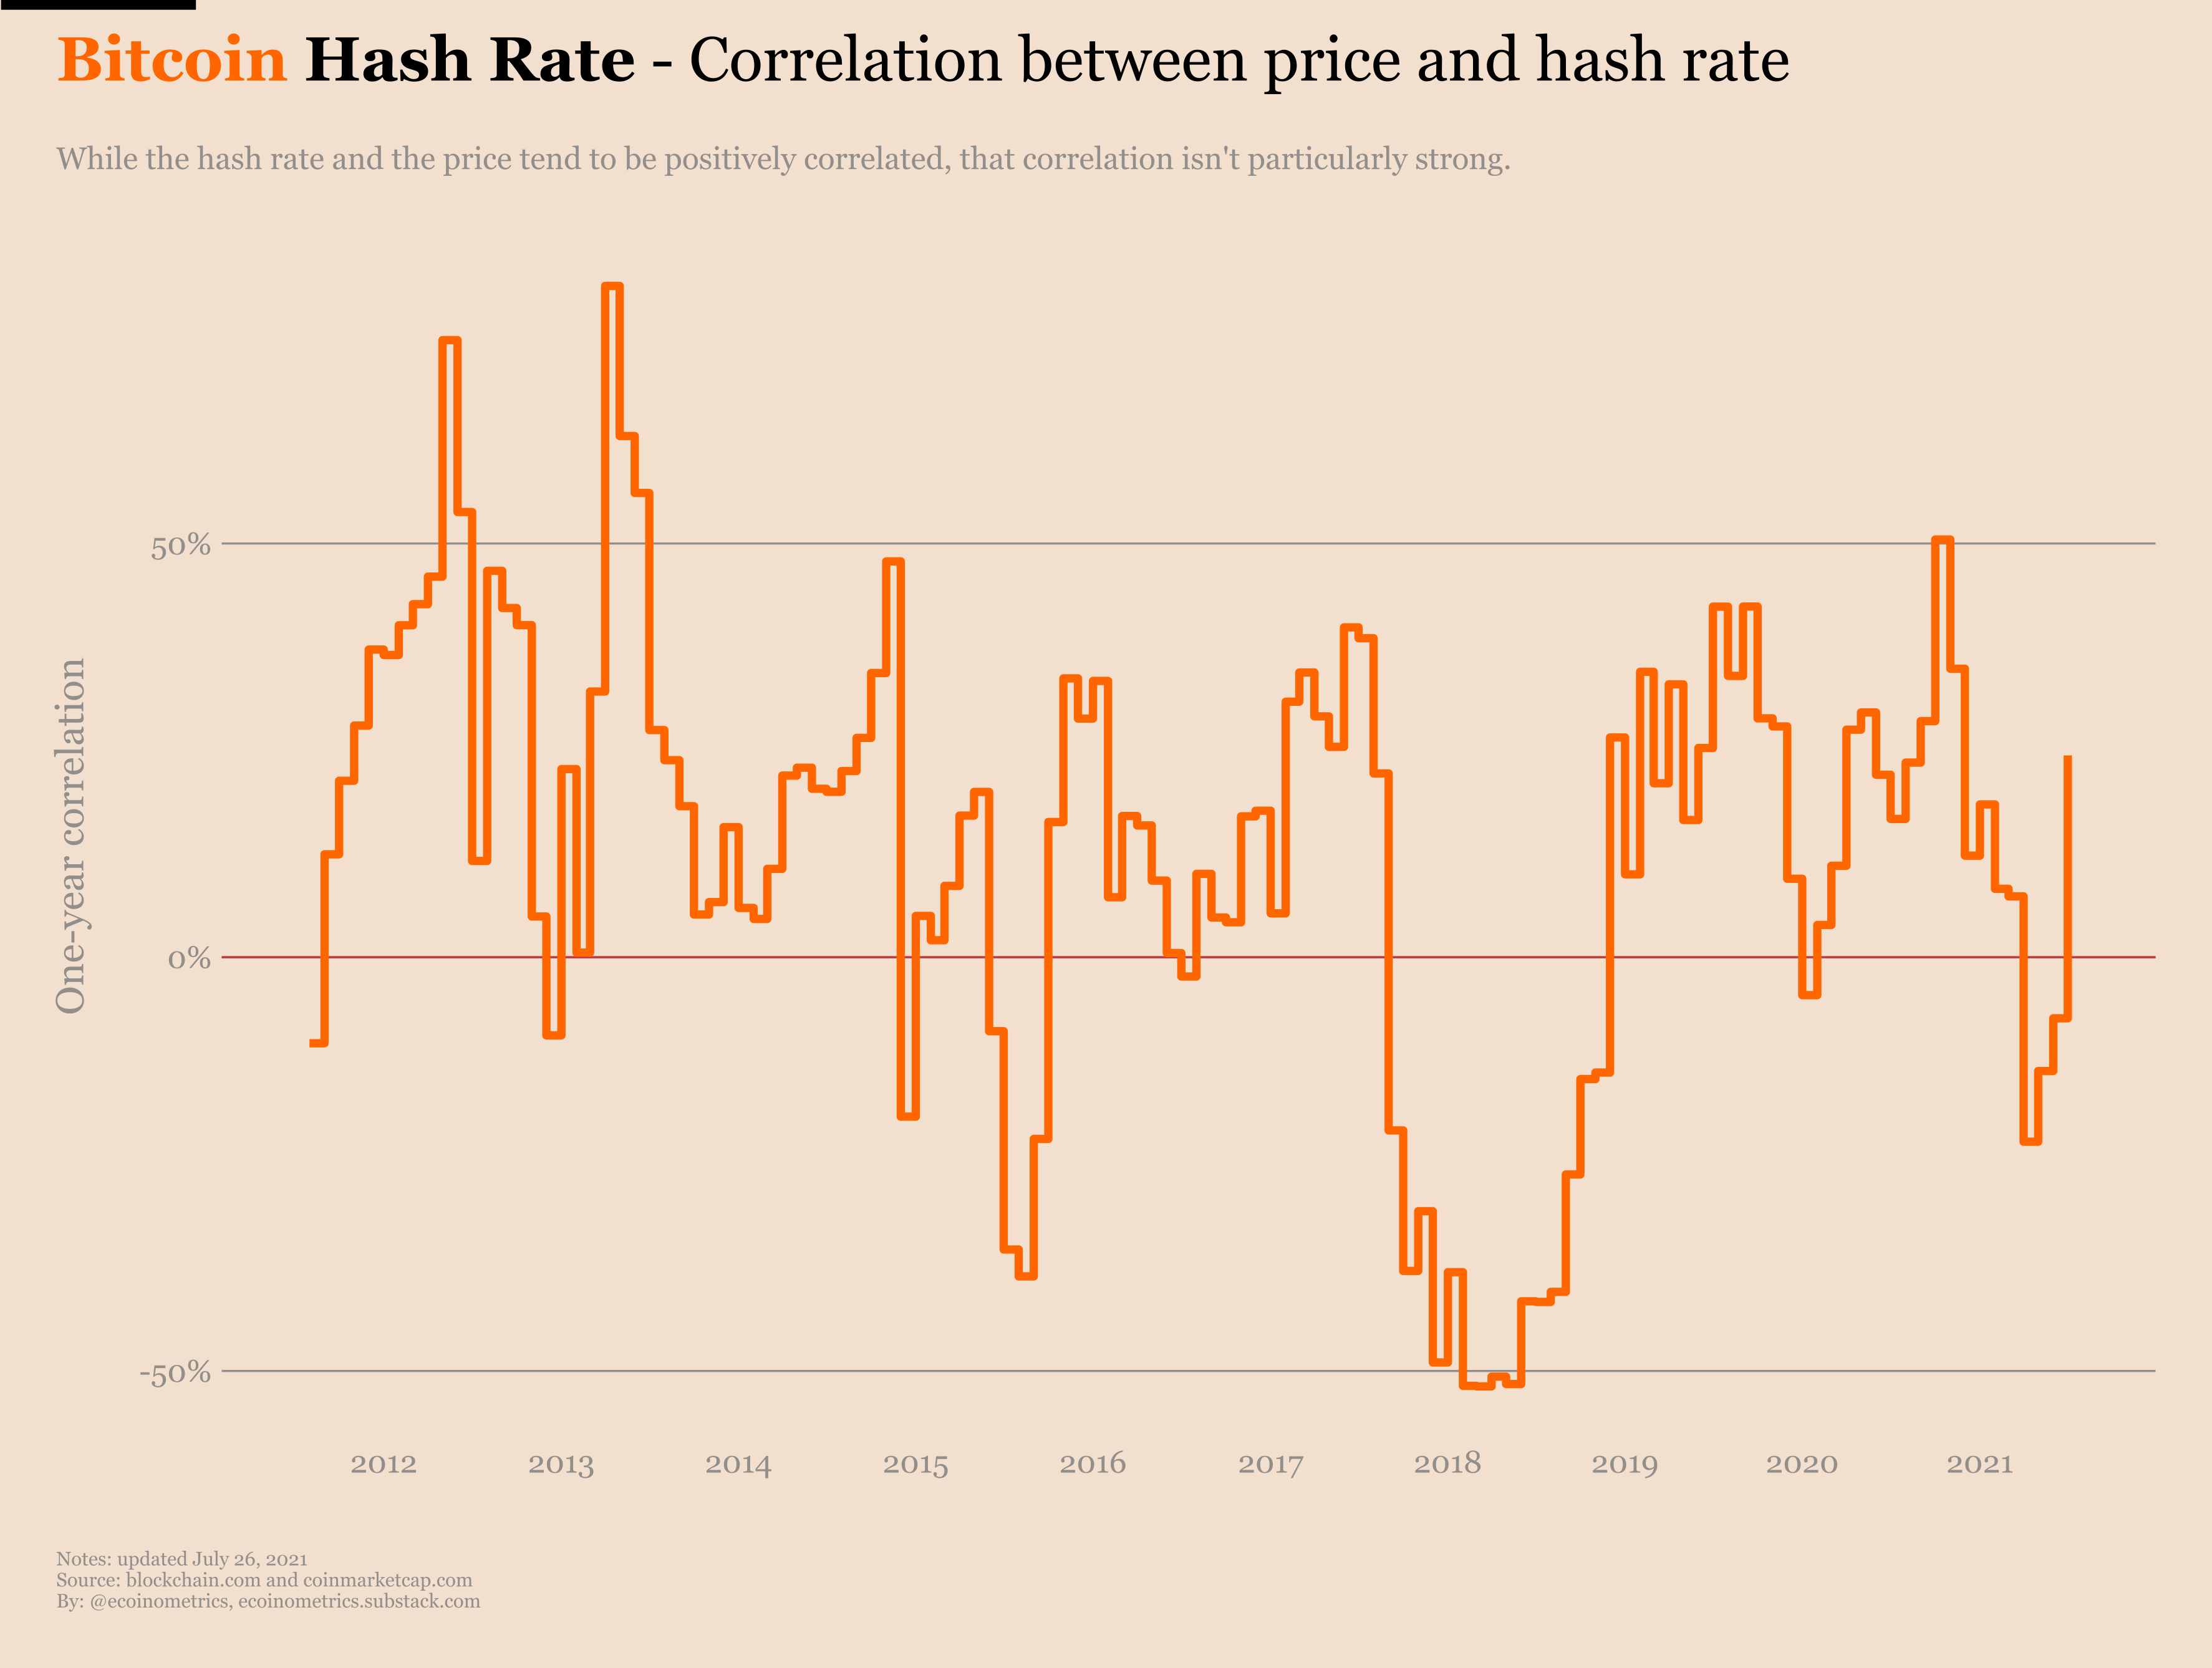
On this time scale of several months, BTCUSD and the mean hash rate tend to be positively correlated. But that correlation is not massive.
If you think about it a little, that makes sense.
Setting up or scaling up a Bitcoin mining operation takes time. You need to get a location, get the mining rigs and set up your infrastructure. All that takes time and definitely lags the price.
Same thing for miners scaling down their infrastructure. Since it is a fair amount of work to get going, you would probably like to continue mining as long as possible even when the price is in a downturn. So here too miners capitulation can lag price changes significantly.
Hence the relatively low correlation on the shorter time frame. No big surprise actually.
We have only started to scratch the surface of the economics of Bitcoin mining.
What is an appropriate level of hash rate? How will mining be affected by the slow transition to a mostly fee based model of remuneration?
These are important questions about the future of the network that we’ll definitely have to get back to another time.
That’s it for today. If you have learned something please subscribe and share to help the newsletter grow.
Cheers,
Nick
P.S. For daily updates follow Ecoinometrics on Twitter.
Good read, as always. I would suggest to plot a btc_price/hash_rate correlation TIME-DELAYED by the lag the miners have in responding to more or less incentives. We may see a constant and coherent high correlation number - which could be of great use in trading MARA/RIOT etc. using BTC as a leading indicator.