Ecoinometrics - Mapping Market Conditions
November 10, 2021
So that’s it. The Federal Reserve has decided that it’s time to taper their purchasing program.
Obviously doing that in the context of financial markets that are addicted to liquidity is dangerous.
We are potentially one small step away from a big mistake that could have dire consequences on the stock market and on Bitcoin at the same time...
The Ecoinometrics newsletter decrypts the place of Bitcoin and digital assets in the global financial system. If you want to get an edge in understanding the future of finance you only have to do one thing, click on the subscribe button right below:
Done? Thanks! That’s great! Now let’s dive in.
Mapping market conditions
If you just look at what’s happening in the Bitcoin world, everything looks fine. We just made a new all-time high and we did so with an aggregate risk that shows the market is far from being overheated.
See for yourself.
But this doesn’t tell the whole story. Bitcoin doesn’t live in a bubble (no pun intended). It is more and more part of the global financial system.
Which means, now more than ever, it is at the mercy of a liquidity crisis that might hit the stock market.
And as we are moving away from the COVID crisis, it is also more likely than ever that the Federal Reserve could be the source of it all...
Let’s rewind a little bit. Last week we got the FOMC meeting for November where Jerome Powell announced two things:
Tapering starts now.
Rates won’t rise until late next year at best.
Remember the sequence of actions since March last year:
The COVID lockdown hits the economy.
The stock market tanks.
The Federal Reserve floods the market with trillions of dollars of liquidity.
The stock market recovers.
Since then the Fed continues to expand its balance sheet at a constant rate.
The tapering then refers to the process of reversing this expansion. But of course you can’t quit cold turkey.
So the first step the FOMC will take is to reduce the rate at which the balance sheet is expanding. Until now:
The Fed has been purchasing $80 billion worth of US Treasury bonds every month. They will reduce this by $10 billion every month.
The Fed has been purchasing $40 billion worth of Mortgage Backed Securities every month. They will reduce this by $5 billion every month.
If you do the math that means they should stop purchasing anything by June 2022. That is at least if they don’t have to change course before that date.
Because Jerome Powell is exceedingly cautious with what he is doing. As he said last week, this tapering plan is only valid for the next two months. At the next FOMC meeting they will reevaluate the situation and decide whether or not they can continue.
The last thing Jay Powell wants to do is spook the market.
That makes sense because at the end of the day, in a post-2008 world where the financial markets are dominated by the intervention of the central banks, he who sets the monetary policy also sets the stage for the performance of the stock market.
Basically we can think of it as the Fed setting the market conditions:
By controlling the rates they control the real yield.
By controlling the pace of the balance sheet expansion they control the amount of liquidity in the system.
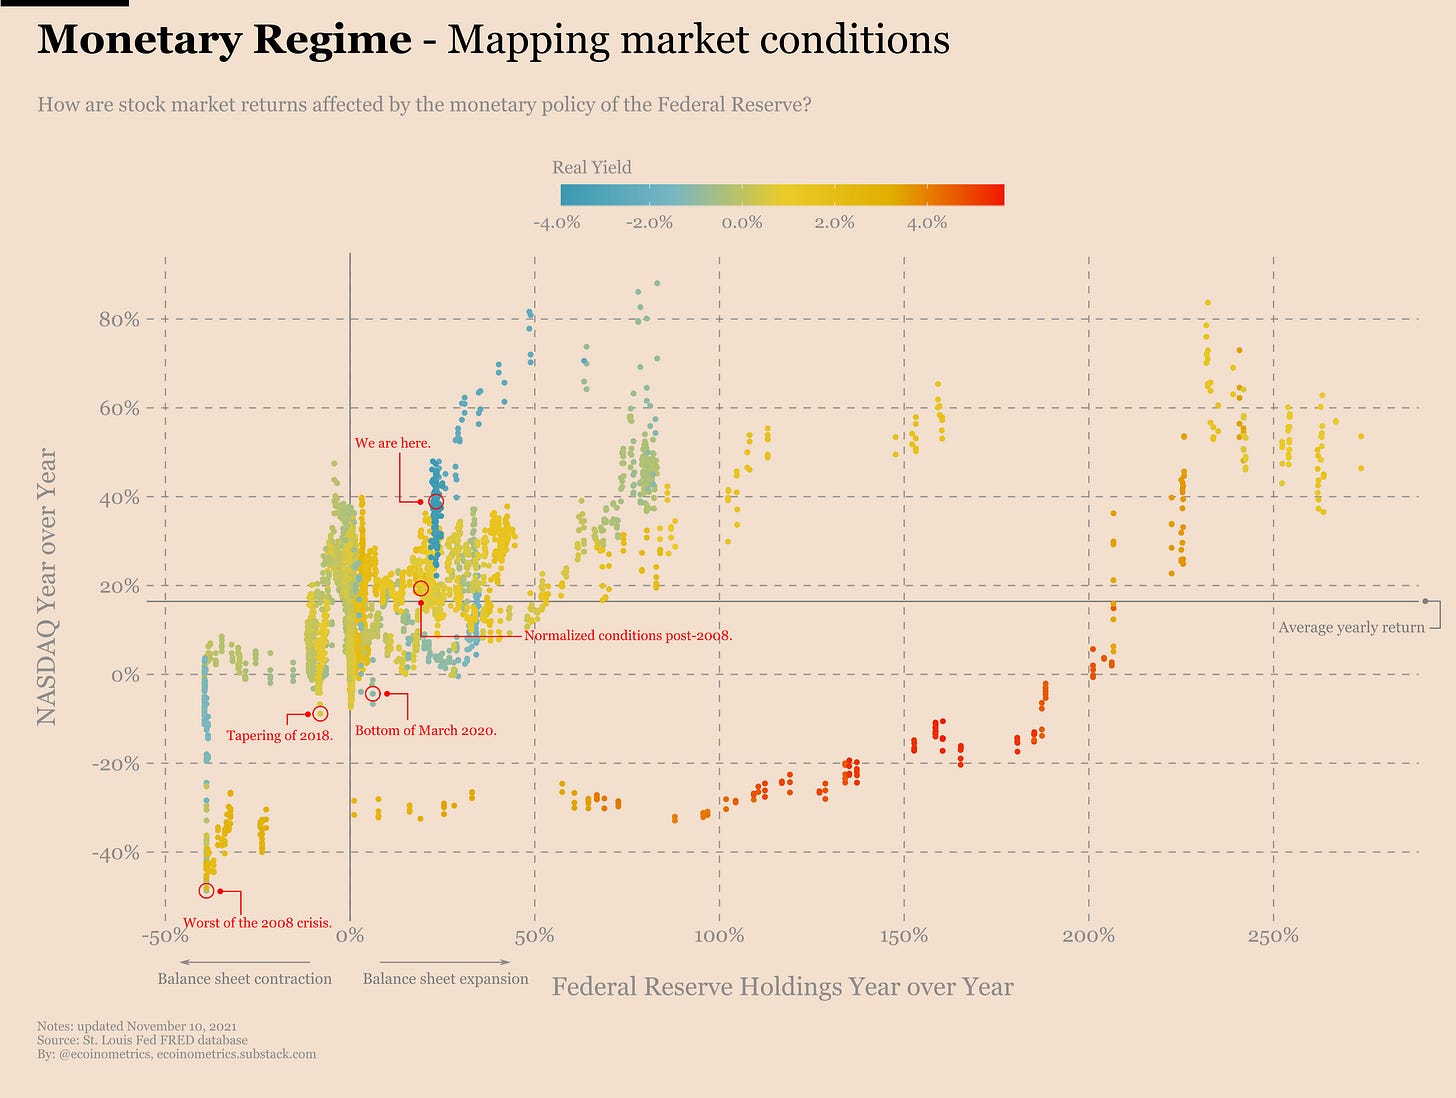
I’ve tried to represent that as a map of market conditions below.
The horizontal axis represents the year over year change of the size of the balance sheet.
The vertical axis represents the year over year return of the NASDAQ100.
Each point is the daily close of the NASDAQ and is colour coded by the real yield (US Treasury 10-year minus inflation) on that day.
Now take a couple of minutes to look at the map and see if you can figure out some patterns.
Done? Ok.
Well what I see is a pretty strong correlation between what the Fed does and how the return of the stock market looks like.
Maybe start at the bottom left. This is the bottom of the 2008 crisis.
After that the Fed starts pumping a massive amount of money in the system and that gives rise to the long tail that starts at the bottom and rises up to +80% year over year return for the NASDAQ.
Pretty powerful stuff.
Now ignore that long tail and concentrate on the bulk of the points.
Basically the shape it makes is up and to the right. That means in general the more liquidity the better it is for the stock market returns.
And if you focus on the colours you can also see that negative real yields can help to boost returns, but at the end of the day liquidity is king.
Right now we are still well positioned on the map.
Actually this zone we are currently in gives the Fed great returns on their newly created bucks. Historically speaking by expanding their balance sheet at 10% to 50% a year the Federal Reserve guarantees above average returns for the stock market most of the time.
From their perspective that’s a good deal.
But with tapering starting now we’ll inevitably move towards the danger zone i.e. the bottom left quadrant. That’s what everybody is worried about and something you shouldn’t ignore even if you are only investing on Bitcoin.
So let’s keep an eye on it.
CME Bitcoin Derivatives
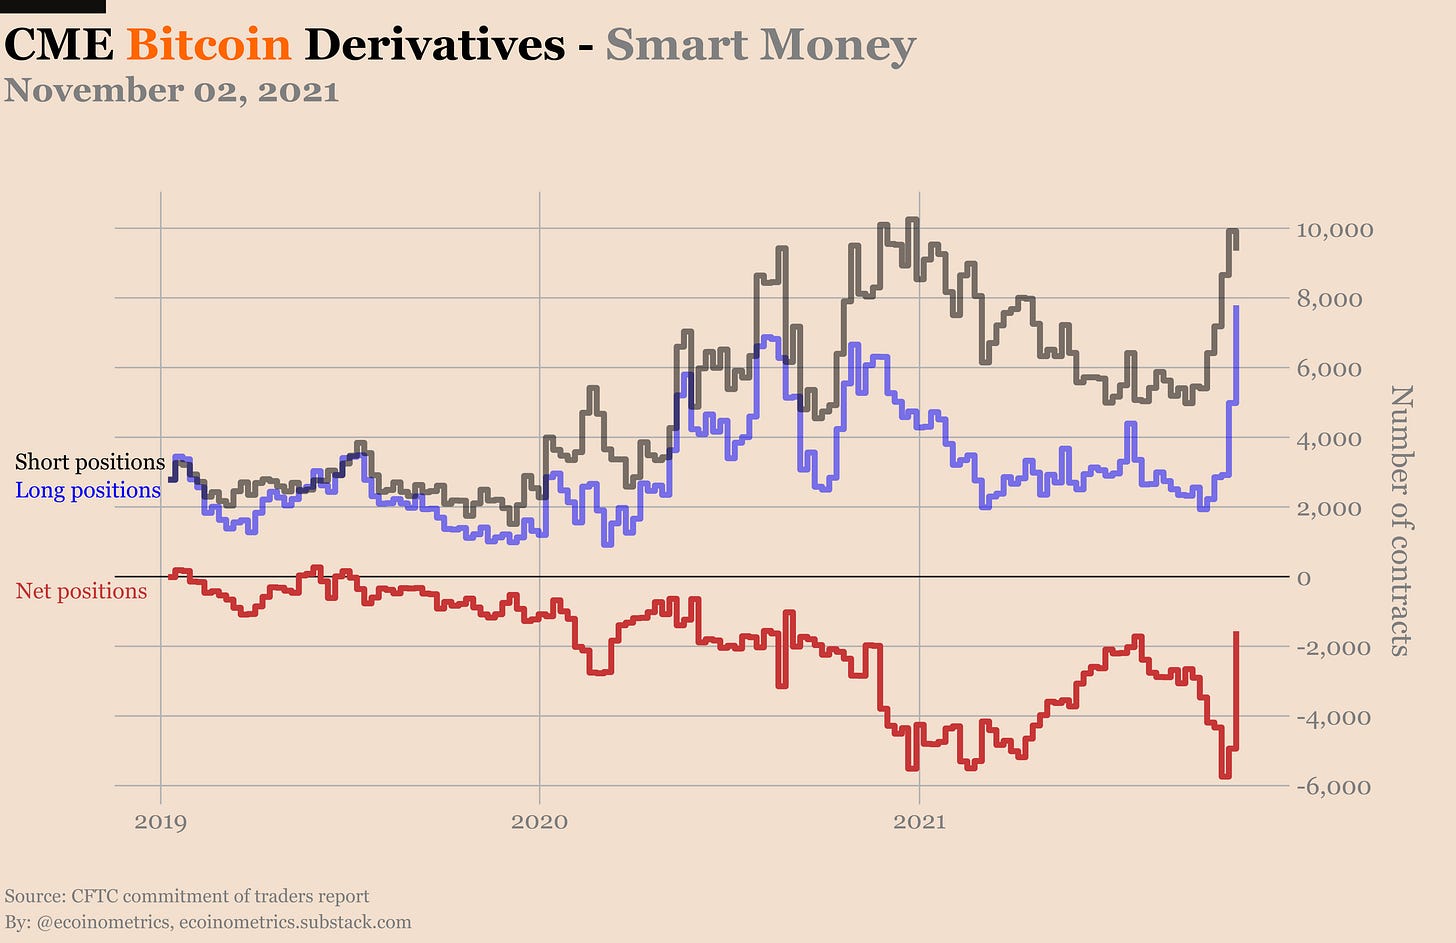
Wow! There is something big going on right now. The smart money is getting long Bitcoin.
Finally!
Check this out.
It isn’t even that hedge funds are giving up on their short positions. Nope. The carry trade is still going strong.
Instead these are some legit long positions held by some good old fashioned asset managers.
We might finally get some of that trend following action I thought would have happened last year.
Probably nothing…
That’s it for today. If you have learned something please subscribe and share to help the newsletter grow.
Cheers,
Nick


Awesome work, always a pleasure to read you. Very reassuring to have regularly good data and analysis to work with.
Amazing job.