Ecoinometrics - May 10, 2021
One year later...
We are almost one year after Bitcoin’s 3rd halving and one thing is sure: the halving was not priced in.
Time to look back on where we come from and draw plans for where we could be going...
The Ecoinometrics newsletter decrypts Bitcoin’s place in the global financial system. If you want to get an edge in understanding the future of finance you only have to do two things:
Click on the subscribe button right below.
Done? That’s great! Now let’s dive in.
One year later
May 11, 2020. That’s when the 3rd halving happened.
At that time Bitcoin had recovered from the crash of March. And what a recovery! In only two months BTC gained 100% and was worth about $8,800 for the halving event.
A year later, one BTC is now worth about $58k i.e. a 6.5x multiplier.
And if you loaded your bag of sats during the crash of March 2020 you got an even better deal: 10x growth in one year.
Let it be a reminder that if you have a long enough time horizon dips are a good time to buy.
But coming back to our main topic, no, the halving wasn’t priced in.
To be fair things didn’t go straight up after May 11 either.
From May all the way to October Bitcoin did basically nothing, just trading in a range around $10k while volatility started plummeting.
Do you remember what people were thinking back then?
“Maybe the halving was priced in after all.”
“BTC is going nowhere. The bull market is over.”
“If I bought during the March crash should I sell now, right?“
And so on…
Not everybody thought that for sure. But that was definitely part of the negative sentiment at the time.
Then came October and we witnessed the start of the 1st parabolic move that took us where we are now.
And now Bitcoin has been trading in a range around $55k for a couple of months… it is as if $55k is becoming the new $10k.
Am I the only one seeing similarities? How many times have you heard that the bull market is over, that Bitcoin is at the top for this cycle, that it is time to sell and buy alt coins instead?
Yep if we don’t get a new ATH every couple of weeks a lot of people are starting to doubt their investment thesis.
Stop. Zoom out. Compare this cycle to the previous ones.
What you’ll see is that the long term growth continues to be very similar to the bull markets of 2013 and 2017.
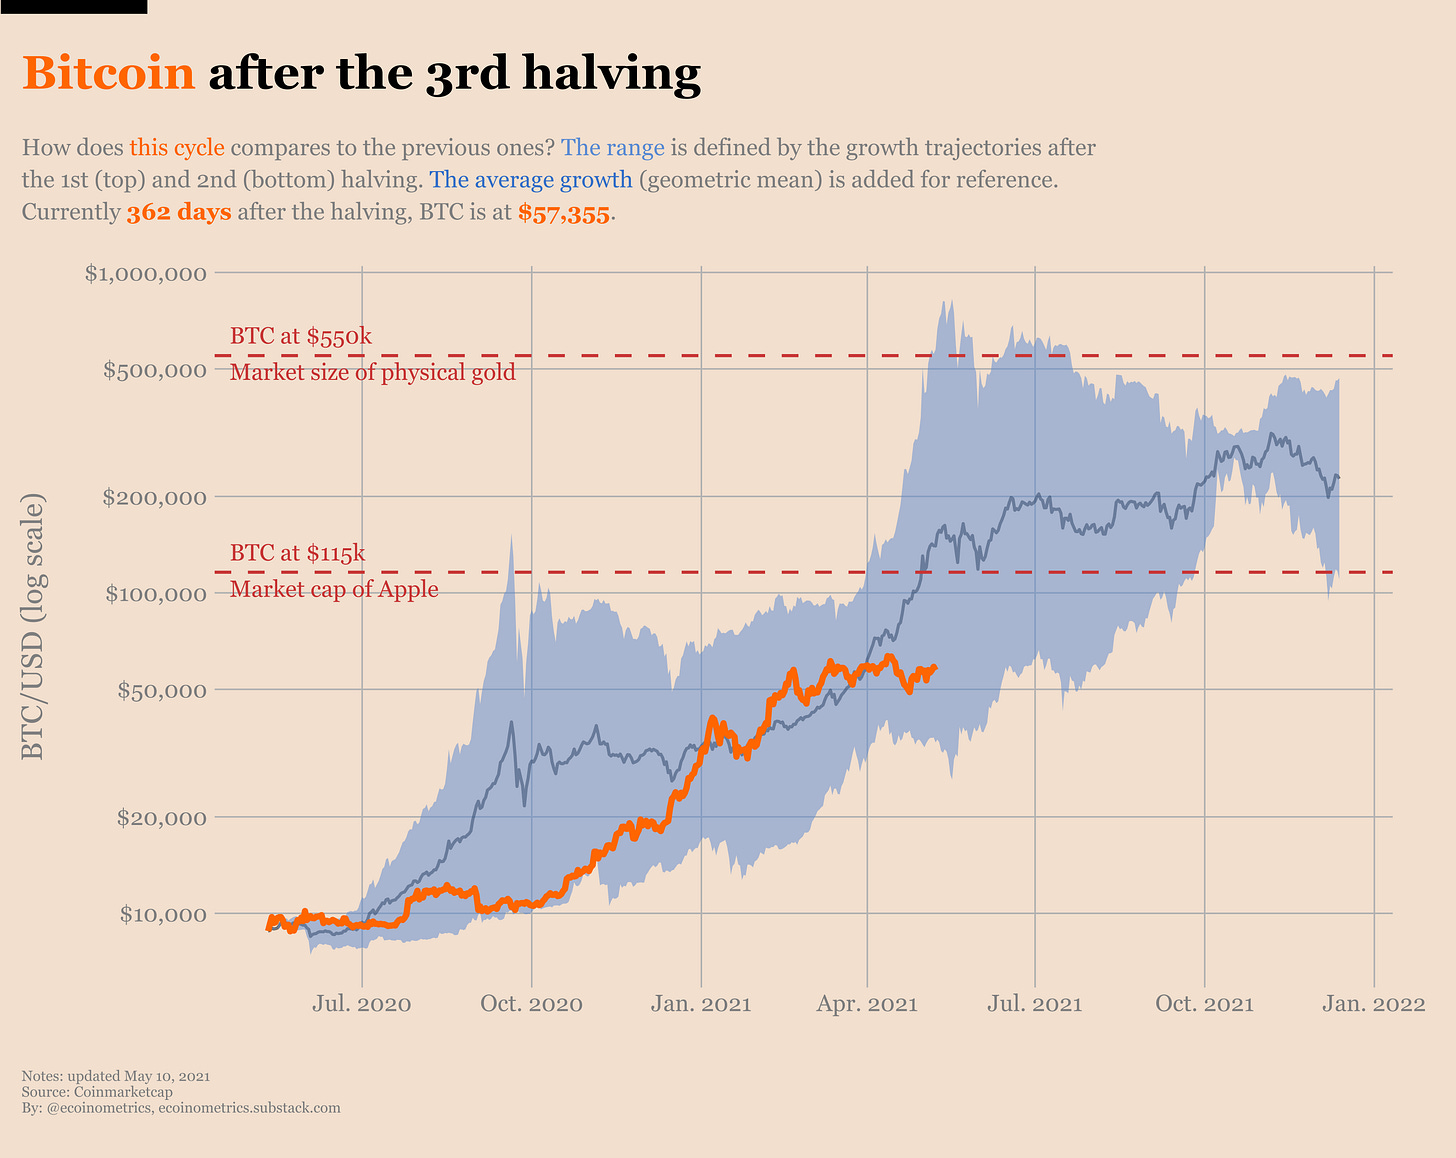
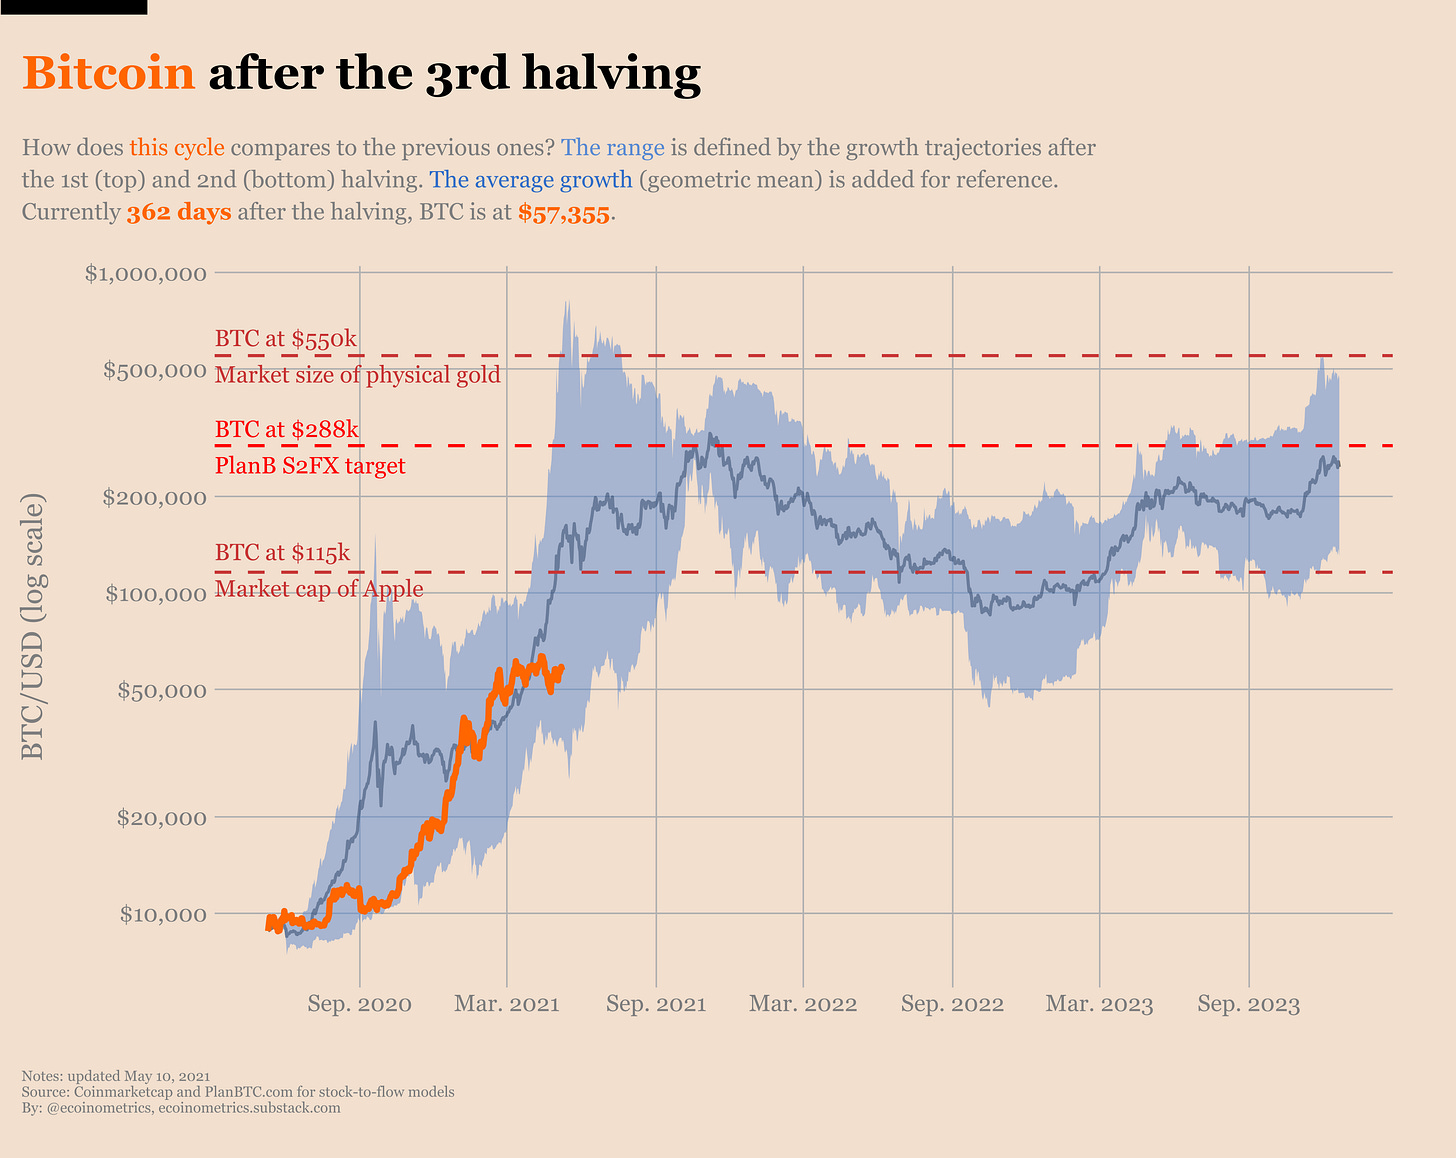
If you don’t want to make your own comparison chart I’ve got you covered. For the occasion here is an updated version of the halving tracker (go over here if you want to check out the old version).
Quick refresher.
If you take the value of BTC at the time of the 3rd halving you can ask yourself: what if this cycle follows the same trajectory as the previous ones?
Applying the growth trajectory after the 1st halving gives you the top of a growth range. Applying the growth trajectory after the 2nd halving gives you the bottom of a growth range. This is the blue range on the chart below.
For comparison you can add the average growth trajectory using the geometric mean of the previous two cycles (note that the old chart used the arithmetic mean and was a source of confusion hence the change). This is the dark blue line on the chart below.
As you can see the current cycle (in orange) hasn’t left the boundaries defined by the previous ones.
Things started in May following the 2nd halving trajectory. That was pretty slow. Then at the end of last year things picked up pace and the trajectory started looking more like the 1st halving cycle.
Now we are on a plateau but the long term trend is still there.
So if you are betting that the dynamic of tight supply coupled with strong demand will rhyme with the previous cycles you can hope for 5x more to come this year.
At this point if you think that we have reached the top for this cycle you will object that Bitcoin is getting large. And the larger the market the more likely you are going to see diminishing returns. That’s especially true given that Bitcoin’s market cap was much smaller in the previous cycles.
That’s the slower cycles thesis.
Fair point. I agree with the logic of diminishing returns. Bar some hyperinflation event that would see the US$ value of all assets skyrocket, you can’t expect that BTC will go to infinity.
But in my opinion Bitcoin is still small enough that the diminishing returns won’t start kicking in too hard yet.
Why do I think that?
Well let's put the value of Bitcoin in context.
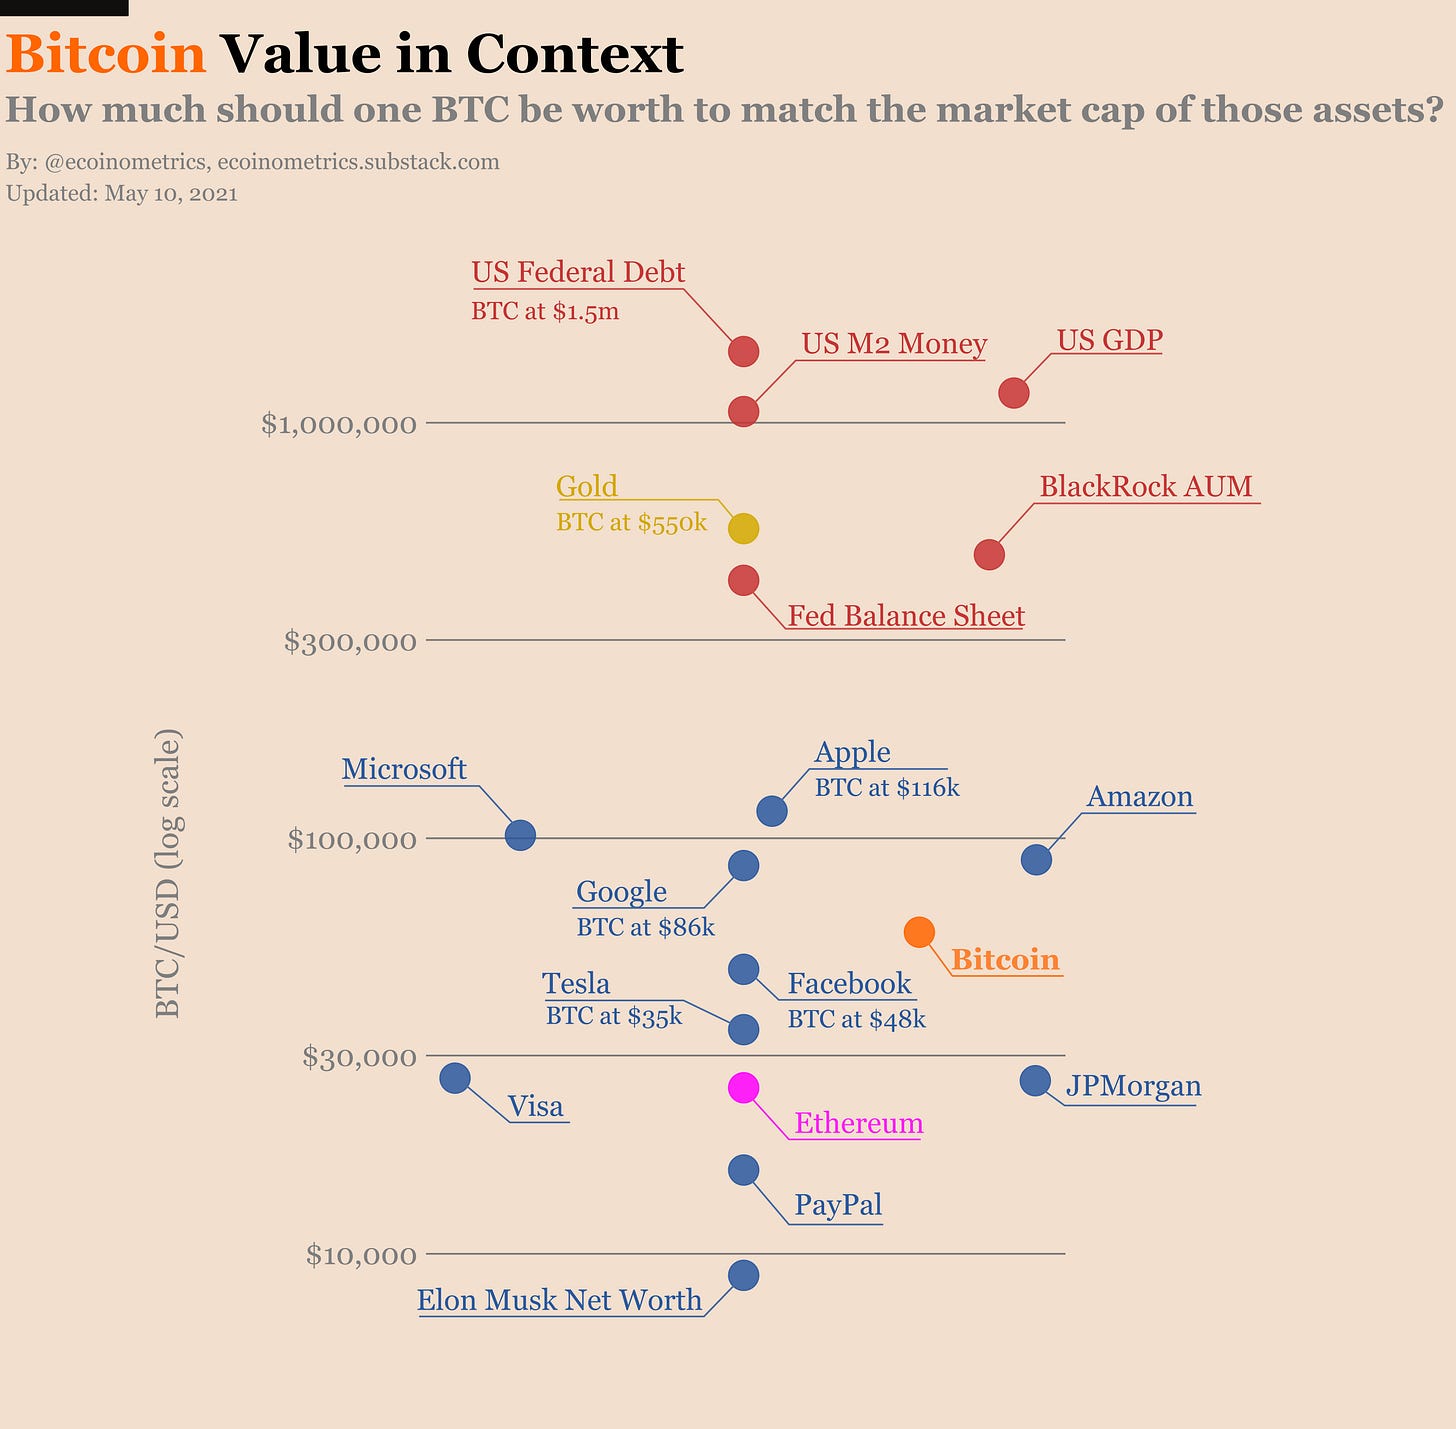
Take a look at Bitcoin’s market cap. Right now it sits above most public companies including JPMorgan, Tesla, Facebook… But it is still below the mega cap stocks: Google, Amazon, Microsoft and the largest of them all, Apple (more than $2 trillion).
If you believe in the narrative of Bitcoin as digital gold, it makes sense that over time its total market value will gravitate towards that of gold.
To get there Bitcoin will have to rise above Apple. At the current valuation this would happen when one BTC is worth $116k.
Then for Bitcoin to displace gold one BTC will need to rise to $550k (using the high estimate for the amount of physical gold above ground).
Take a look.
So if you think in terms of this cycle being Bitcoin’s transition to a fully fledged store of value then you can establish a range:
Bitcoin becomes larger than any stock i.e. BTC moves above $115k.
Bitcoin completely displaces gold i.e. BTC moves to $550k.
For sure completely displacing gold in just a few months sounds like a tall order. For that to happen we’ll need some sort of super cycle.
But moving past the market cap of Apple wouldn’t require a crazy amount of money flowing into the market: a Bitcoin ETF in the US? Institutional FOMO? Institutional plus retail FOMO?
That doesn’t sound far fetched to me.
So what’s a reasonable target between $115k and $550k?
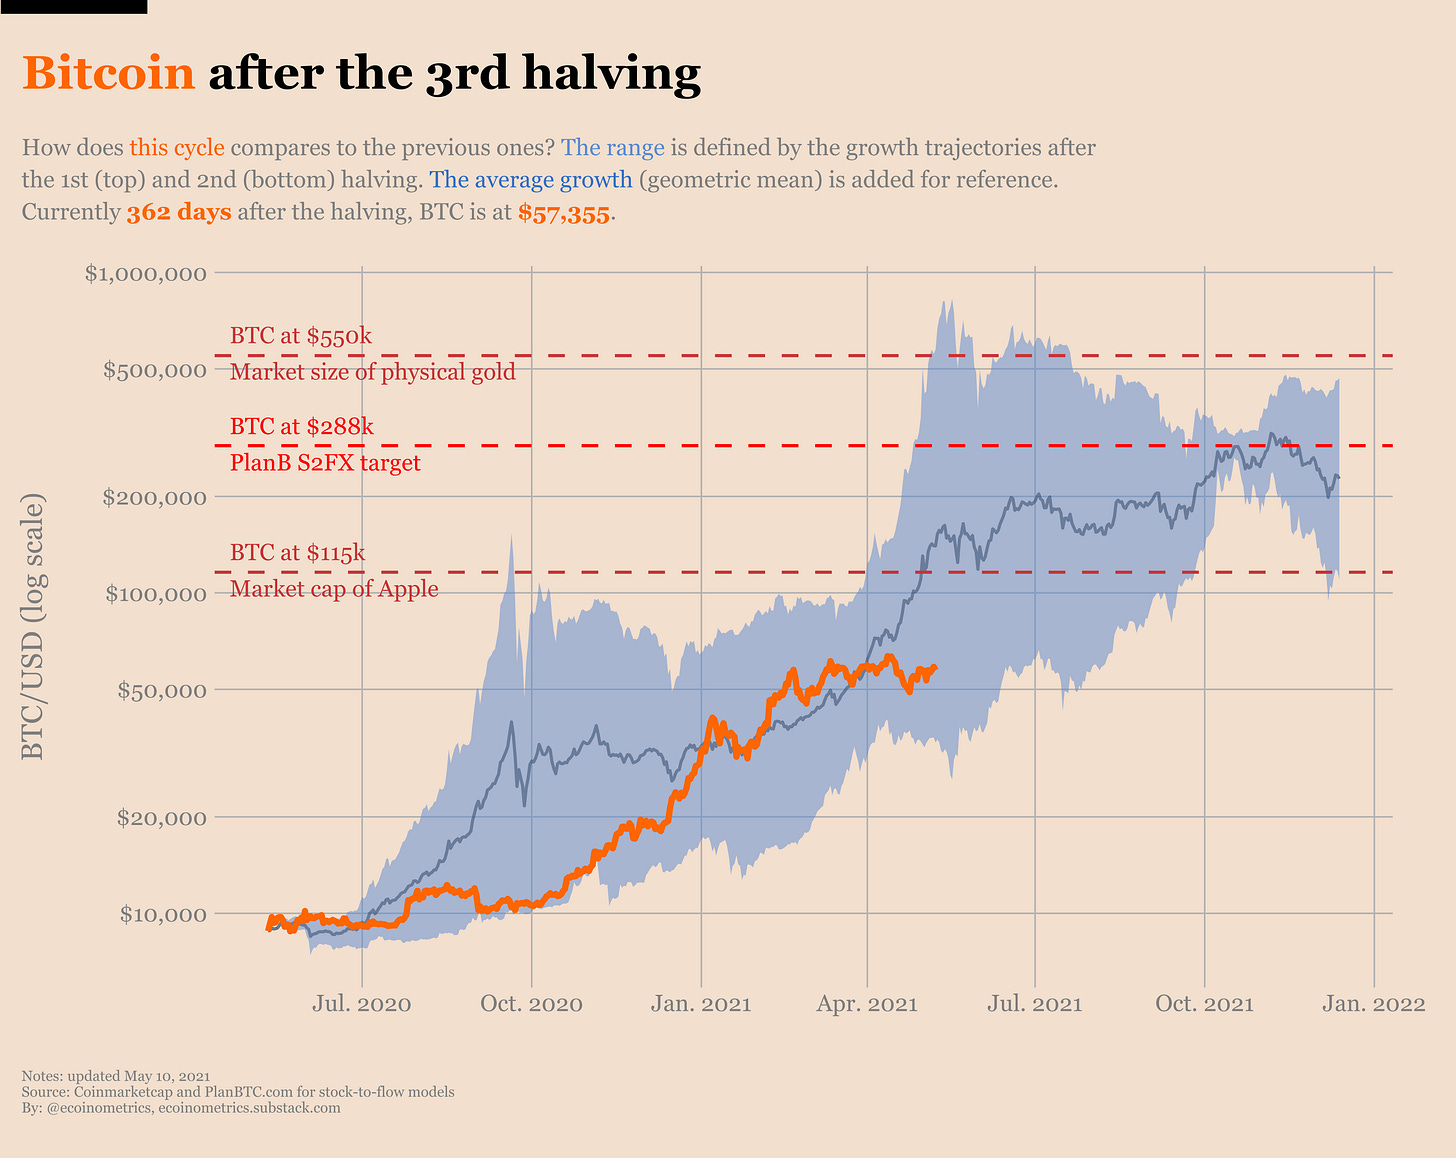
Well PlanB has the answer. His S2FX model gives a target for this cycle at $288k based on a cross assets analysis of the stock-to-flow measure of scarcity.
We can add that to the chart and see that it lines up nicely.
Yep, looks good.
Now you might agree with the digital gold narrative. You might even agree that Bitcoin has to move towards the $115k to $550k range. But you might still think this will not happen this year.
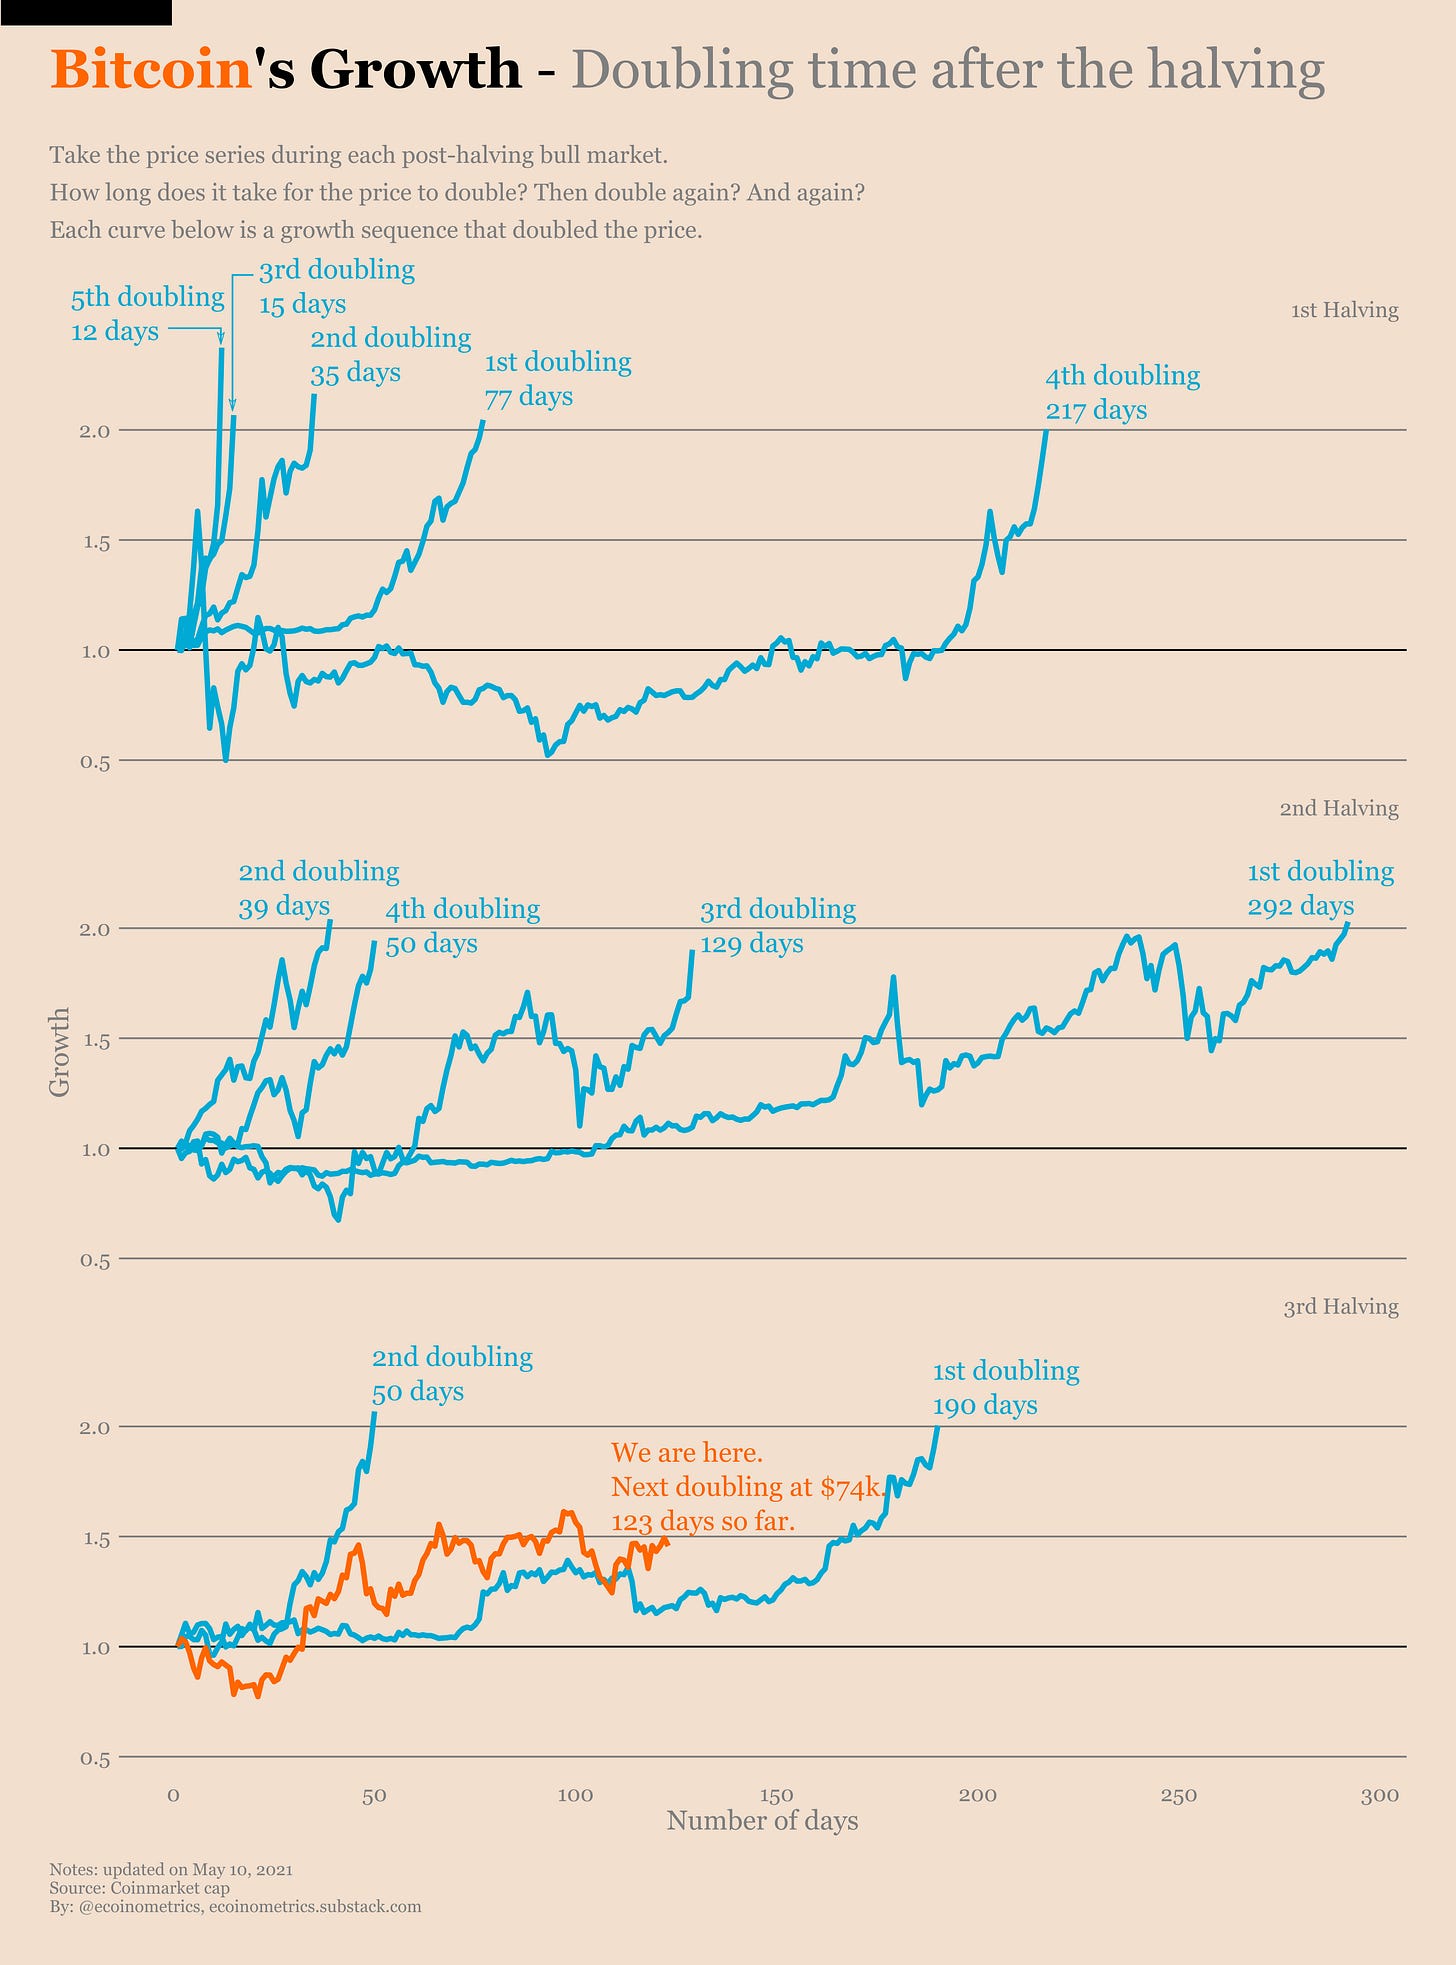
To that I’d answer with another chart. During a bull market things can go very fast and Bitcoin has shown that it can double in value in less than two months.
We still have 6 months to go until October…
So one year after the halving what should you do?
Of course nobody knows with certainty what could happen in a few months. But look at the range of possibilities.
If we get a super cycle you’ll be glad you didn’t wait to buy (similar to buying the crash in March 2020).
If we get a slower cycle the long term trend should still push Bitcoin to be at least as valuable as Apple as long as you are patient enough.
And one thing is sure, the longer Bitcoin sticks around, the higher the adoption as a store of value, the lower the risk it will go to zero.
Limited risk, good upside potential. Your call…
That’s it for today. If you have learned something please subscribe and share to help the newsletter grow.
Cheers,
Nick
The Ecoinometrics newsletter decrypts Bitcoin’s place in the global financial system. If you want to get an edge in understanding the future of finance you only have to do two things:
Click on the subscribe button right below.
Done? That’s great!


Great work!
🔥