Everyone is front running Bitcoin: that’s a double edged sword
Also inflation isn’t equally distributed and the correct view on multiple job holders
Welcome to the Friday edition of the Ecoinometrics newsletter.
Every week we bring you the three most important charts on the topics of macroeconomics, Bitcoin and digital assets.
Today we'll cover:
Everyone is front running Bitcoin.
Inflation isn’t evenly distributed.
What’s up with multiple job holders.
Each topic comes with a small explanation and one big chart. So let’s dive in.
In case you missed it, here are the other topics we covered this week:
If you aren’t subscribed yet, hit the subscribe button, to receive this email every week directly in your inbox:
Everyone is front running Bitcoin: that’s a double edged sword
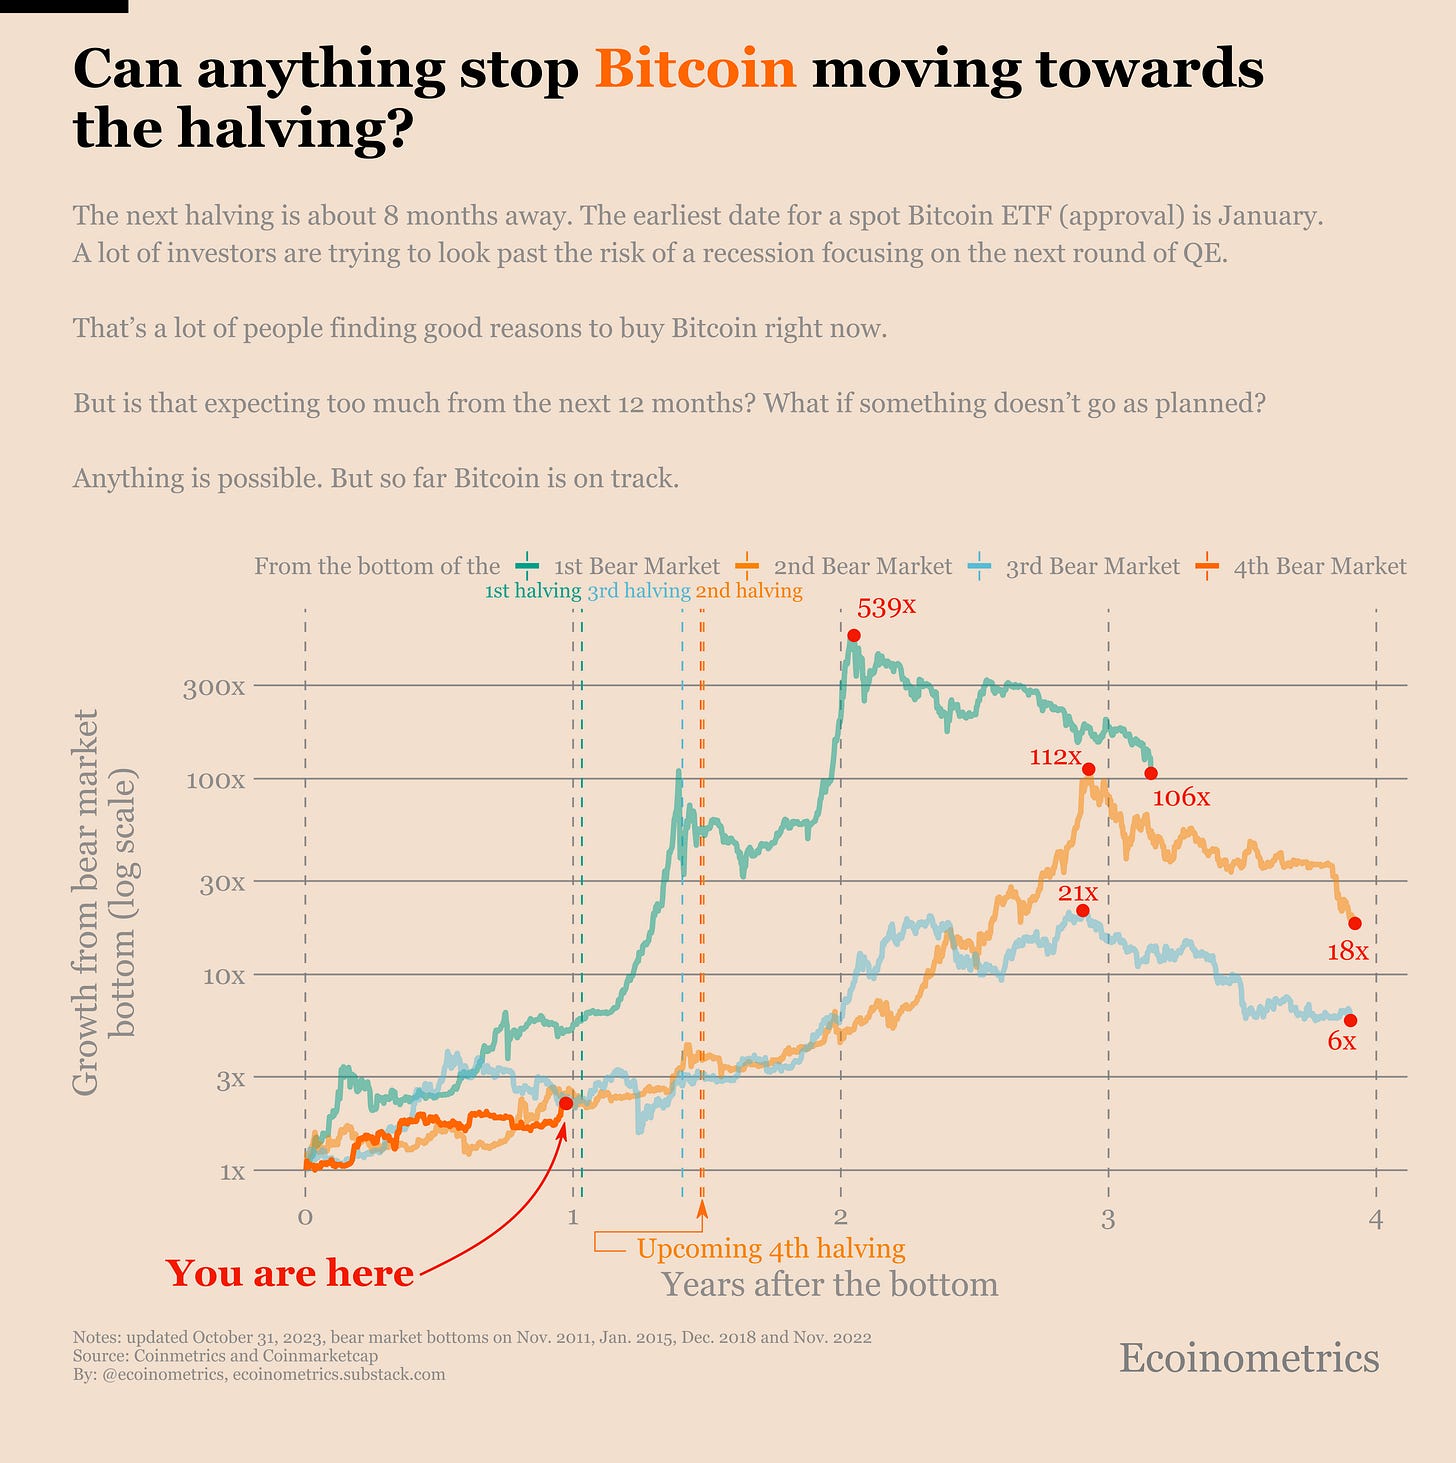
Let me paint you some picture (warning, hopium ahead):
The year is 2024.
The fourth Bitcoin halving is around the corner.
Multiple spot Bitcoin ETF are just approved by the SEC.
The US government is running always larger deficits. So much that the Fed is monetizing the debt.
In those conditions we are combining the halving narrative, together with inflows from the ETFs and looser financial conditions as the Federal Reserve needs to print money in order to finance a spendthrift government.
If anything like that happen, I’ll be pumping my fists while watching green candles all year for sure.
Now the problem is that right now I see many investors front running those events.
But what if the SEC finds new tactics to delay the ETFs? What if those ETFs get launched without attracting a massive wave of capital? What if inflation remains so sticky that the Federal Reserve has to continue running the QT playbook? What if there is a severe recession that drags down all assets, including Bitcoin for a few years?
I know that pessimists get to sound smart while optimists make money. But still, there are plenty of reasons why the planets won’t be aligned next year. Just ignoring those risks isn’t wise. Especially if the trend is pricing Bitcoin for perfection.
But for now… For now Bitcoin is still on the classic pre-halving recovery track.
Inflation isn’t evenly distributed
With the inflation spike that followed the COVID crisis, we are focusing on the short term inflation metrics. Year-on-year change in the CPI. Month-on-month change in the PCE. Things like that.
But if you want to see the real damages of inflation it is better to zoom out.
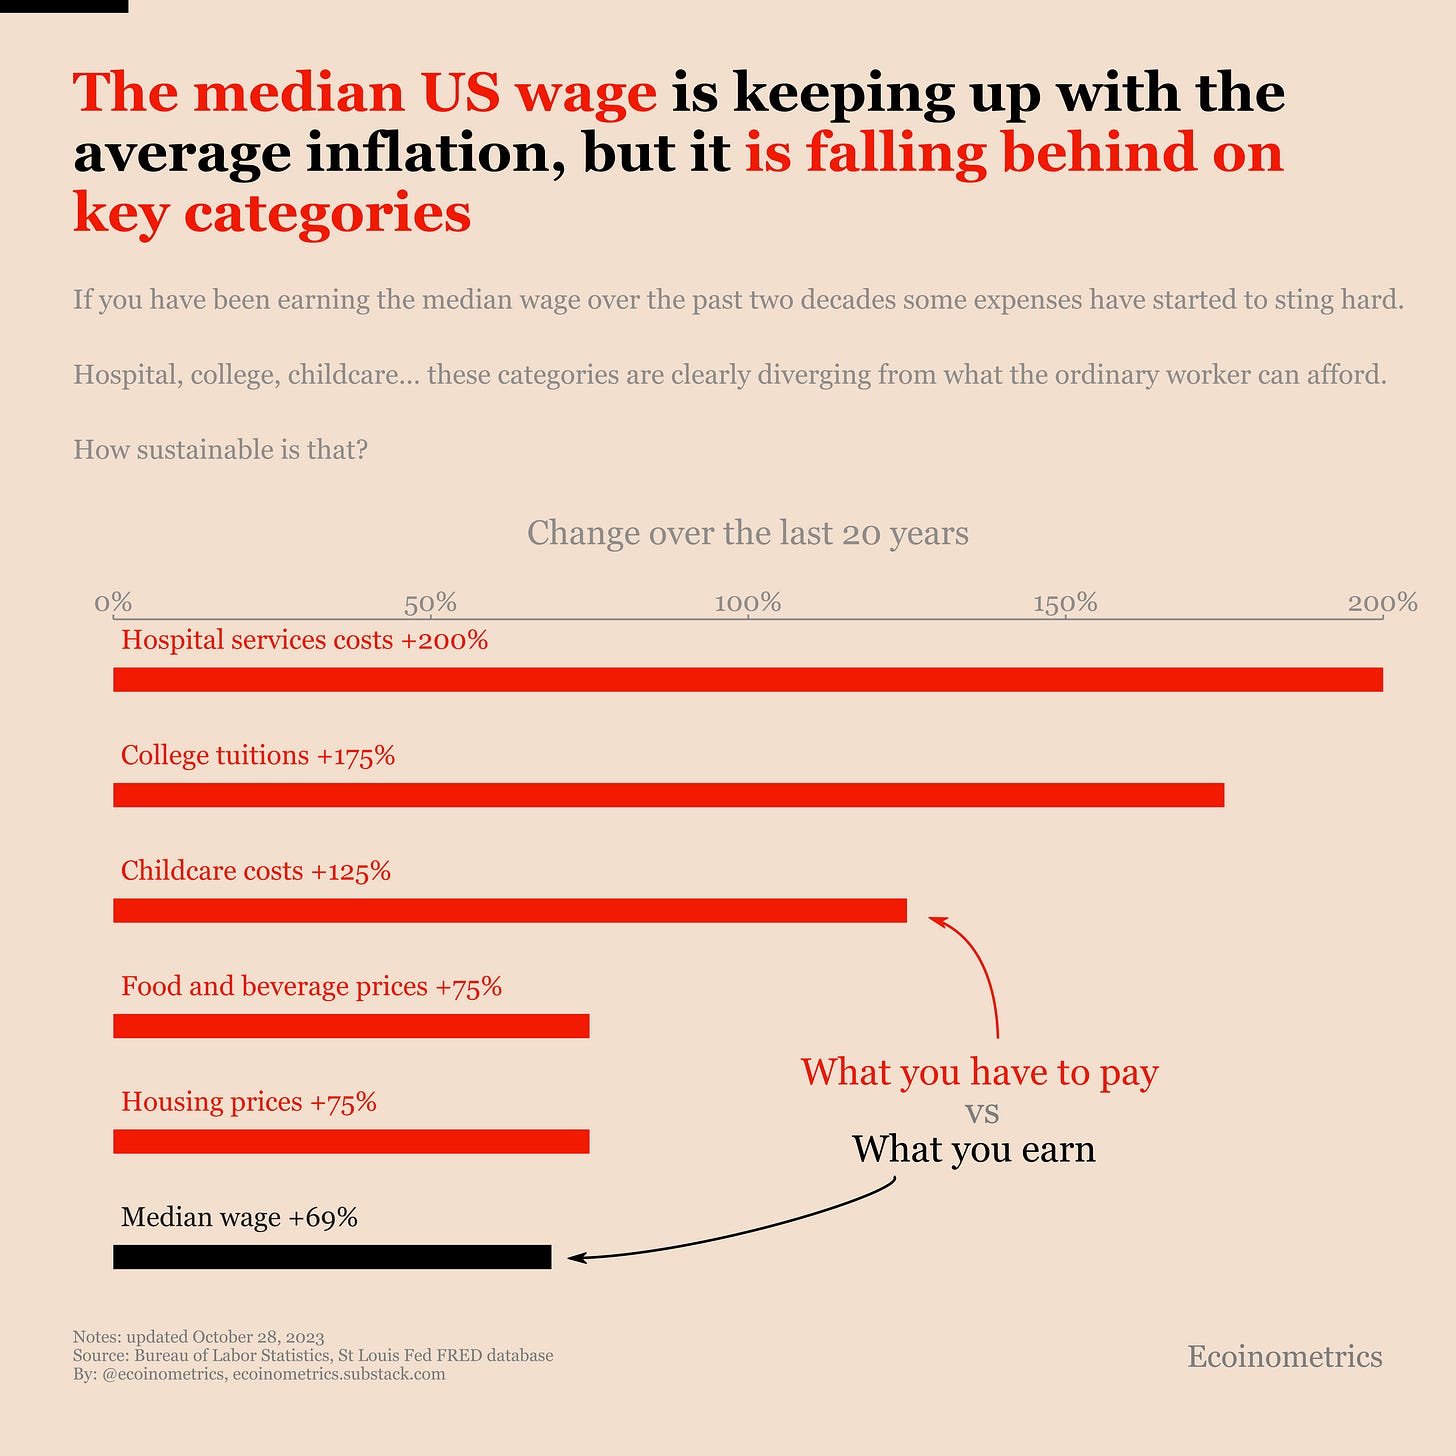
And when you zoom out over the past 20 years, the first thing you’ll observe is that the median wage in the US is keeping up with the growth of the CPI index over the same period, +69%.
Looking at this you might think, well that’s nice, half of the workers are completely unaffected by inflation. Except that’s a bit more complicated.
You see if the median wage is growing roughly at the same rate as the CPI over that period, subcategories of the index are growing much, much faster. And I’m not talking about luxury items here.
Do you know by how much hospital costs have jumped in 20 years? That’s 200%! College tuitions? Plus 175%. Childcare? Plus 125%.
And you wonder why people hesitate having kids…
My point is that when you look below the average, key expenses that touch pretty much everyone at one point in their life have become extremely expensive in just two decades.
But don’t tell that to Nobel laureates in economics…
What’s up with multiple job holders?
You might have seen this headline recently. The number of people working multiple jobs in the US is at an all time high and climbing.
From which it is easy to extrapolate that probably the US workers are doing so well if they need to do multiple jobs to make ends meet. And that probably means the US economy is in trouble if we are really seeing this trend explode.
But hold on. Is that really the proper way of looking at it?
I mean focusing on the absolute number of multiple job holders and this short term trend. Maybe not, because that fails to account for the fact that there has probably always been some amount of people working two jobs. So what really matters is there proportion as part of the total job holders.
Looking at it this way paints a very different picture.
About 5% of job holders are doing multiple jobs. That’s up big time from 4% right after COVID. But zoom out…
Actually COVID was a blip down. The lockdowns made it much harder to have multiple jobs and that has lead to a big crash in the multiple job holders. But 5% is actually the average proportion of multiple job holders since the Great Recession.
And on top of that, 5% is still markedly below the 6% of people doing multiple jobs we had in the 1990s.
The moral of the story is that how you frame your data really matters.
That’s it for today. I hope you enjoyed this. We’ll be back next week with more charts.
Cheers,
Nick
P.S. We spend the entire week, countless hours really, doing research, exploring data, surveying emerging trends, looking at charts and making infographics.
Our objective? Deliver to you the most important insights in macroeconomics, Bitcoin and digital assets.
That’s the kind of knowledge you need to make confident investment decisions. The kind that deliver returns.
In any given year the difference between the lowest and the highest Bitcoin price is more than 100%. If you just follow the price action blindly you are unlikely to profit from that.
Placing crypto in the macroeconomic context give you confidence that you are not missing the big picture.
Looking at what the data is really telling us guarantees you aren't falling for false narratives.
Both aspects are essential parts of the toolkit of the crypto investor.
If you want access to all of it upgrade to a paid membership right now.


please create a graph of net liquidity
FED Balance Sheet Assets: $7.9 trillion. (-) RRP: $1.1 trillion (-) TGA: $.8 trillion
=
Net Liquidity: $6 trillion
If Treasury issues $1.25 trillion of net new Bills in 2024 at a rate above the 5.33% RRP rate, RRP will go to $0, boosting Net Liquidity by $1.1 trillion. If FED drains $70/month via QT, that’s a Net Liquidity DRAIN of $.84 trillion. Adding it all up, over the next 12 months Net Liquidity should rise by $260 billion, or $21.67/month. I think it happens faster, over the next 10 months. But that’s picking nits.Bottom line: liquidity is set to RISE over the next year unless the Fed expands QT and/or Treasury reduces new Bill issuance.
https://twitter.com/TheCarter758/status/1720972561821970537