The ETFs effect applied to Ethereum
Also BlackRock dominating the Bitcoin ETFs game and the US is on the low end of growth
Welcome to the Friday edition of the Ecoinometrics newsletter.
Every week we bring you three of the best charts on the topics of macroeconomics, Bitcoin and digital assets.
Today we'll cover:
The ETFs effect applied to Ethereum.
BlackRock is dominating the Bitcoin ETFs game.
The US is on the low end of growth.
Each topic comes with a small explanation and one big chart. So let’s dive in.
In case you missed it, here are the other topics we covered this week:
If you aren’t subscribed yet, hit the subscribe button, to receive this email every week directly in your inbox:
The ETFs effect applied to Ethereum
The upside of the spot ETFs for Bitcoin didn’t start at the launch in January 2024. Since October of the previous year the likelihood of the approval was climbing and climbing and climbing. That was a big tailwind for BTC even before the official approval.
And now we might be witnessing the same thing going on for Ethereum.
The Ethereum ETFs haven’t launched yet. So there is no real buying pressure from those non-existent funds. But the ruling of the SEC last week has a bunch of investors front running the move.
What’s the effect so far?
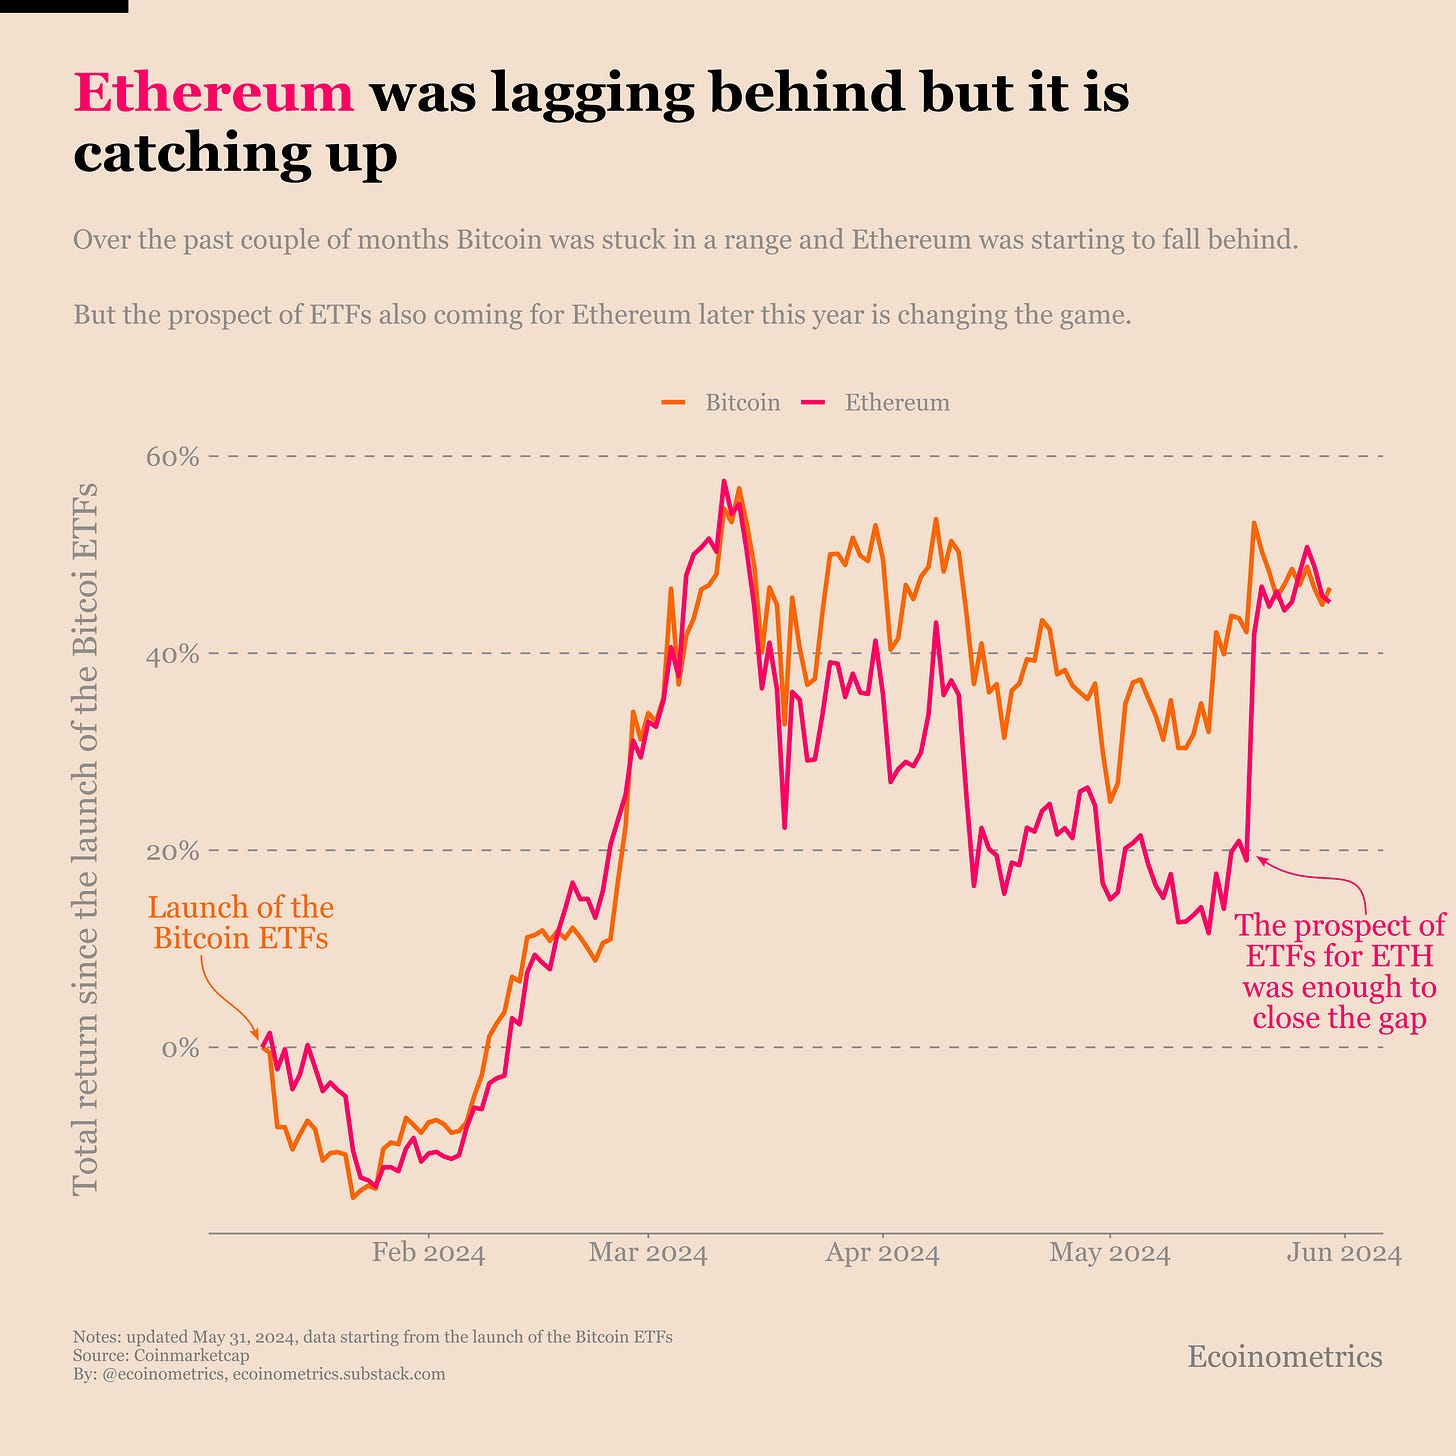
You can get an idea by looking at the chart below. It compares the total returns of Bitcoin and Ethereum since the launch of the Bitcoin ETFs.
After a good start Ethereum was starting to lag behind Bitcoin since mid-March. At some point the gap was 20% wide. Then in one day, as soon as the SEC allowed the Ethereum ETFs the gap closed.
That’s a good sign for ETH.
BlackRock is dominating the Bitcoin ETFs game
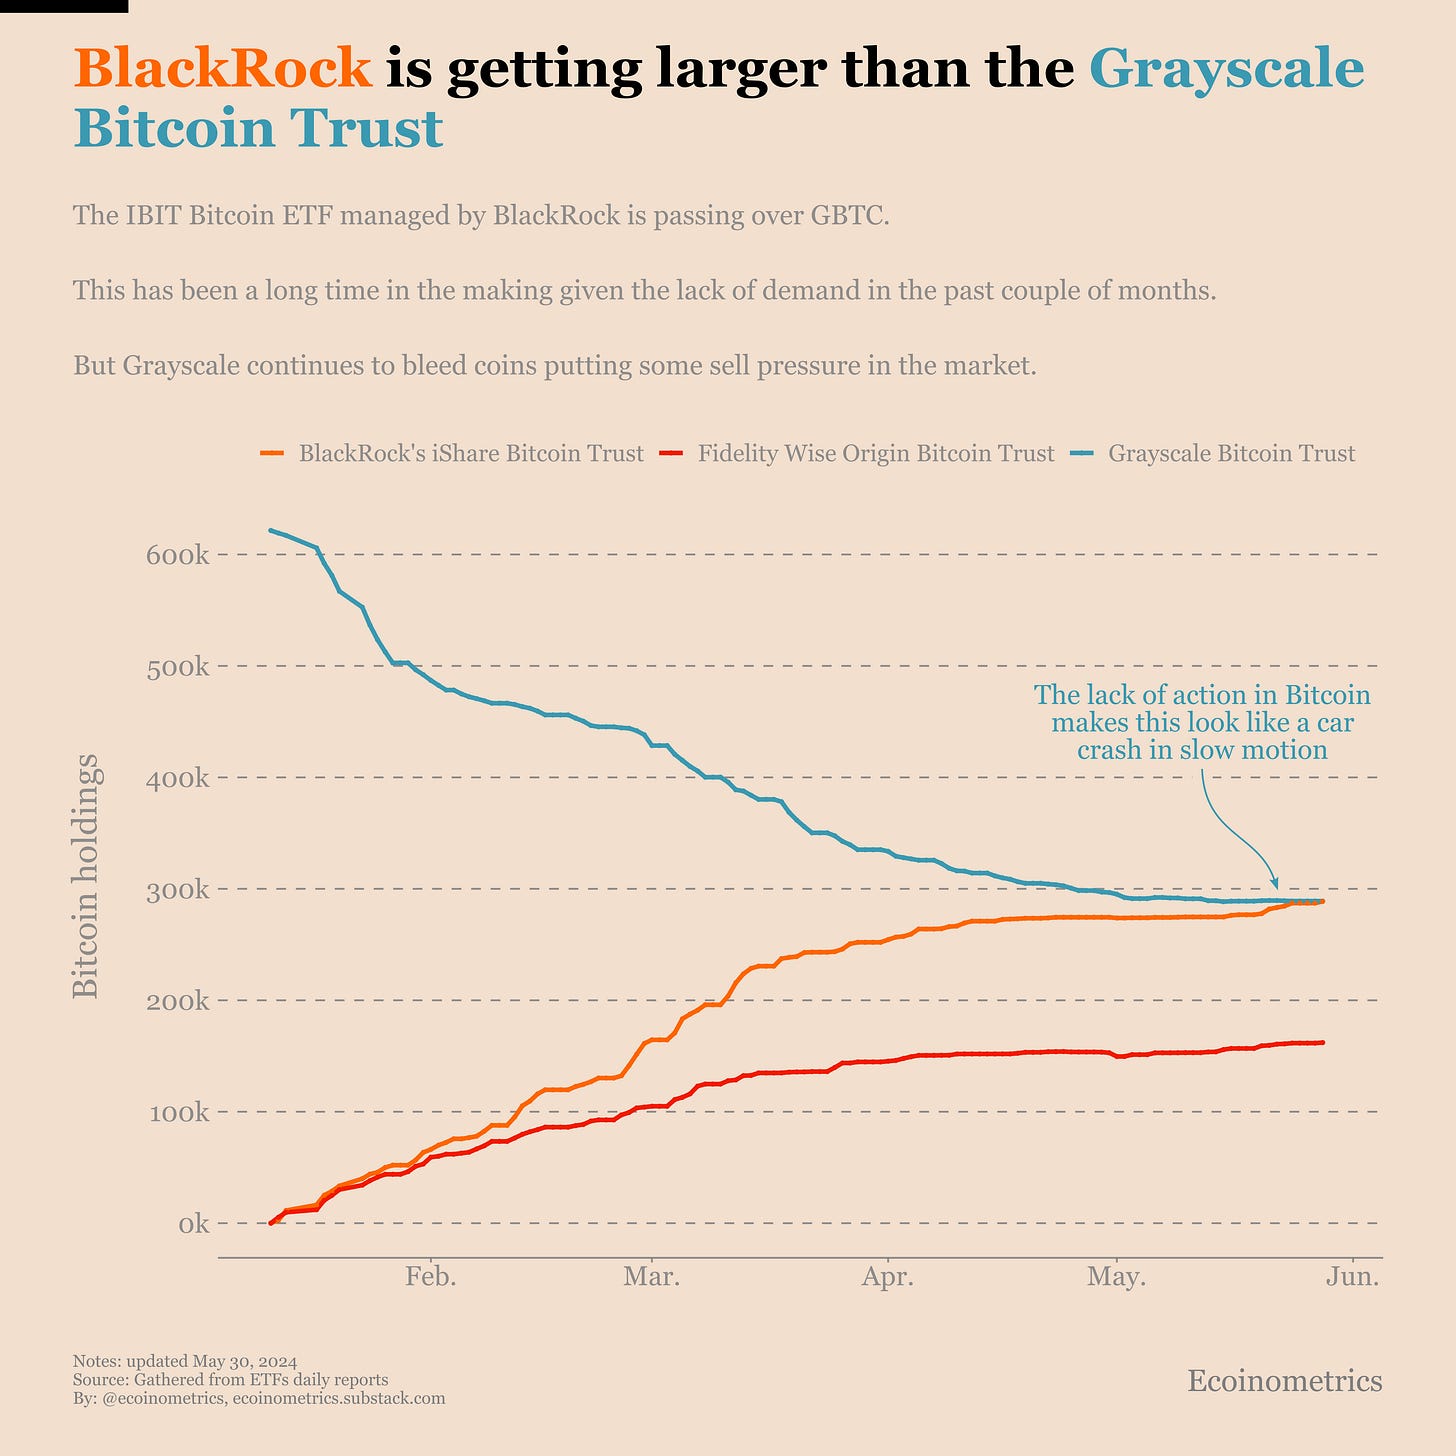
The iShares Bitcoin Trust (IBIT), which is BlackRock’s Bitcoin ETF, is now larger than the Grayscale Bitcoin Trust:
IBIT 289 035 BTC
GBTC 286 969 BTC
That was unavoidable. Grayscale despite trying a few tricks and crossing its fingers has been bleeding coins non-stop since it converted to an ETF.
On the other side you have BlackRock. They sit on a mountain of cash. And they have a keen sense of the institutional demand for Bitcoin from their customer base of traditional investors.
The game isn’t even fair.
The trajectory of these two funds is relevant for the big trend. If GBTC can’t stop the bleeding they constantly apply some sell pressure on Bitcoin. And they still have 300k BTC to get rid of.
That’s for the negative side.
On the other hand the BlackRock Bitcoin ETF is only worth $20B. For comparison that’s 10 times smaller than the market cap of the leading gold ETF (GLD). So clearly there is a lot of potential for growth to push Bitcoin’s price much higher.
Capped downside. Uncapped upside.
The US is on the low end of growth
The US GDP is up 1% in the first quarter of this year. But when you adjust for inflation, the real GDP is only up 0.3%. That’s a pretty big difference.
And +0.3% in terms of real GDP is on the wrong side of the average. You can see that on the chart below which shows the distribution of the real GDP over the last 40 years.
What that means is that most of the growth of the GDP is due to inflationary pressures. The US isn’t producing many more goods and services. But everything is more expensive.
That’s not really the kind of growth you are looking for.
So yes the US economy isn’t in a recession. But it is far from booming either.
That’s it for today. I hope you enjoyed this. We’ll be back next week with more charts.
Cheers,
Nick
P.S. We spend the entire week, countless hours really, doing research, exploring data, surveying emerging trends, looking at charts and making infographics.
Our objective? Deliver to you the most important insights in macroeconomics, Bitcoin and digital assets.
Armed with those insights you can make better investment decisions.
Are you a serious investor? Do you want to get the big picture to get on the big trades? Then click on the button below.


