


Bitcoin at Risk as NASDAQ Posts Rare Decline
Also Bitcoin vs. Gold: March's Risk-Off Market Reveals Crucial Differences & Core Services Inflation: The Fed's Hands Remain Tied

Welcome to Ecoinometrics' Friday edition.
Each week, we analyze the three most critical market signals impacting Bitcoin and macro assets, delivering institutional-grade insights through data-driven charts and analysis.
Today we'll cover:
Bitcoin at Risk as NASDAQ Posts Rare Decline
Bitcoin vs. Gold: March's Risk-Off Market Reveals Crucial Differences
Core Services Inflation: The Fed's Hands Remain Tied
These three sections paint a comprehensive picture of Bitcoin's current challenges: technical market pressure from the NASDAQ's severe correction, Bitcoin's continued correlation with risk assets rather than safe havens, and a Federal Reserve constrained by persistent core inflation amid new tariff concerns. Understanding this convergence of factors is critical for professional investors managing digital asset exposure in today's volatile environment.
In case you missed it, here are the other topics we covered this week:


Essential Decision-Making Tools
Bitcoin Market Monitor - Key Drivers in Five Charts:

Bitcoin Market Forecast - Probability Scenarios & Risk Metrics:

Join more than 31,000 investors and get these professional-grade insights delivered to your inbox:
Bitcoin at Risk as NASDAQ Posts Rare Decline
The NASDAQ 100's 30-day loss is worse than 93% of all declines over the past five years. Given Bitcoin's strong correlation with risk assets, this points to a tough environment ahead. The last two times we saw similar weakness were during the COVID crash and the 2022 bear market.
At the start of the year, before Donald Trump took office and before markets felt the tariff impact, we flagged a potential major headwind for Bitcoin. This headwind is the mean reversion of long-term NASDAQ 100 returns.
Our 4-month-old analysis showed that when NASDAQ 100 returns (12-month rolling) fall below the long-term average, Bitcoin's returns typically shrink too. This also creates a much higher chance for Bitcoin to enter a bearish phase.
This is exactly what we're experiencing right now.
The main cause for recent stock market troubles is Donald Trump's trade war and the recent tariff shock.
Months of uncertainty had already weakened growth. Then the broad application of global tariffs hit the market hard.
The chart below shows negative 30-day returns for Bitcoin and the NASDAQ 100 over the last 5 years (starting from the COVID period). Each dot represents a time when returns were negative over a 30-day period. We've highlighted the current 30-day period.
The NASDAQ 100's correction over the last 30 days is worse than 93% of all corrections in the past 5 years. It now matches the severity of the COVID crash and the 2022 bear market.
The risk of inflation from tariffs makes it difficult for the Federal Reserve to step in with supportive measures.
This situation could persist without relief and continue to pressure Bitcoin. For now, Bitcoin is holding steady thanks to neutral ETF flows over recent weeks. As long as we avoid major ETF outflows, our model indicates $70,000 should remain a stable support level.
However, if this NASDAQ 100 correction develops into a liquidity crisis, all bets are off and a bearish scenario becomes highly likely.

Bitcoin vs. Gold: March's Risk-Off Market Reveals Crucial Differences
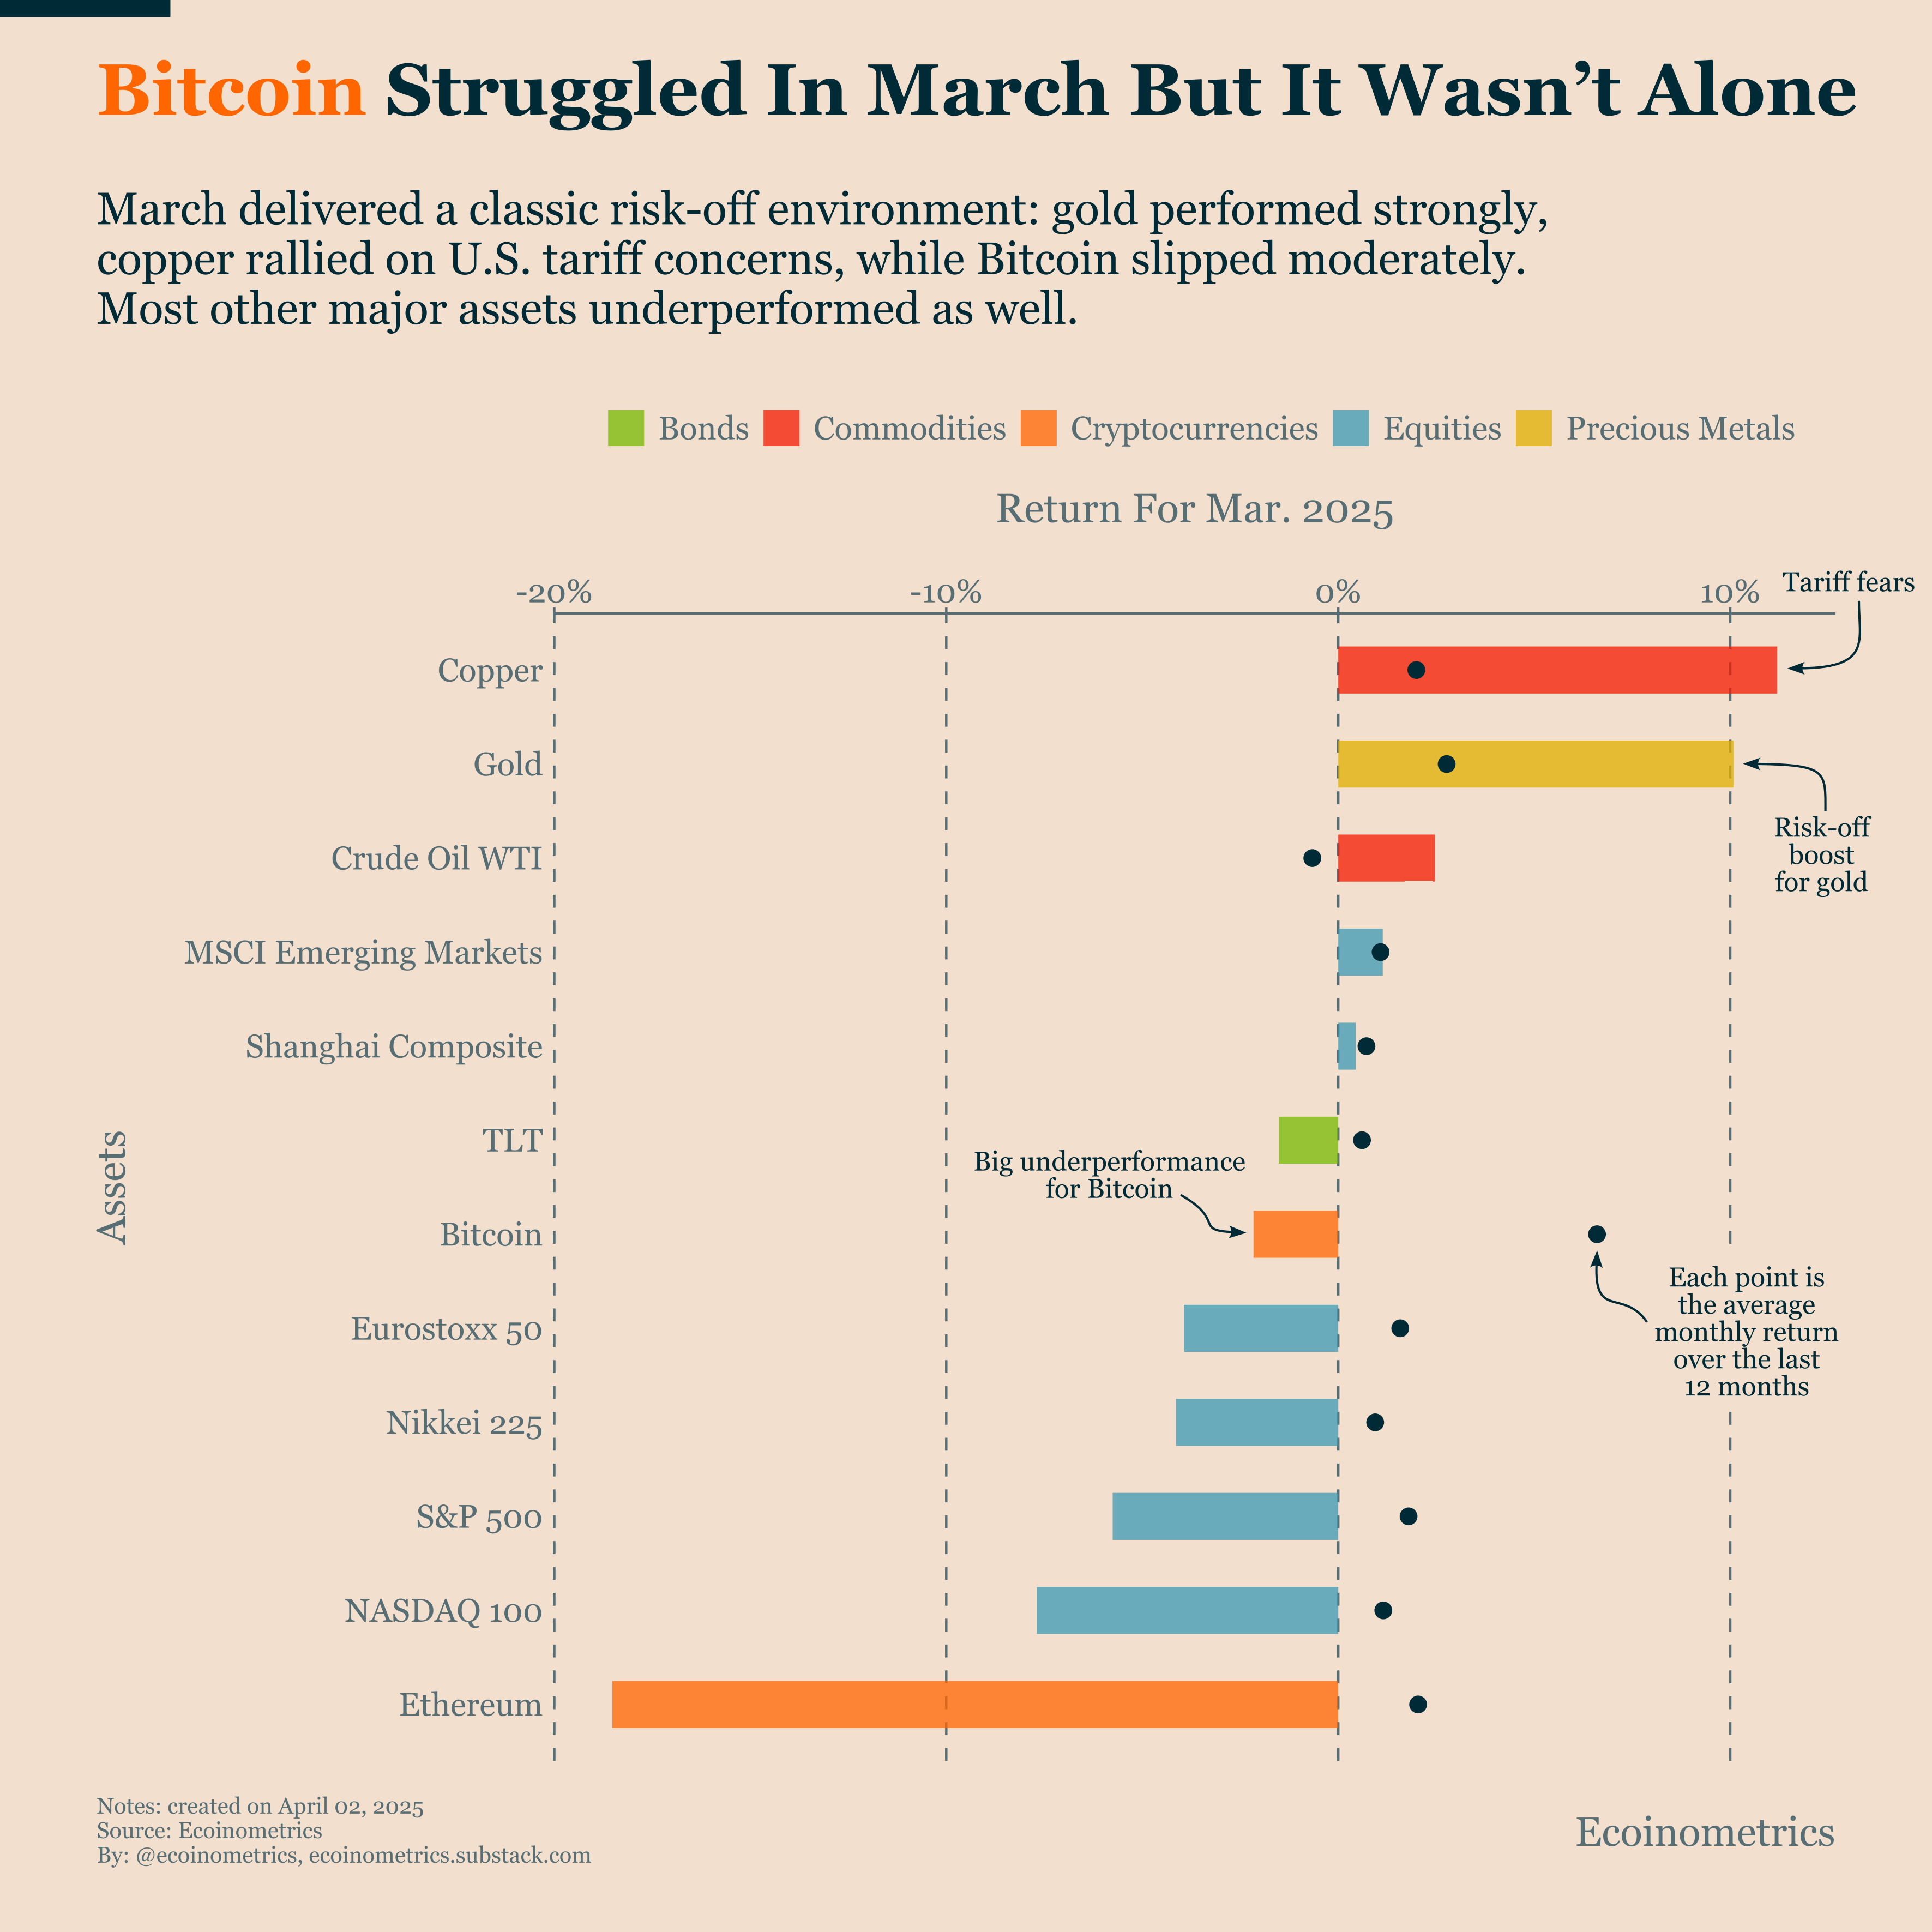
March delivered a classic risk-off environment: gold performed strongly, copper rallied on U.S. tariff concerns, while Bitcoin slipped moderately. Most other major assets underperformed as well.
The chart below shows Bitcoin's performance and that of other major macro assets in March. For each asset, the dot represents the average monthly return over the last 12 months as a point of comparison.
Looking at these assets side by side makes the macro picture crystal clear.
Yes, Bitcoin struggled in March, but it wasn't alone.
What March delivered is a classic risk-off environment.
Gold performed strongly. It did extremely well compared to its monthly average - typical safe-haven behavior during uncertain times.
Copper also did very well, but this is a direct effect of trade war fears. There's high demand for copper before tariffs make it more expensive to import.
Emerging markets did ok - nothing exceptional.
But everything else did poorly. Ethereum performed extremely badly, as usual. The stark difference between Bitcoin and gold returns makes it clear they aren't the same type of asset. Investors don't use these two assets in the same way. This has big implications for portfolio risk management.
The market is clearly in risk-off mode. You should be concerned about the selling pressure the stock market might put on Bitcoin in the near term.
Core Services Inflation: The Fed's Hands Remain Tied
As long as core services inflation isn't trending lower, the Federal Reserve's hands are tied. In this environment, the Fed is unlikely to inject the kind of liquidity that would support a new bull market for Bitcoin.
Last month PCE inflation showed something interesting: a softening of inflation in core services.
Unfortunately, one data point doesn't make a trend. The March print reveals that the US has not entered a period of sharp decline in core services inflation.
This is a key problem. It connects wages, service prices, and labor market conditions.
Services inflation shows no clear sign of moving towards pre-COVID levels. Meanwhile, US tariffs will likely create additional inflation pressure on goods.
The Federal Reserve is now stuck. Their current plans include:
Small rate cuts
Ending balance sheet reduction
They're making these moves before inflation is truly under control. This is already bold compared to their goal of 2% inflation.
With new tariff impacts looming, don't expect the Fed to also rescue the stock market during this correction.
This means stocks have room to fall further and will likely drag Bitcoin down too.

That's it for today. Thanks for reading.
Cheers,
Nick
P.S. Every week, our team conducts extensive research analyzing market data, tracking emerging trends, and creating professional-grade charts and analysis.
Our mission: Deliver actionable macro and Bitcoin insights that help institutional investors and financial advisors make better-informed decisions.
Ready for institutional-grade research that puts you ahead of the market? Click below to access our premium insights.
What about the website showing real-time inflation?
https://truflation.com/
Don't you think there's a connection between the average cost of Bitcoin and its price remaining stable?
https://en.macromicro.me/charts/29435/bitcoin-production-total-cost