


Bitcoin ETF Flows: Too Weak to Drive Prices Higher
Also Ethereum's Performance Gap: 451% vs 109% & Fed Language Signals Potential Pause in Rate Cuts

Welcome to the Friday edition of the Ecoinometrics newsletter.
Every week we bring you the three most important charts on the topics of macroeconomics, Bitcoin and digital assets.
Today we'll cover:
Bitcoin ETF Flows: Too Weak to Drive Prices Higher
Ethereum's Performance Gap: 451% vs 109%
Fed Language Signals Potential Pause in Rate Cuts
Each topic comes with a small explanation and one big chart. So let’s dive in.
In case you missed it, here are the other topics we covered this week:


Checkout the Bitcoin Market Monitor to understand what’s driving the market in just five charts:

Read the Bitcoin Market Forecast for the probabilities of key scenarios and the essential risk metrics to manage your portfolio:

If you aren’t subscribed yet, hit the subscribe button, to receive this email every week directly in your inbox:
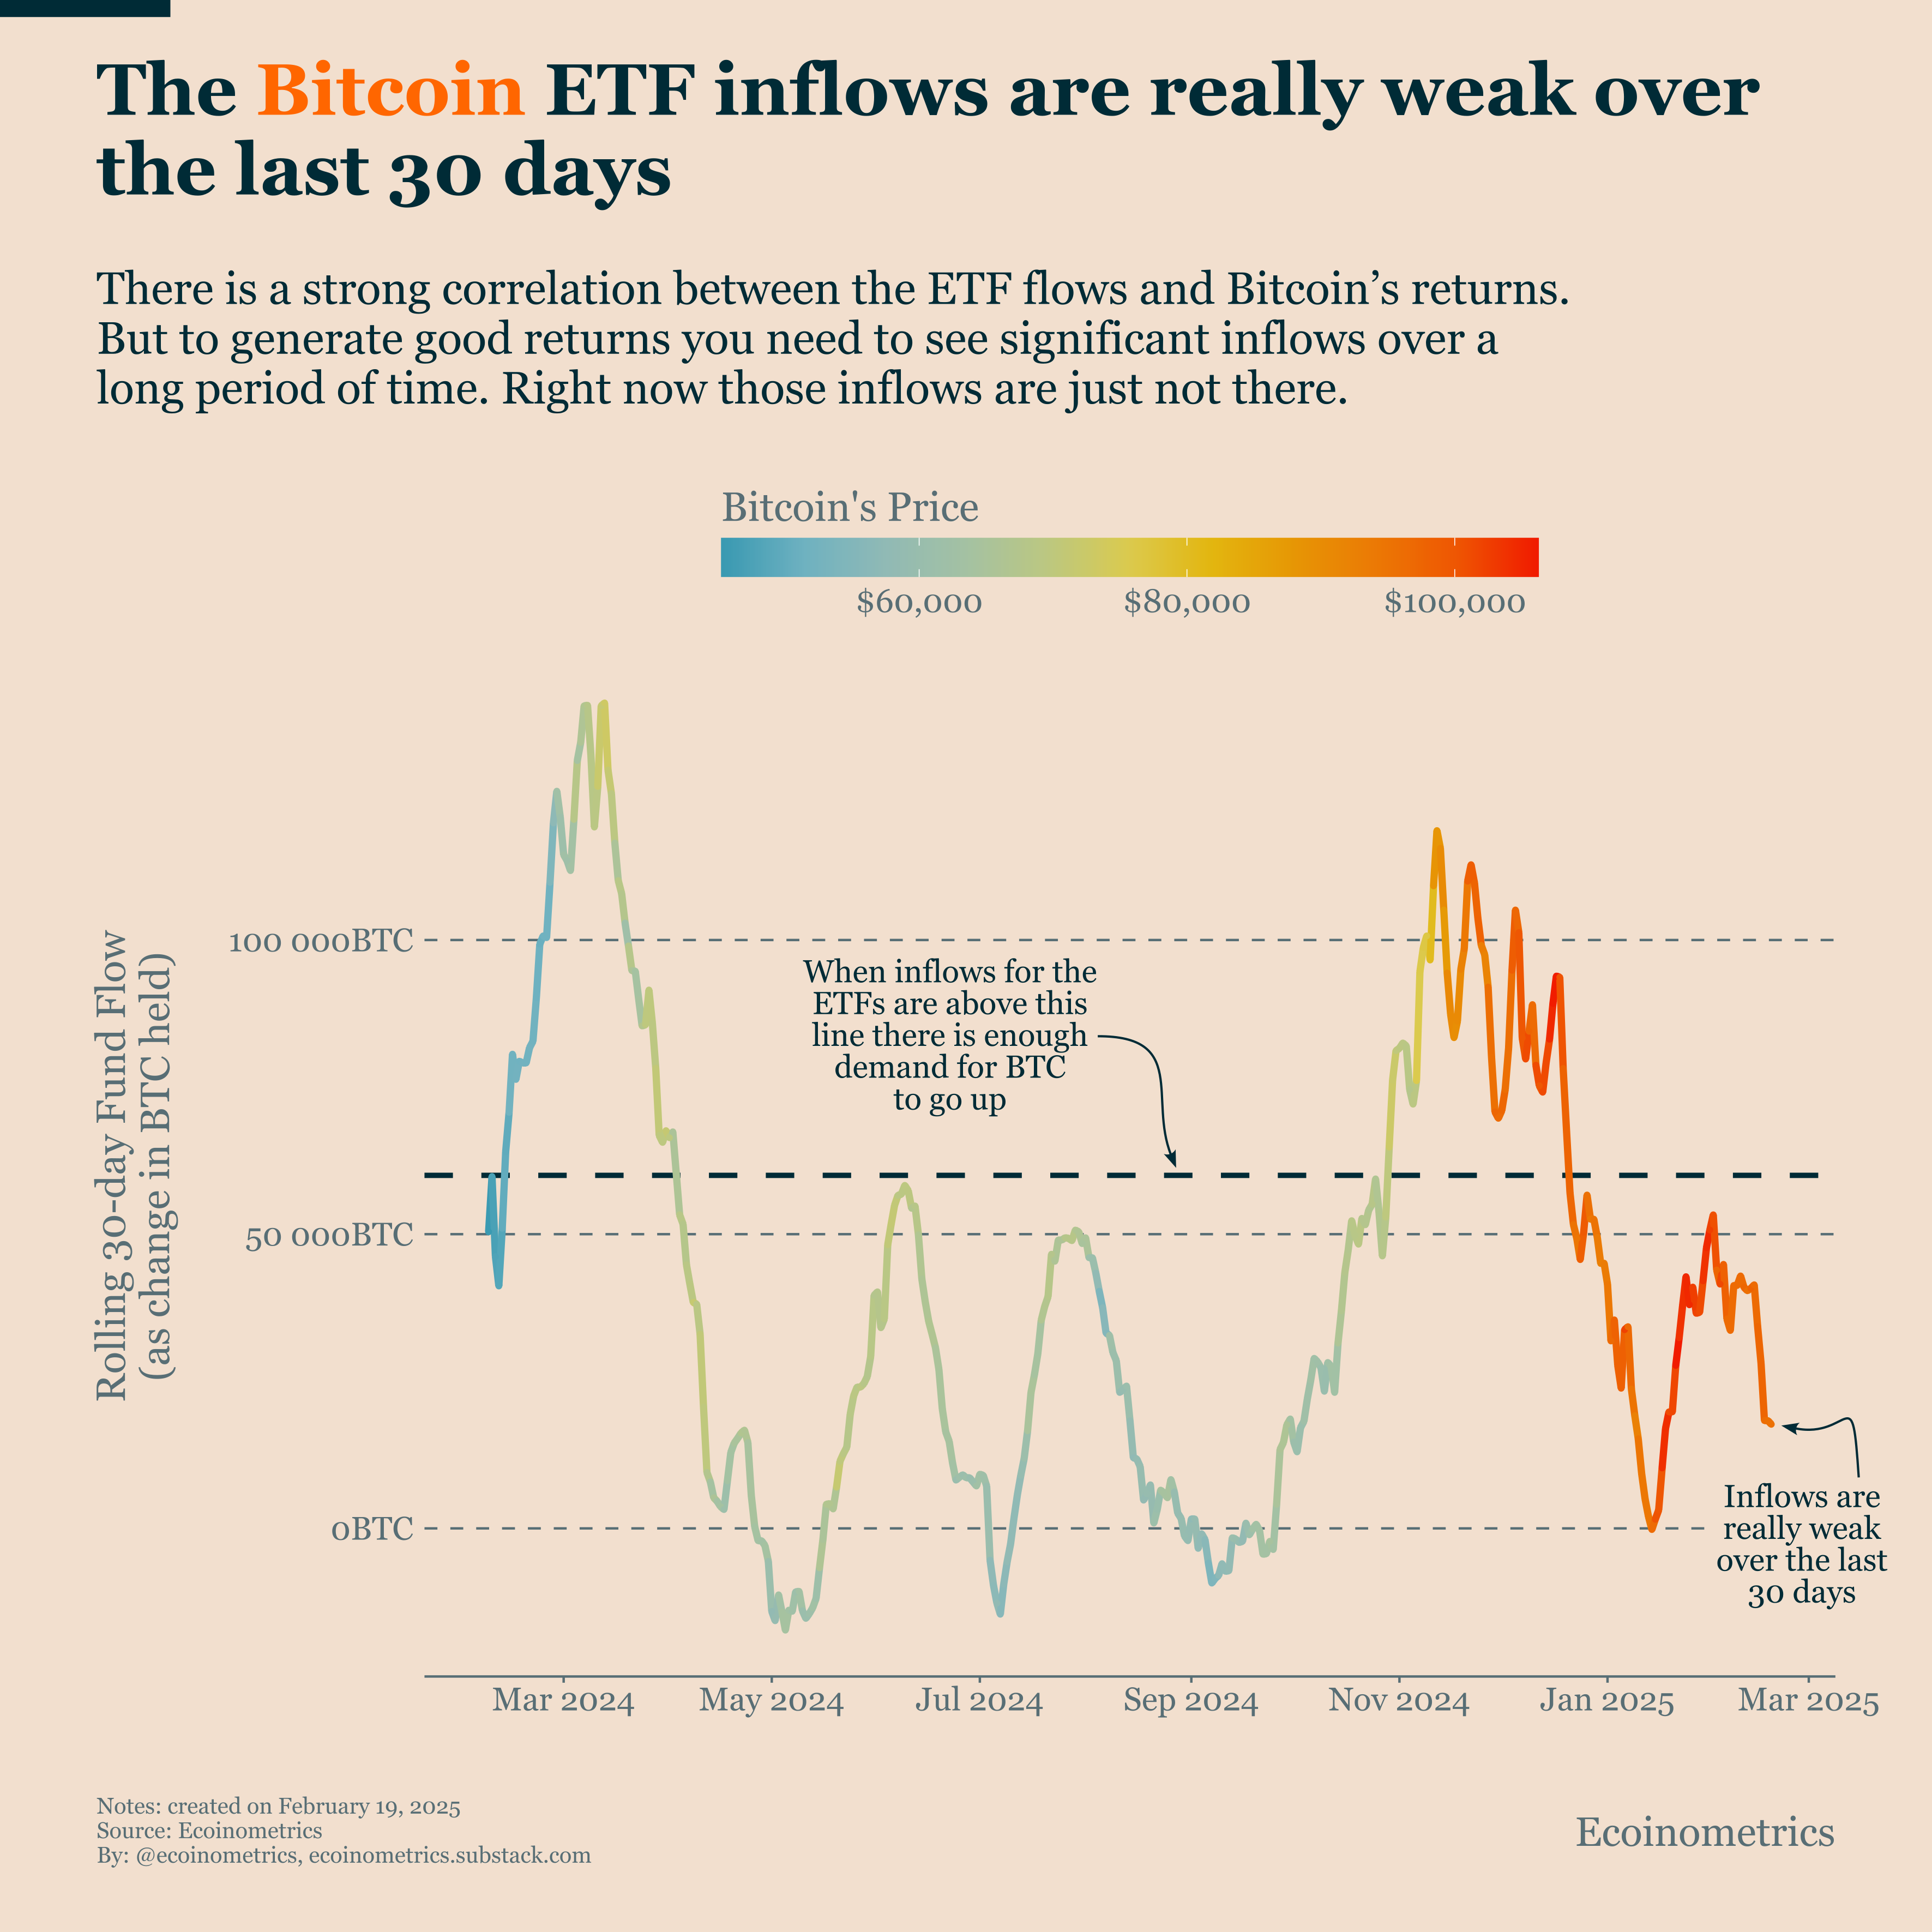
Bitcoin ETF Flows: Too Weak to Drive Prices Higher
Bitcoin's price has been remarkably stable, trading in a narrow range between $93,000 and $100,000 since early February.
But this stability makes sense when you look at recent ETF flows.
Over the last 30 days, net flows have dropped to just 17,000 BTC. This is well below the 60,000 BTC threshold typically needed to drive consistent price increases.
The chart clearly shows this pattern: periods when flows fall below this threshold (as shown by the dashed line) consistently correspond to Bitcoin price stagnation.
Overall ETF flows have been the primary driver of Bitcoin's trends since their launch last year (which is obvious when you look at the on-chain activity).
The current slowdown in activity isn't surprising, given two major uncertainties:
Questions about U.S. monetary policy (see our third chart today)
Investors evaluating potential impacts of Trump administration policies
Until these uncertainties clear up, Bitcoin is likely to remain rangebound.
Ethereum's Performance Gap: 451% vs 109%
Bitcoin's investment thesis is straightforward, the growth scenarios are clear. For other digital assets, including Ethereum, the picture is more complex.
During the last bull market, Ethereum was outpacing Bitcoin so dramatically that many predicted the "flippening”, the moment when Ethereum's market cap would surpass Bitcoin's.
At the time that wasn’t an outlandish scenario at all. Ethereum functions as a platform. That means it derives its value from its ecosystem of applications (smart contracts, DApps, and Layer 2 solutions). This is very different compared to Bitcoin's "digital gold" narrative.
So the Web3 vision offered a compelling growth path for Ethereum. The problem is that today's reality is different. Web3 developers continue to work but we are not seeing many large-scale applications driving substantial network activity.
The result? Ethereum remains correlated with Bitcoin but shows an asymmetric pattern: limited upside during Bitcoin rallies and steeper declines during corrections.
This has led to a stark performance gap, Bitcoin is up 451% from the bear market bottom, while Ethereum has gained just 109%.

Fed Language Signals Potential Pause in Rate Cuts
The January FOMC meeting minutes were released this week. Using our proprietary Fed Communication Index, which analyzes the language patterns in FOMC statements, we've identified a clear shift in tone.
The latest meeting was notably hawkish, reversing a trend that began in 2023. Throughout last year, the Fed gradually softened its language, even before discussing rate cuts. By November, our index showed communication had returned to neutral and appeared headed toward dovish territory.
So the current hawkish reading is particularly significant as it matches levels seen just before previous major policy pivots.
Three key factors are driving this hawkish shift:
Persistent inflation showing no improvement
Continued strength in the labor market (which makes it hard for core inflation to come down)
Uncertainty around the impact of Trump administration policies (which could impact prices in the US)
This change in tone has significant implications.
It signals the Fed may implement a longer pause in rate cuts than markets expect. If conditions don't improve, there's even a possibility of returning to rate hikes.
That would be bad for Bitcoin.

That’s it for today. I hope you enjoyed this. We’ll be back next week with more charts.
Cheers,
Nick
P.S. We spend the entire week, countless hours really, doing research, exploring data, surveying emerging trends, looking at charts and making infographics.
Our objective? Deliver to you the most important insights in macroeconomics, Bitcoin and digital assets.
Armed with those insights you can make better investment decisions.
Are you a serious investor? Do you want to get the big picture to get on the big trades? Then click on the button below.
You say that fed pausing rate cuts, or even raising, would be bad for Bitcoin. Wasn’t the fed raising rates during the 2017 Bitcoin bull market?
Superb work as usual! Thank you very much for sharing! I intend to feature your work in this week's edition of CryptoCurated! ♥️☀️☮️🌈🏁