Ecoinometrics - Looking at the top
November 24, 2021
Here is a simple strategy: buy the bottom, sell the top… of course. But is there any specific metric that can be used to characterize the Bitcoin tops?
The Ecoinometrics newsletter decrypts the place of Bitcoin and digital assets in the global financial system. If you want to get an edge in understanding the future of finance you only have to do one thing, click on the subscribe button right below:
Done? Thanks! That’s great! Now let’s dive in.
Looking at the top
Now let me preface all this by saying that consistently timing the market is something out of reach for most traders. Unless you are doing this professionally you better stick to betting on long term trends and managing your risk.
That being said, I'm not your mom. So if you want to try and time the top for profit taking (or going short if you are really daring) you can come up with some strategy.
The first step in such strategy is most likely to ask how we can figure out if we have reached a price top.
Now a price top isn't very specific, it kind of depends on the time frame. Are you looking to identify the top over a time window of a few hours, a few days or a few months?
It feels like depending on the time frame we should be looking at totally different parameters.
If this isn’t the first time you read this newsletter then you’ll know that I typically don’t deal in short time frames. So we might as well go big.
Is it possible to identify the top of a Bitcoin halving cycle by looking at some metrics?
Maybe.
To figure that out let’s pick a set of local maxima to see if there is something specific to the ones that correspond to a cycle top.
You can see my selection on the chart below where the local maxima are broken down in five groups (plus today’s price which is not a top for comparison purposes):
Cycle tops, for the 1st and 2nd cycle.
April 2013 top, which is the mid cycle top of the 1st cycle.
April 2021 top, which was the all-time high earlier this year before the lengthy correction.
Not a cycle top, which are just local tops that have been followed by significant corrections.
All-time high, which was established earlier this month.
So the game is, can we find some metrics whose value on the day of the cycle tops (red) stands out?
Let’s go through the usual suspects.
Do we see cycle tops when the market is overextended? Said differently, are Bitcoin cycle tops happening when the price is running too far ahead of its long term trend?
The answer is yes. If you look at the price multiple over its 200 days moving average (aka the Mayer multiple for BTC) the previous cycle tops as well as the mid cycle top of 2013 definitely stand out.
All the other price maxima in my sample have a multiple lower than 3. And incidentally both the top of April 2021 and the recent all-time high are falling in the category of “not a cycle top”.
That’s good.
Do we see cycle tops when hodlers are sitting on massive unrealized gains? It could be the case that at a certain point too many hodlers want to take profit and that’s what causing the market to crash.
We can track that using on-chain data by looking at the market value to realized value ratio. The higher this ratio, the more hodlers positions are in profit.
Check it out.
This works pretty well again. The red dots are up and to the right while most of the local tops happen for smaller ratios. The difference isn’t as striking as for the 200 days multiple but still. At least a high MVRV is a warning sign.
Note that the recent all-time high is totally within the range of the “non cycle tops”.
Next.
Is it true that cycle tops happen when very few hodlers are stacking coins? You could argue that the final price spike in a Bitcoin cycle is purely driven by retail FOMO on exchanges, i.e. something that isn’t backed by actual long term hodlers.
In that case the accumulation score (or participation score) which is close to 1 when lots of people are stacking sats on-chain and close to 0 when no-one is buying should be smallish at the top.
Well, it isn’t. See for yourself.
Actually, on the day of the tops you can see that the accumulation score is all over the place. And for the cycle tops themselves it actually falls around the middle of the range.
So at least if you are looking at this score on a single day, it doesn’t tell you that much.
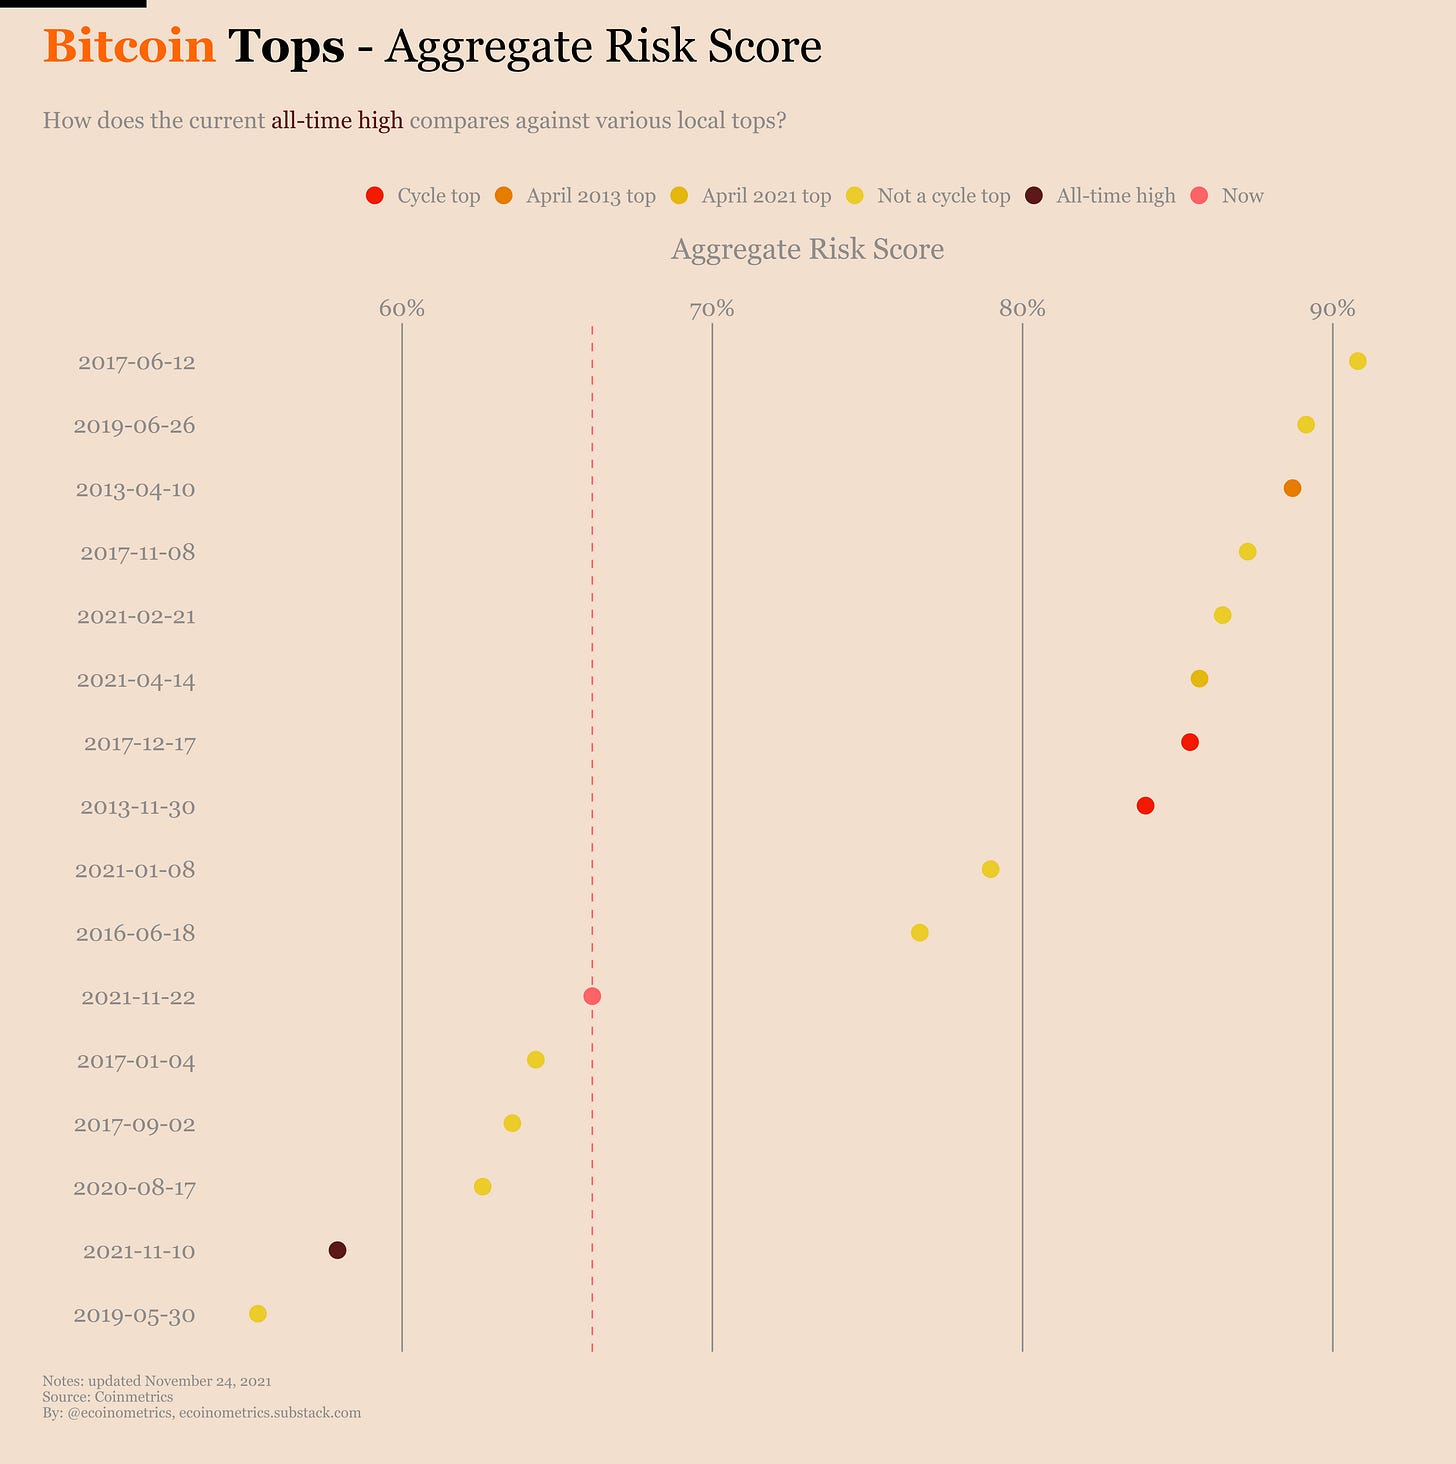
Is it the same story for the aggregate risk score? We made up the aggregate risk score to figure out whether or not Bitcoin is overheating. It basically looks at a range of metrics, measures how high they are compared to their historical distribution and creates a weighted average out of that.
When the aggregate risk score is close to 100% Bitcoin is running hot. So how high was this score on the day of the previous tops.
Check it out.
Yes the aggregate risk score was high on the day of the tops for the previous cycles. But to be fair it was pretty high on a good number of the other local price maxima.
Interestingly when Bitcoin reached a new all-time high earlier this month the risk score was NOT high at all. In my opinion that’s a good sign. It probably means that we haven’t seen the end of this bull run.
Of course it could be that the market is changing as Bitcoin matures. It could be that we are not going to see those crazy parabolic moves anymore. It could be that volatility overall is coming down now that institutional players have entered the field.
That’s possible.
But at least until Bitcoin manages to reach a market size on par with financial gold (about $2.5 trillion) that’s not my default position. Here is the reasoning.
Bitcoin is programmatically scarce so not everyone can get their hands on it.
At the same time the natural market for Bitcoin as a store of value should be at least the size of the financialized part of the previous global store of value which is gold.
That means we can confidently say not everyone that might want to own Bitcoin as a store of value already does. Said differently there is untapped demand.
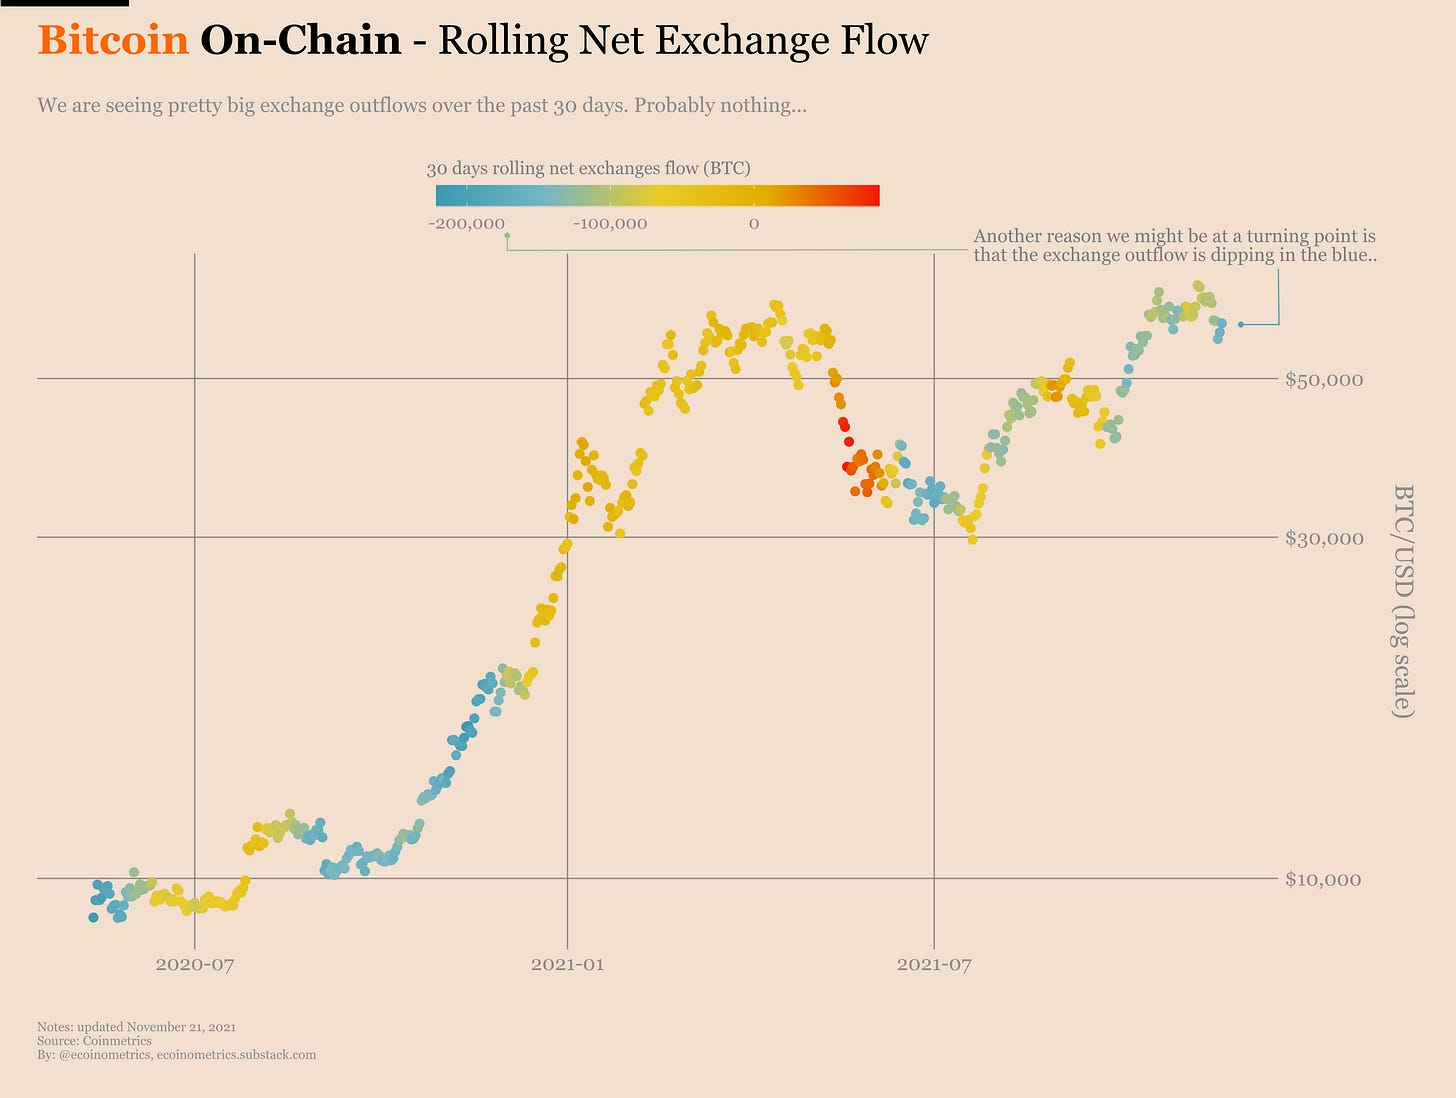
But coins continue to flow out of exchanges at great speed. So as soon as the untapped demand wakes up it will be met with a low available supply. That’s a recipe for parabolic moves.
Which is why I don’t think we have seen the top of this cycle and why I also think that there is space for exponential growth.
Back to the question of characterizing the tops, I’ve heard it said many times that in financial markets:
The top is a process.
The bottom is an event.
I.e. bottoms typically happen fast and lead to v-shape recoveries while it takes time for the price to stall and develop a top before things come crashing down.
There is probably truth to that so instead of focusing on a set of metrics for a single day to spot a Bitcoin cycle top it might be wiser to look at how those metrics trend and manage your risk accordingly rather than aiming for a perfect timing.
Your call.
That’s it for today. If you have learned something please subscribe and share to help the newsletter grow.
Cheers,
Nick


