
Ecoinometrics - November 04, 2020
Decoupling...

One of the most interesting aspects of Bitcoin is that it is several things at the same time: a network, a store of value, an asymmetric bet…
Because of that it has a dynamic of its own.
We are about to see that play out during this halving cycle.
The Ecoinometrics newsletter decrypts Bitcoin’s place in the global financial system. If you want to get an edge in understanding the future of finance you only have to do two things:
Click on the subscribe button right below.
Follow Ecoinometrics on Twitter at https://twitter.com/ecoinometrics.
Done? That’s great! Thank you and enjoy.
Decoupling
Stonks always go up. Everybody knows that right? Well that's true when you price them in good old fashioned US$.
But priced in Bitcoin the picture is rather different. It is more like stonks always go down.
Since 2012 the SP500 is up about 200% in US$. Meanwhile:
In 2012, at the time of the 1st halving, the SP500 was at 115 BTC.
Fast forward to the 2nd halving and the SP500 was down to 3.3 BTC.
Add 4 years to that and the SP500 is at 0.242 BTC.

It’s just hard to keep up with Bitcoin. Gold cannot match its growth... The stock market cannot match its growth...
So you can’t really avoid it. If you have stocks and gold in your portfolio you have to consider Bitcoin too.
And the best thing is that it comes without drawbacks. What I mean by that is over long enough periods of time Bitcoin is an uncorrelated asset.
That’s true for its correlation with gold. And that’s also true for its correlation with the stock market.
Take a look.

Over the 1st halving cycle the correlation comes out at -3%. Over the 2nd halving cycle the correlation comes out at 16%.
Remember:
A correlation close to 100% means that both assets tend to move together in the same direction.
A correlation close to -100% means that both assets tend to move together in opposite directions.
A correlation close to 0% means that both assets are doing their own things.
On that scale -3% or 16% basically means uncorrelated.
What about now? We are about 6 months in this 3rd halving cycle and the correlation over that period is sitting at 33%.
This is higher than usual but not that high.
And it can easily be understood by considering the events of this year.
The main driver of the price action for all assets this year has been the stock market crash in March.
When the stock market took a dive, leveraged traders were hit by margin calls. To come up with the required cash to face those margin calls they sold their other assets, Bitcoin and gold among them.
Everything went down at the same time.
Then the Fed put came to support the stock market and suddenly everything started to recover at the same time, Bitcoin and gold included.
The result is a sequence where all assets have been pushed by the same underlying force. Naturally that leads to higher correlations than you can expect on average.
But the decoupling is coming. To understand that you have to realize that there are three main driving forces in the Bitcoin market:
The background push of the debasement of fiat currencies.
The adoption curve.
The supply shock generated after each halving.
By and large the debasement of fiat currencies is affecting all financial assets. Another way to think of it is that it’s simply asset price inflation.
But the adoption curve and the halving are specific to Bitcoin. These are the forces that give Bitcoin its own dynamic.
We are about to see those forces in action.
The supply shock of the halving tends to produce its effect within the first two years of the cycle. We are 6 months in.
Adoption is growing by the day. Not only public companies like MicroStrategy and Square are adopting Bitcoin as a reserve asset, but institutional players are also changing their minds. Fidelity, JPMorgan, PayPal… they all seem to be finally on board with Bitcoin as a financial asset.
Put the pressure of a supply shock together with a push in adoption and you have a good recipe for price appreciation.
And with Bitcoin we are talking about a massive potential for price appreciation.
As we have seen last week Bitcoin is digital gold but it is only 2.4% the size of the actual gold market.
When you compare it to individual stocks the market cap of Bitcoin is clearly far from its potential.
With a market cap of $260 billion Bitcoin is like a big stock when placed among the largest stocks traded in the US.
It is on par with Visa, JPMorgan, Mastercard… but still one order of magnitude smaller than the tech giants Apple, Microsoft, Google.
At the end of this cycle though we’d expect Bitcoin to be up 10x.
That would make it the largest point on this graph.

The point is investing in Bitcoin is an asymmetric bet. You don’t need to risk much to get outsized returns.
So jump on board and be prepared for the rocket ship to take off.
CME Bitcoin Derivatives
The October contract expired last Friday with a record 43% of the calls ending up in the money. But except for that there hasn’t been much activity on the CME Bitcoin derivatives.
BTC is just at the edge of $14,000 but it has been unable to move above that hurdle convincingly.

And after the spike in volume surrounding the rollover we are back down to a baseline of about 25,000 BTC worth of contracts traded on a daily basis.
That’s nothing to write home about.

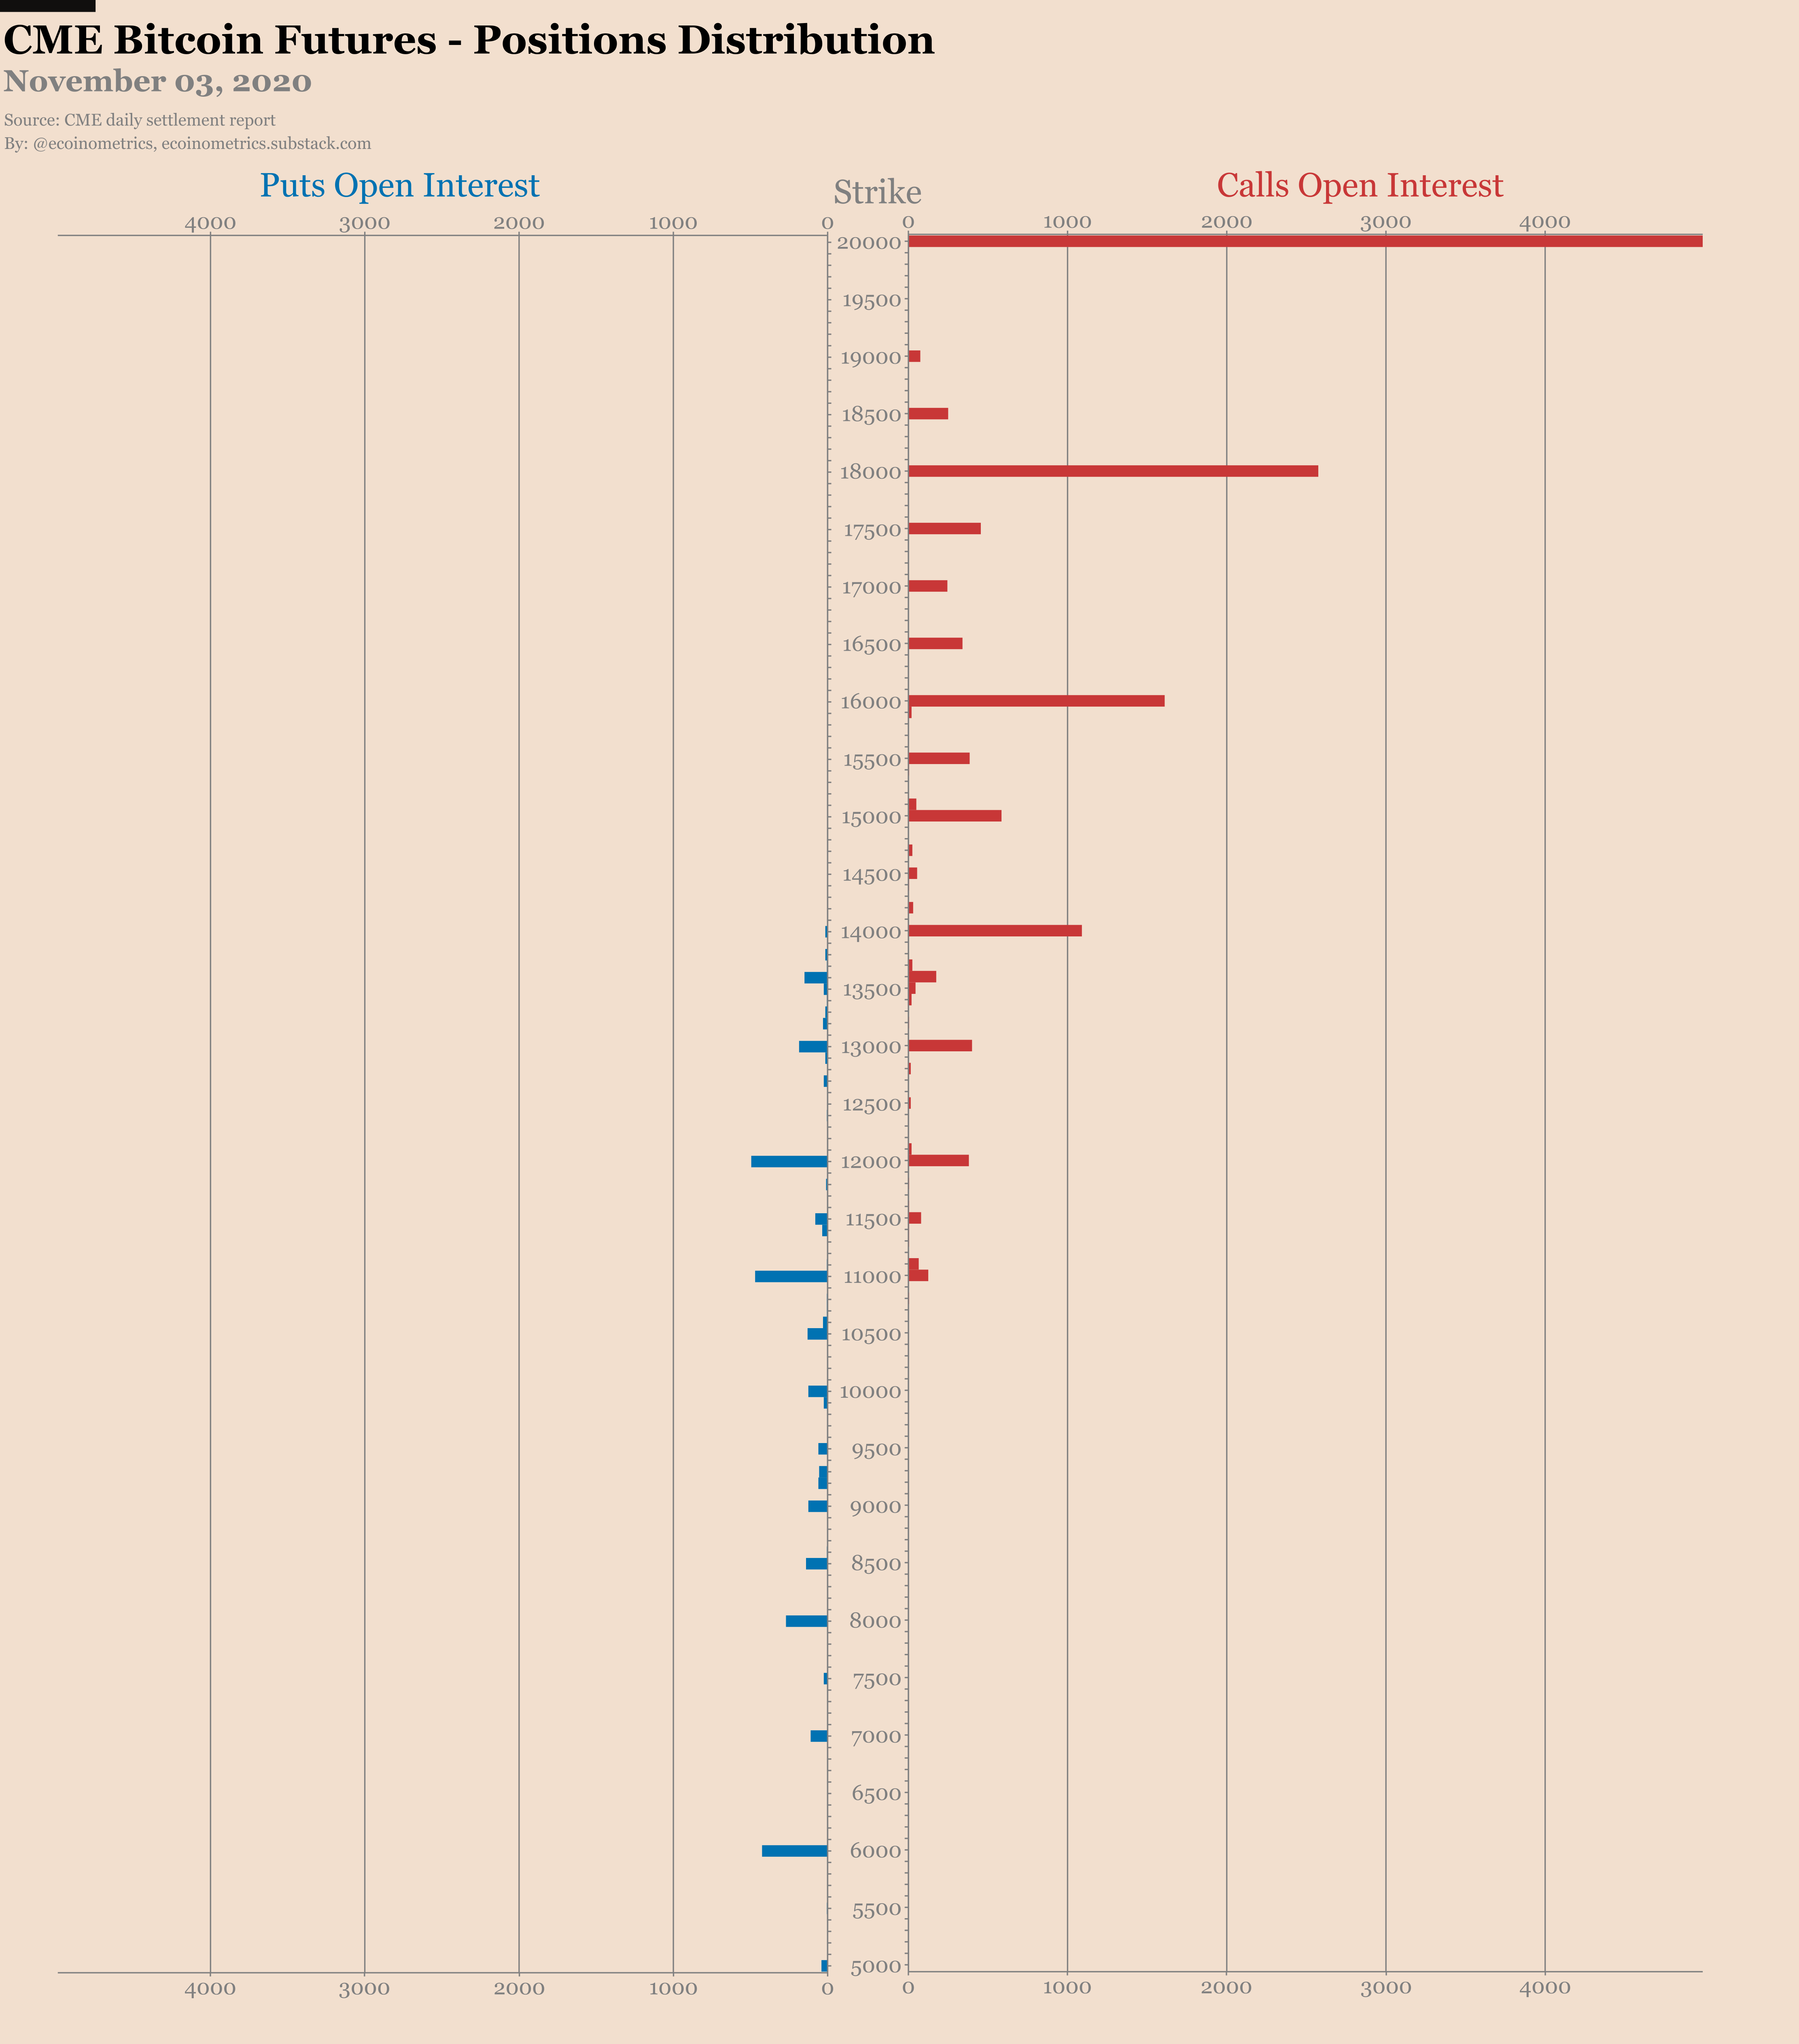
The options market is as always skewed bullish with 9 calls for every 2 puts.
It is worth noting that the next big strike for the calls is now $20k with about 5,000 BTC worth of open contracts there. A quarter of those contracts are due to expire at the end of November.

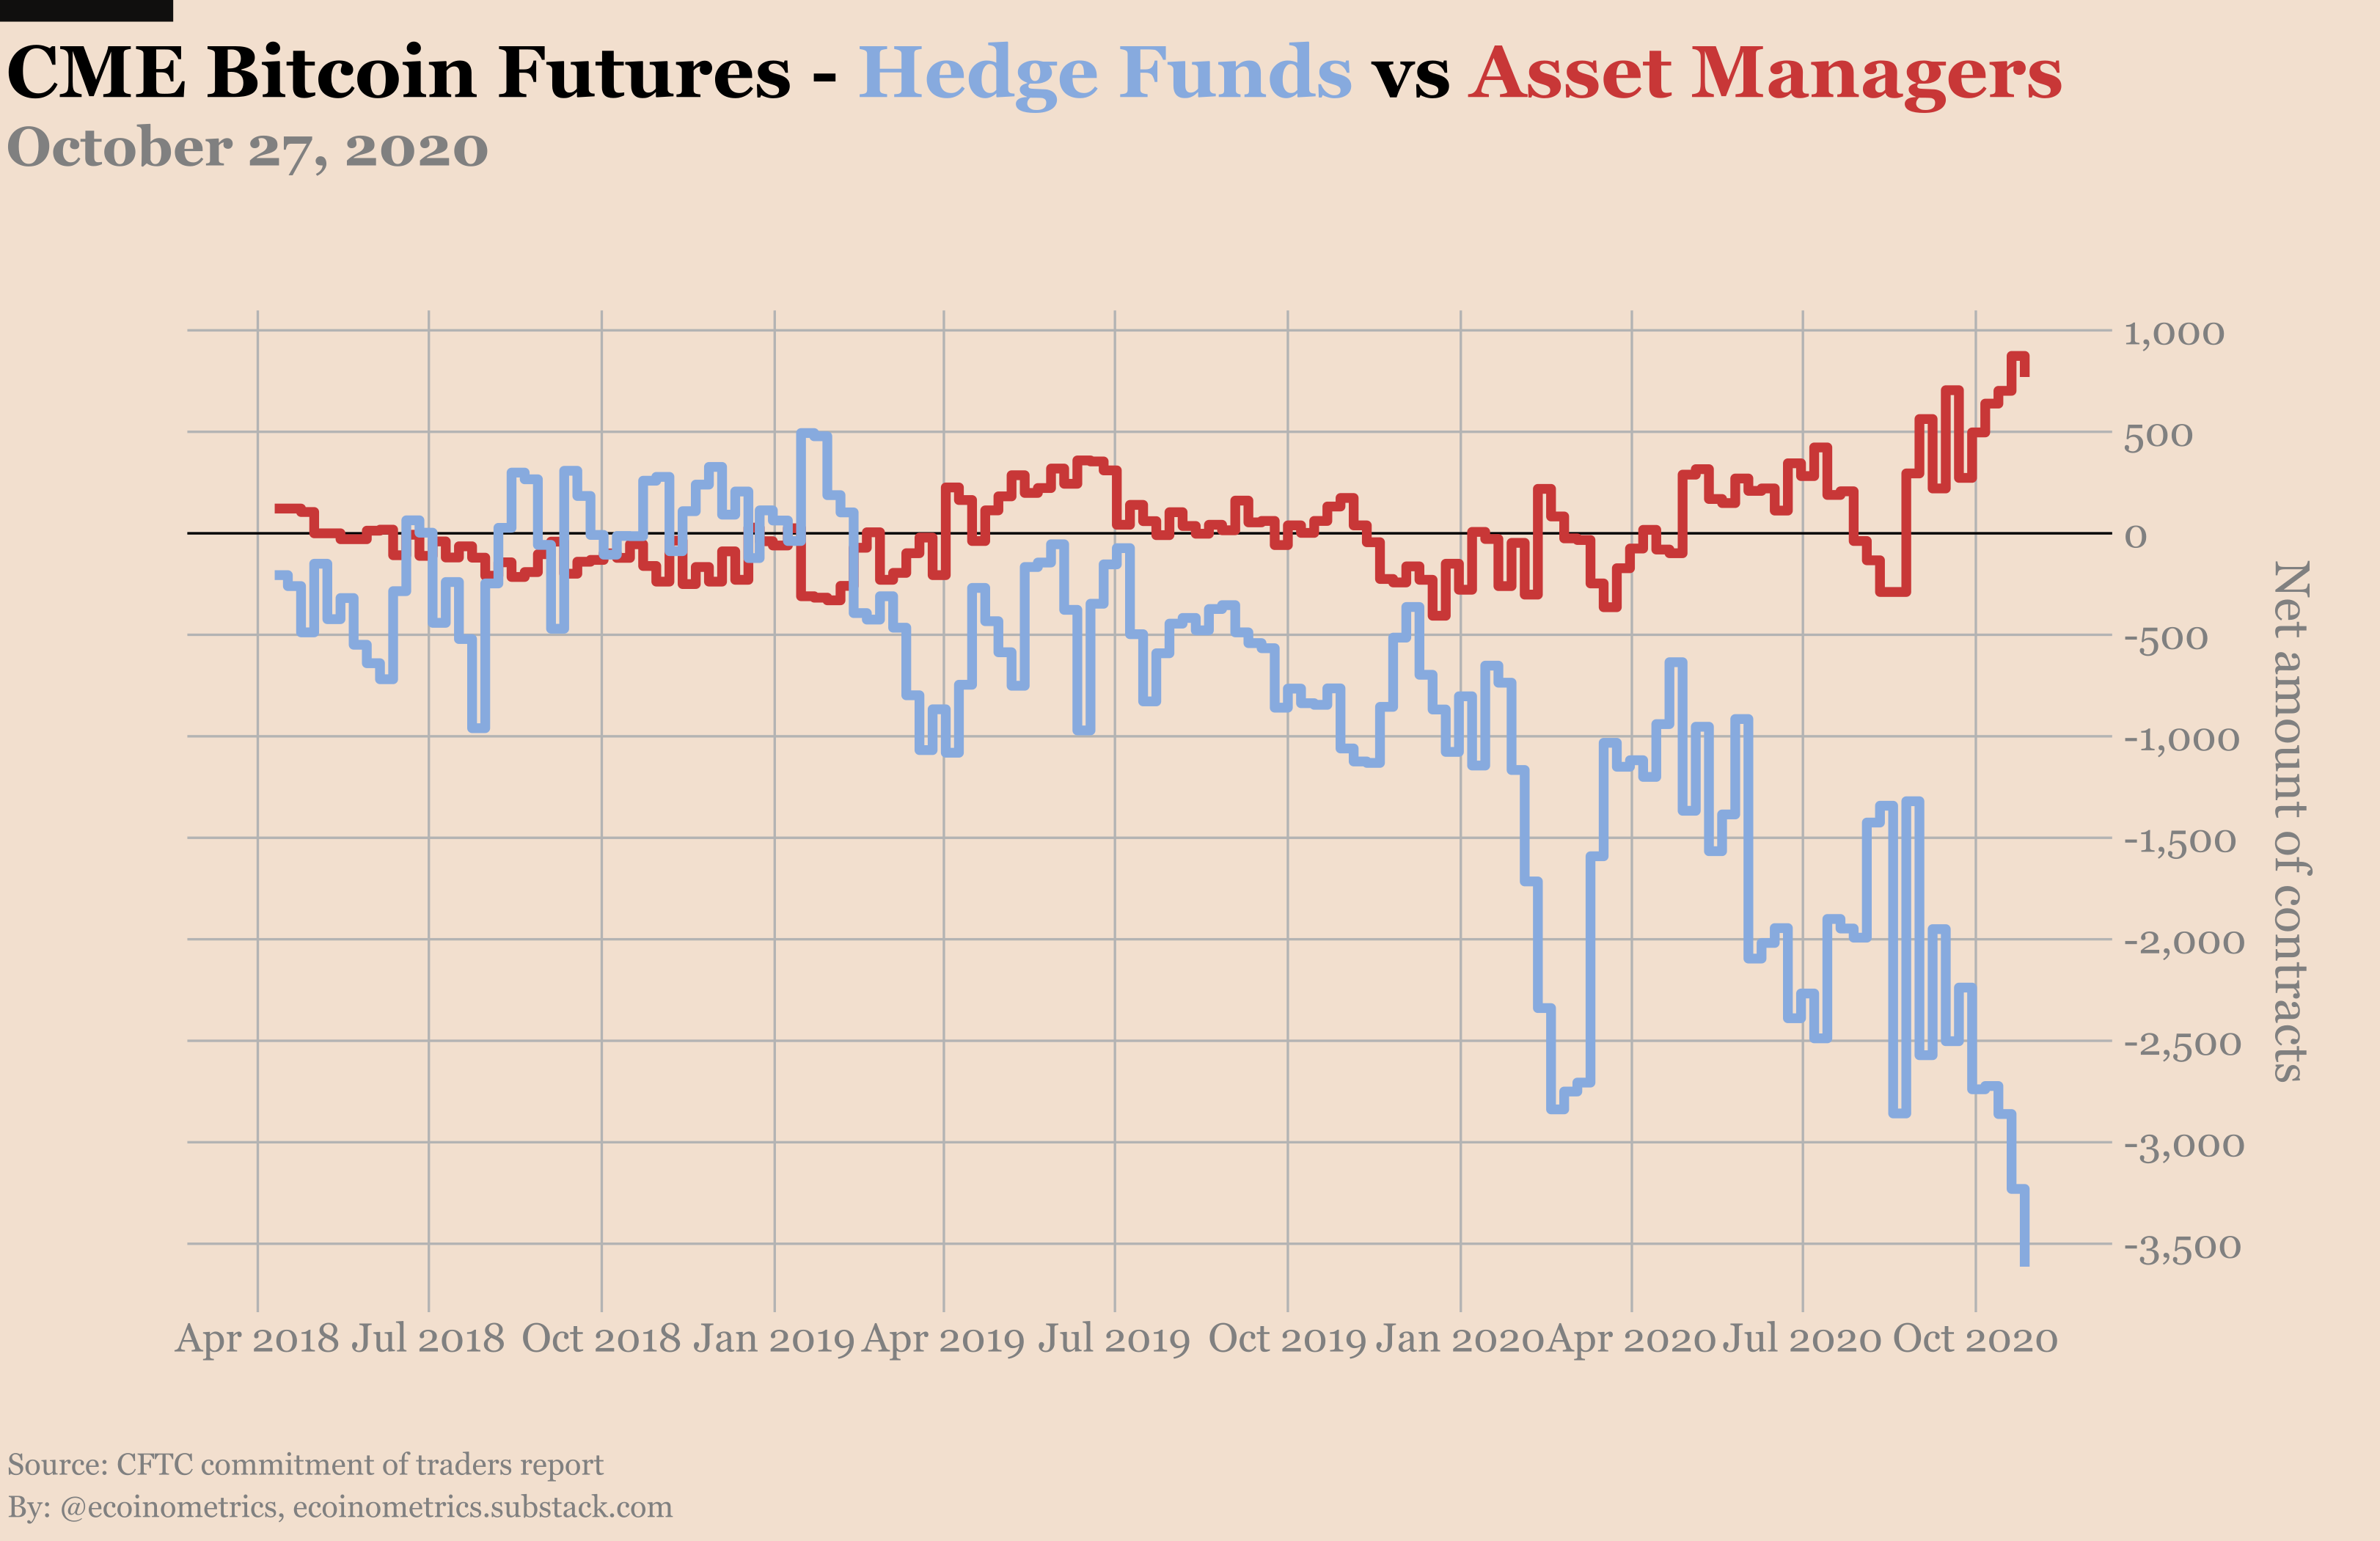
When it comes to the breakdown of positions the Commitment of Traders data up to October 27 doesn’t show much changes.
Retail traders are adding to their long positions but are still coming below the record high level set a few months ago.

On the other side the smart money has never been so short. As it has been the case since the beginning of the year, the basis trade continues to do very well.
At the same time there is also a rise in the long positions up to only a few hundred contracts below 7,000.
That is really what we should pay attention to. When we get a clear uptrend in the blue line below we’ll know that big money will have entered the trend following game.

That’s it for today. If you have learned something please subscribe and share to help the newsletter grow.
Cheers,
Nick
The Ecoinometrics newsletter decrypts Bitcoin’s place in the global financial system. If you want to get an edge in understanding the future of finance you only have to do two things:
Click on the subscribe button right below.
Follow Ecoinometrics on Twitter at https://twitter.com/ecoinometrics.
Done? That’s great! Thank you and enjoy.